Jobs
Mapped: Unemployed Workers vs. Job Openings, by U.S. State
Mapped: Unemployed Workers vs. Job Openings, by U.S. State
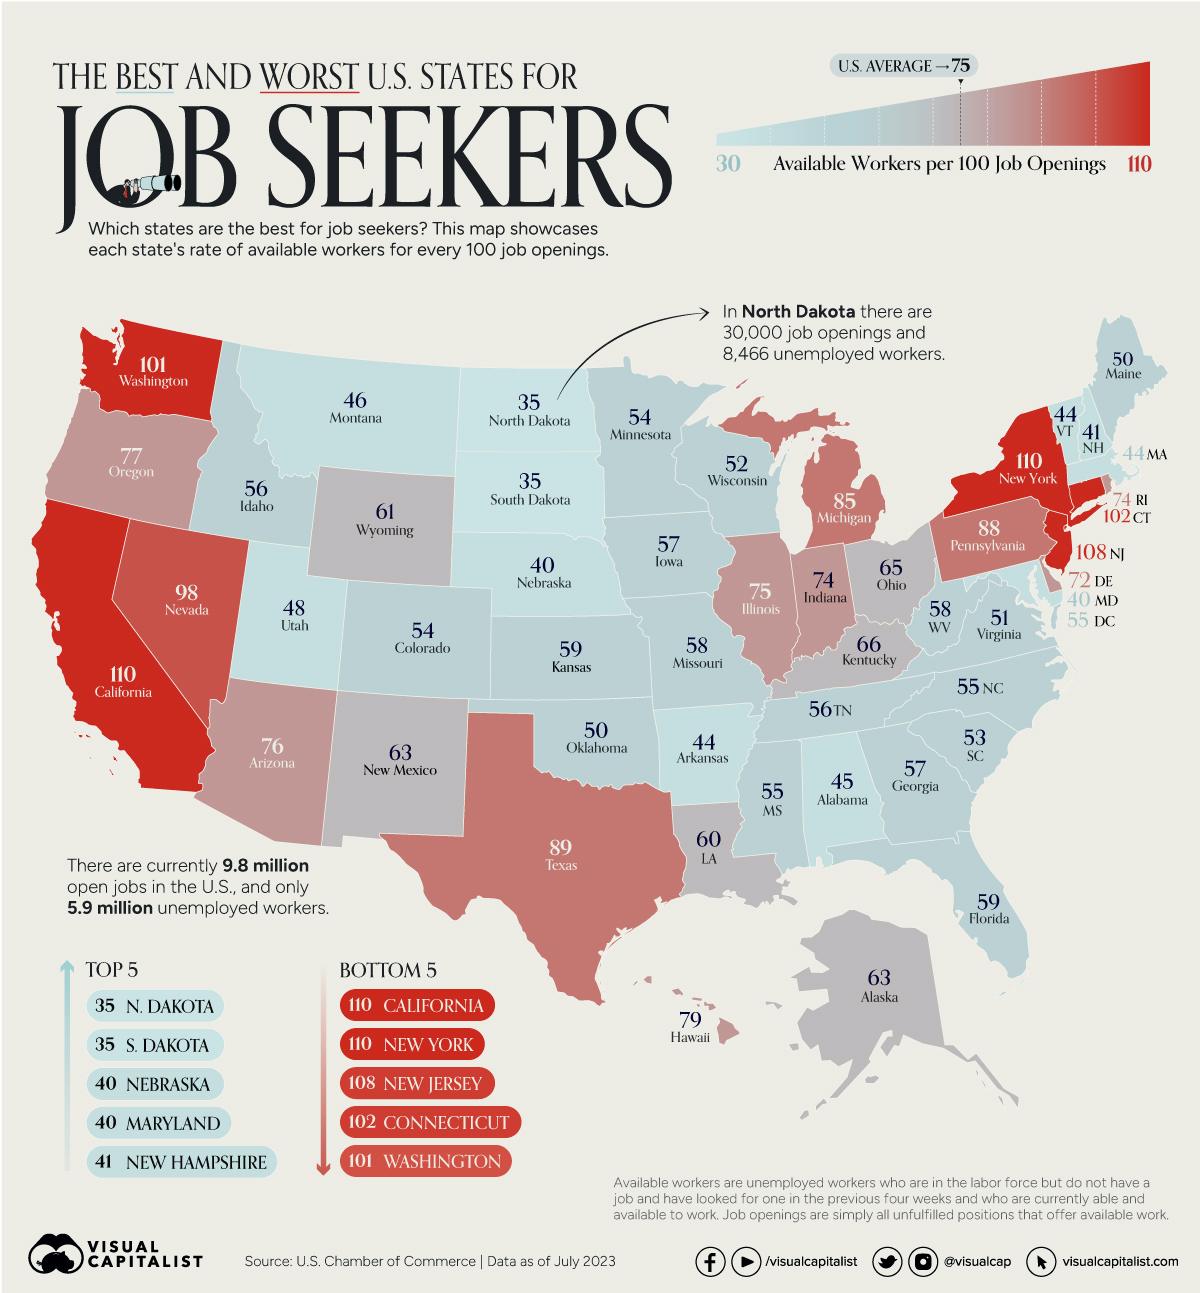
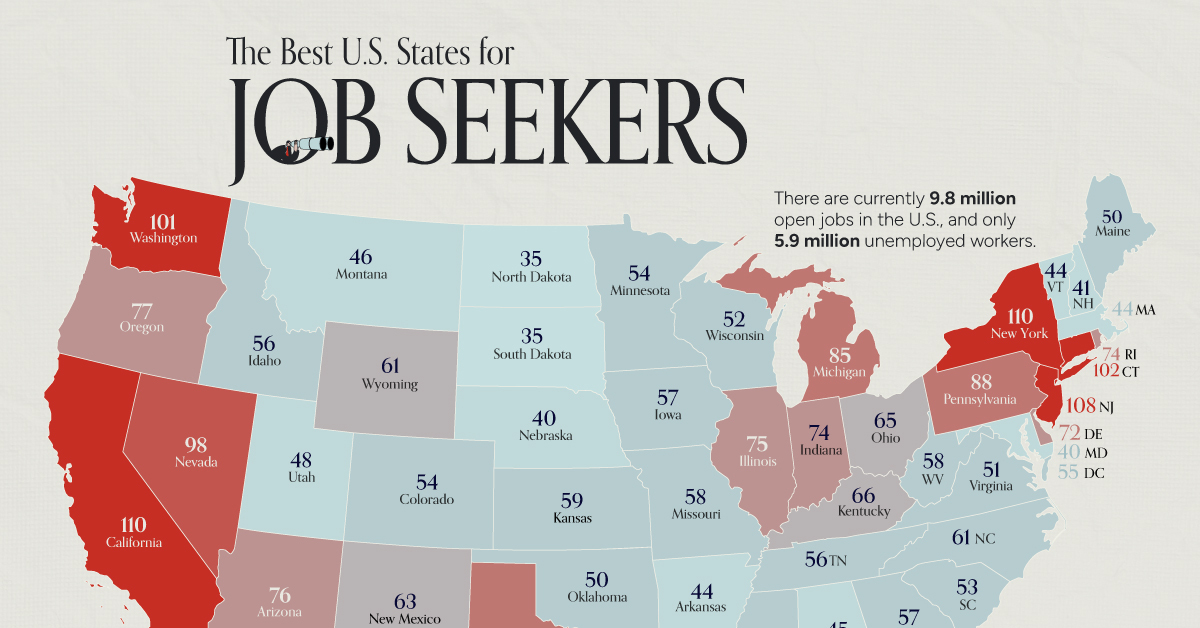
In the United States, there were about 75 workers available for every 100 job openings as of July 2023. This means there is a significant gap between labor and jobs available, but also many opportunities present in some states for potential job seekers.
This map, using data from the U.S. Chamber of Commerce, showcases the number of available workers per 100 job openings in each U.S. state.
Note: Available workers are unemployed workers who are in the labor force but do not have a job, have looked for one in the previous four weeks, and are currently able and available to work. Job openings are simply all unfulfilled positions that offer available work.
Workers and Job Openings by State
The below table lists out the number of unemployed workers per 100 jobs in every state.
Higher ratios, such as 110 workers per 100 job openings, mean there is more competition for each job opening in that state. Lower ratios suggest that it is harder to find workers in a given state.
| Rank | State | Available Workers per 100 Job Openings |
|---|---|---|
| #T1 | California | 110.0 |
| #T1 | New York | 110.0 |
| #3 | New Jersey | 108.0 |
| #4 | Connecticut | 102.0 |
| #5 | Washington | 101.0 |
| #6 | Nevada | 98.0 |
| #7 | Texas | 89.0 |
| #8 | Pennsylvania | 88.0 |
| #9 | Michigan | 85.0 |
| #10 | Hawaii | 79.0 |
| #11 | Oregon | 77.0 |
| #12 | Arizona | 76.0 |
| #13 | Illinois | 75.0 |
| #T14 | Indiana | 74.0 |
| #T14 | Rhode Island | 74.0 |
| #16 | Delaware | 72.0 |
| #17 | Kentucky | 66.0 |
| #18 | Ohio | 65.0 |
| #T19 | Alaska | 63.0 |
| #T19 | New Mexico | 63.0 |
| #21 | Wyoming | 61.0 |
| #22 | Louisiana | 60.0 |
| #T23 | Florida | 59.0 |
| #T23 | Kansas | 59.0 |
| #T25 | Missouri | 58.0 |
| #T25 | West Virginia | 58.0 |
| #T27 | Georgia | 57.0 |
| #T27 | Iowa | 57.0 |
| #T29 | Idaho | 56.0 |
| #T29 | Tennessee | 56.0 |
| #T31 | District of Columbia | 55.0 |
| #T31 | Mississippi | 55.0 |
| #T31 | North Carolina | 55.0 |
| #T34 | Colorado | 54.0 |
| #T34 | Minnesota | 54.0 |
| #36 | South Carolina | 53.0 |
| #37 | Wisconsin | 52.0 |
| #38 | Virginia | 51.0 |
| #T39 | Maine | 50.0 |
| #T39 | Oklahoma | 50.0 |
| #41 | Utah | 48.0 |
| #42 | Montana | 46.0 |
| #43 | Alabama | 45.0 |
| #T44 | Arkansas | 44.0 |
| #T44 | Massachusetts | 44.0 |
| #T44 | Vermont | 44.0 |
| #47 | New Hampshire | 41.0 |
| #48 | Maryland | 40.0 |
| #49 | Nebraska | 40.0 |
| #50 | North Dakota | 35.0 |
| #51 | South Dakota | 35.0 |
| U.S. Total | 75.0 |
While states like New Jersey and California have more workers that they know what to do with, states like North Dakota have a 0.35 ratio of people to jobs, potentially tipping the balance of power to job seekers.
Over the last three years, job openings have increased the most in the state of Georgia, where there were only 0.57 people available for every open role in July. But despite growth in open positions, unemployment has hardly changed over the last year, wavering around 3%.
The Reason for the Gap
“If every unemployed person in the country found a job, we would still have 4 million open jobs.”– U.S. Chamber of Commerce
According to the U.S. Chamber of Commerce, the main driver of the current labor shortage was the COVID-19 pandemic, forcing more than 100,000 businesses to close temporarily and resulting in millions losing their jobs.
Subsequent government support for those who lost work and other subsidies made it easier for people to stay home and out of the workforce. A Chamber of Commerce survey found that 1-in-5 people have changed their work style since the pandemic, with 17% having retired, 19% having transitioned to a homemaker role, and another 14% working only part time.
The industries with the highest unemployment rates are also those that have added the most jobs, with leisure and hospitality experiencing the highest rates (5.1%) just ahead of wholesale and retail trade (4.4%).
Overall, though the job marker has started to cool somewhat, hiring is still outpacing quit rates. The national quit rate in July 2023 was 3.8%, compared to a hiring rate of 4%. And with 9.8 million job openings in the U.S., there should be ample opportunities for job seekers.
Where does this data come from?
Source: U.S. Chamber of Commerce
Notes/Definitions: Hire rates are calculated by dividing the number of hires by employment and multiplying that quotient by 100. Quit rates are calculated by estimating the number of quits for a reference period, then dividing quits by employment and multiplying by 100. The labor force participation rate is the share of the population that is either working or actively looking for work. Unemployment rates are calculated as the share of the labor force that is unemployed.


Jobs
The Best U.S. Companies to Work for According to LinkedIn
We visualized the results of a LinkedIn study on the best U.S. companies to work for in 2024.
The Best U.S. Companies to Work for According to LinkedIn
This was originally posted on our Voronoi app. Download the app for free on iOS or Android and discover incredible data-driven charts from a variety of trusted sources.
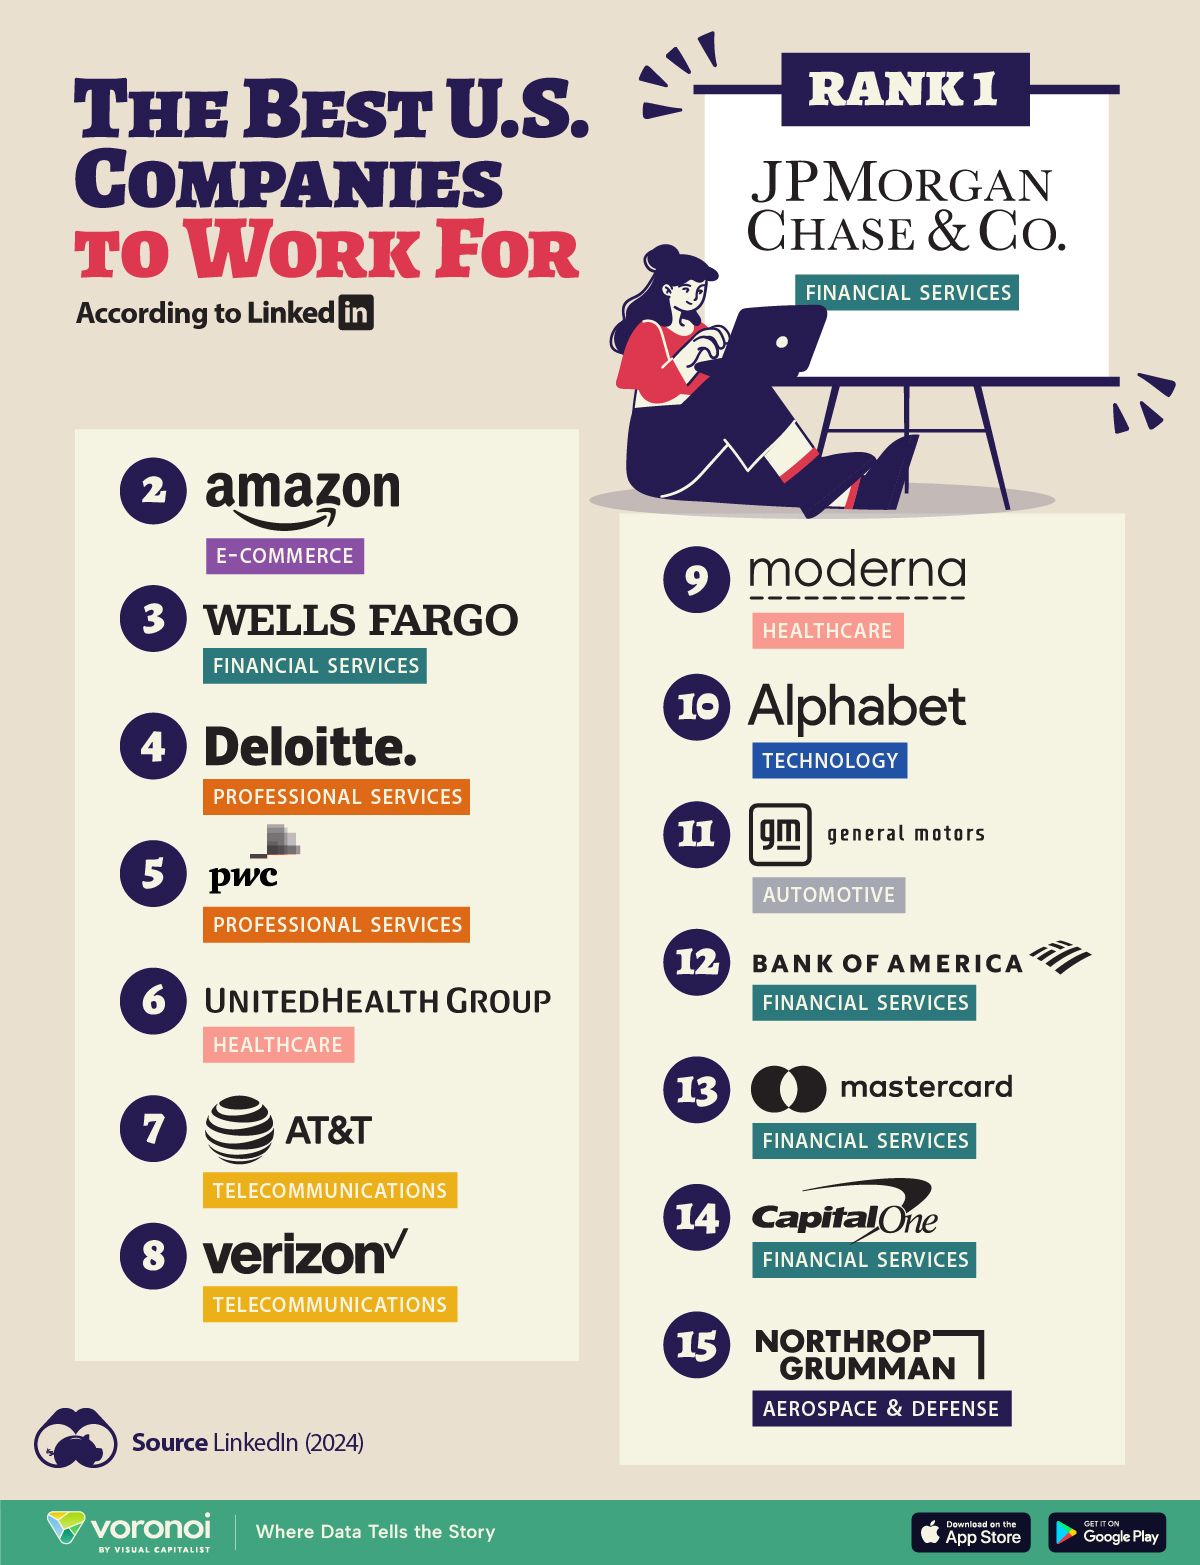
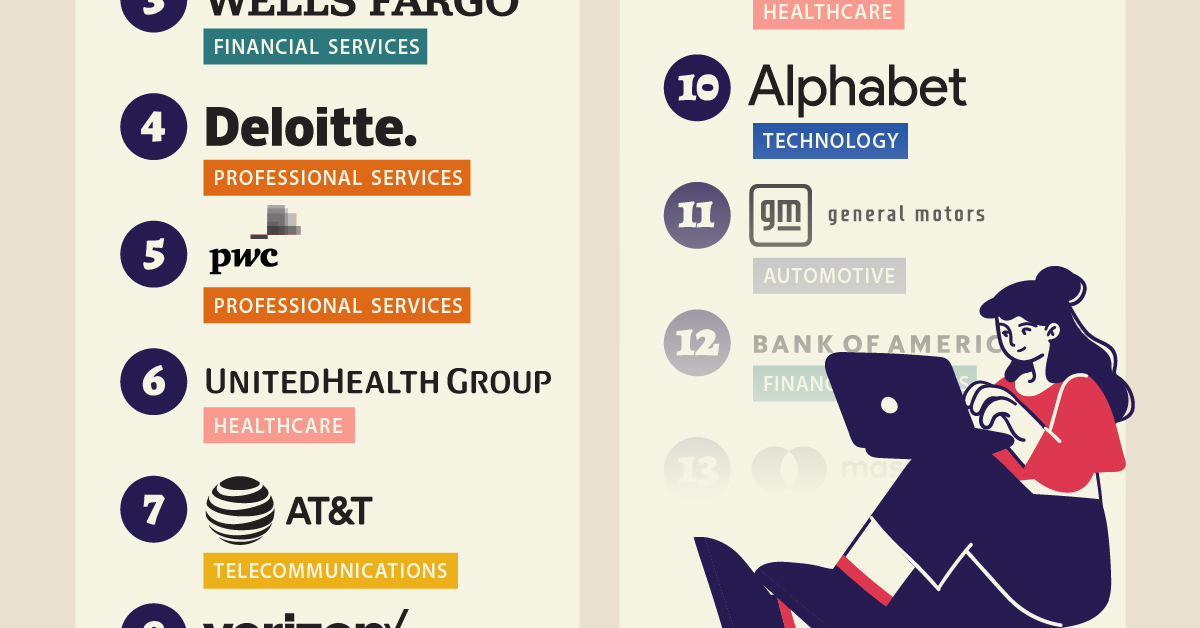
In this graphic, we list the 15 best U.S. companies to work for in 2024, according to LinkedIn data.
LinkedIn ranked companies based on eight pillars: ability to advance, skills growth, company stability, external opportunity, company affinity, gender diversity, educational background, and employee presence in the country.
To be eligible, companies must have had 5,000 or more global employees, with at least 500 in the country as of December 31, 2023.
Data and Highlights
Financial institutions dominate the ranking of the best U.S. companies to work for in 2024, with JP Morgan Chase & Co. ranking first.
| Rank | Company | Industry |
|---|---|---|
| 1 | JP Morgan Chase & Co. | Financial Services |
| 2 | Amazon | E-commerce |
| 3 | Wells Fargo | Financial Services |
| 4 | Deloitte | Professional Services |
| 5 | PwC | Professional Services |
| 6 | UnitedHealth Group | Healthcare |
| 7 | AT&T | Telecommunications |
| 8 | Verizon | Telecommunications |
| 9 | Moderna | Pharmaceuticals |
| 10 | Alphabet Inc. | Technology |
| 11 | General Motors | Automotive |
| 12 | Bank of America | Financial Services |
| 13 | Mastercard | Financial Services |
| 14 | Capital One | Financial Services |
| 15 | Northrop Grumman | Aerospace & Defense |
J.P. Morgan has a program that offers opportunities for candidates without a university degree. In fact, in 2022, 75% of job descriptions at the bank for experienced hires did not require a college degree.
Meanwhile, Deloitte and Amazon offer a variety of free training courses, including in AI.
Moderna includes in its employee package benefits to help avoid employee burnout — from subsidized commuter expenses and pop-up daycare centers, to wellness coaches.
Mastercard offers flexible work availability, with 11.5% remote and 89% hybrid options.
It’s also interesting to note that only Amazon and Alphabet made the cut from the ‘Magnificent Seven’ companies (Apple, Microsoft, Google parent Alphabet, Amazon, Nvidia, Meta Platforms, and Tesla).
See more about the best companies to work for in this infographic, which covers a separate ranking from Glassdoor.

-

 Markets5 days ago
Mapped: The Most Valuable Company in Each Southeast Asian Country
-

 Markets2 weeks ago
The Top Private Equity Firms by Country
-

 Jobs2 weeks ago
The Best U.S. Companies to Work for According to LinkedIn
-

 Economy2 weeks ago
Ranked: The Top 20 Countries in Debt to China
-

 Politics1 week ago
Charted: Trust in Government Institutions by G7 Countries
-

 Energy1 week ago
Mapped: The Age of Energy Projects in Interconnection Queues, by State
-

 Mining1 week ago
Visualizing Global Gold Production in 2023
-

 Markets1 week ago
Visualized: Interest Rate Forecasts for Advanced Economies