Politics
U.S. Military Personnel Deployments by Country
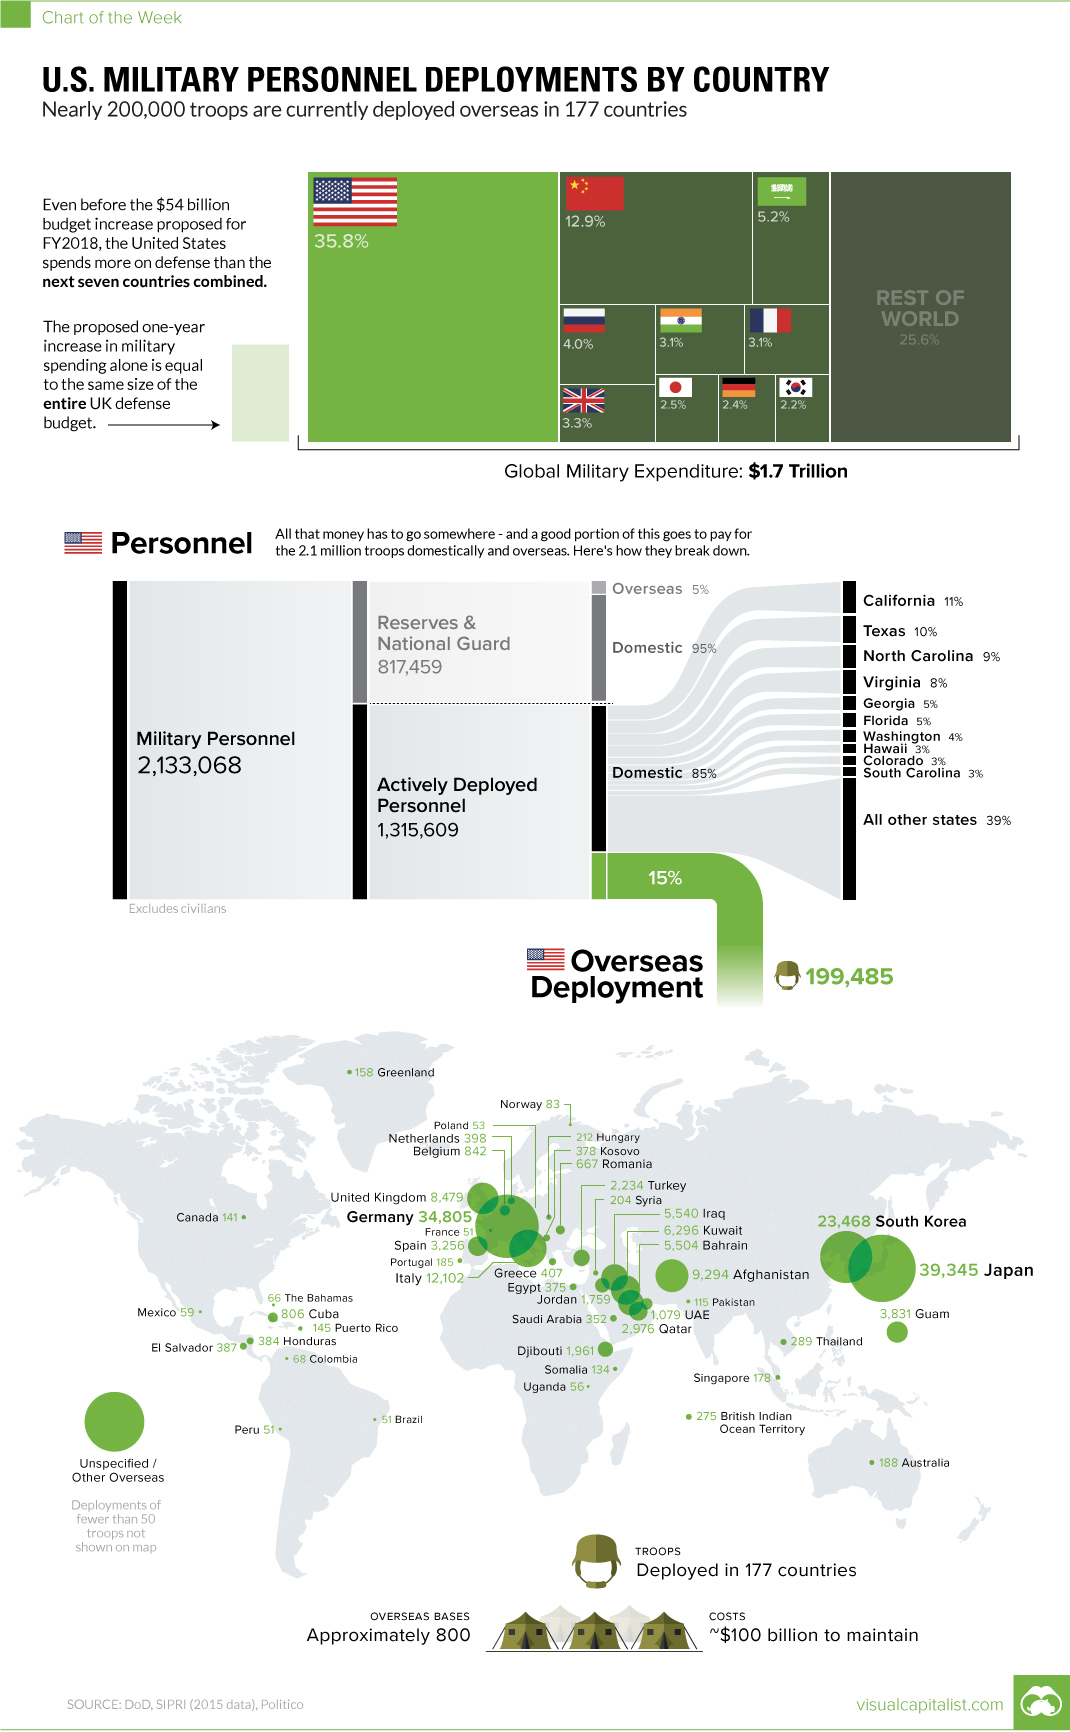
U.S. Military Personnel Deployments by Country
200k active troops overseas in 177 countries
The Chart of the Week is a weekly Visual Capitalist feature on Fridays.
There was no shortage of cuts proposed in Trump’s budget for 2018, which was released earlier this week.
However, one of the few departments that did not receive a haircut was the Department of Defense. If the proposed budget ultimately passes in Congress, the DoD would be allocated an extra $54 billion in federal funding – a 10% increase that would be one of the largest one-year defense budget increases in American History.
To put the proposed increase in context, the United States already spends more on defense than the next seven countries combined. Meanwhile, the additional $54 billion is about the size of the United Kingdom’s entire defense budget.
| Country | Military Spending (2015) | Share |
|---|---|---|
| United States | $596 billion | 35.8% |
| China | $215 billion | 12.9% |
| Saudi Arabia | $87 billion | 5.2% |
| Russia | $66 billion | 4.0% |
| United Kingdom | $55 billion | 3.3% |
| India | $51 billion | 3.1% |
| France | $51 billion | 3.1% |
| Japan | $41 billion | 2.5% |
| Germany | $39 billion | 2.4% |
| South Korea | $36 billion | 2.2% |
| Others | $427 billion | 25.6% |
“Be All You Can Be”
With over half of all U.S. discretionary spending being put towards the military each year, the U.S. is able to have extensive operations both at home and abroad. Our chart for this week breaks down military personnel based on the latest numbers released by the DoD on February 27, 2017.
In total, excluding civilian support staff, there are about 2.1 million troops. Of those, 1.3 million are on active duty, while about 800,000 are in reserve or part of the National Guard.
On a domestic basis, there are about 1.1 million active troops stationed in the United States, and here’s how they are grouped based on branch of service:
| Military Branch | Active Domestic Personnel | As a Percentage |
|---|---|---|
| Army | 394,236 | 35% |
| Navy | 283,499 | 25% |
| Marine Corps | 149,992 | 13% |
| Air Force | 249,738 | 22% |
| Coast Guard | 38,659 | 3% |
| Total | 1,116,124 | 100% |
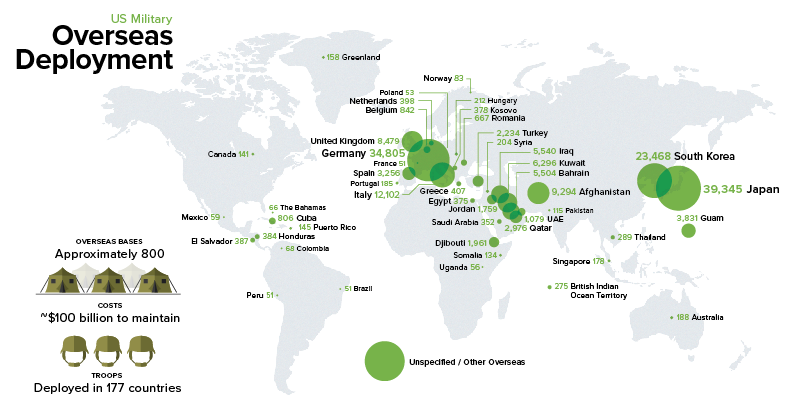
Internationally, there are just under 200,000 troops that are stationed in 177 countries throughout the world.
Here are the top 20 countries they are stationed in, as well as an “Other” category that represents the rest:
| Rank | Country / Territory | U.S. Troops |
|---|---|---|
| #1 | Japan | 39,345 |
| #2 | Germany | 34,805 |
| #3 | South Korea | 23,468 |
| #4 | Italy | 12,102 |
| #5 | Afghanistan | 9,294 |
| #6 | United Kingdom | 8,479 |
| #7 | Kuwait | 6,296 |
| #8 | Iraq | 5,540 |
| #9 | Bahrain | 5,504 |
| #10 | Guam | 3,831 |
| #11 | Spain | 3,256 |
| #12 | Qatar | 2,976 |
| #13 | Turkey | 2,234 |
| #14 | Djibouti | 1,961 |
| #15 | Jordan | 1,759 |
| #16 | United Arab Emirates | 1,079 |
| #17 | Belgium | 842 |
| #18 | Cuba | 806 |
| #19 | Romania | 667 |
| #20 | Greece | 407 |
| Other / Unknown | 34,834 | |
| Total | 199,485 |
In 2015, Politico estimated that there are 800 U.S. bases abroad, and that it costs up to $100 billion annually to maintain this international presence.


Politics
Charted: Trust in Government Institutions by G7 Countries
How much do you trust the government and its various institutions? We look at data for G7 countries for the time period of 2006-2023.


Trust in Government Institutions by G7 Countries
This was originally posted on our Voronoi app. Download the app for free on iOS or Android and discover incredible data-driven charts from a variety of trusted sources.
How much do you trust the government, and its various institutions?
It’s likely that your level of confidence probably depends on a wide range of factors, such as perceived competency, historical context, economic performance, accountability, social cohesion, and transparency.
And for these same reasons, trust levels in government institutions also change all the time, even in the world’s most developed countries: the G7.
Confidence in Government by G7 Countries (2006-2023)
This chart looks at the changes in trust in government institutions between the years 2006 and 2023, based on data from a multi-country Gallup poll.
Specifically, this dataset aggregates confidence in multiple national institutions, including the military, the judicial system, the national government, and the integrity of the electoral system.
| Country | Confidence (2006) | Confidence (2023) | Change (p.p.) |
|---|---|---|---|
| Canada | 57% | 64% | +7 |
| Britain | 63% | 63% | +0 |
| Germany | 55% | 61% | +6 |
| France | 54% | 60% | +6 |
| Japan | 48% | 59% | +11 |
| Italy | 41% | 54% | +13 |
| United States | 63% | 50% | -13 |
What’s interesting here is that in the G7, a group of the world’s most developed economies, there is only one country bucking the general trend: the United States.
Across most G7 countries, confidence in institutions has either improved or stayed the same between 2006 and 2023. The largest percentage point (p.p.) increases occur in Italy and Japan, which saw +13 p.p. and +11 p.p. increases in trust over the time period.
In the U.S., however, confidence in government institutions has fallen by 13 p.p. over the years. What happened?
Key Figures on U.S. Trust in Institutions
In 2006, the U.S. was tied with the UK as having the highest confidence in government institutions, at 63%.
But here’s where the scores stand in 2023, across various institutions:
| 🇺🇸 Institutions | Confidence (2023) |
|---|---|
| Military | 81% |
| Judiciary | 42% |
| National Government | 30% |
| Elections | 44% |
| Overall | 49% |
Based on this data, it’s clear that the U.S. lags behind in three key indicators: confidence in the national government, confidence in the justice system, and confidence in fair elections. It ranked in last place for each indicator in the G7.
One other data point that stands out: despite leading the world in military spending, the U.S. is only the third most confident in its military in the G7. It lags behind France (86%) and the United Kingdom (83%).

-

 Wealth6 days ago
Charted: Which City Has the Most Billionaires in 2024?
-

 Mining2 weeks ago
Gold vs. S&P 500: Which Has Grown More Over Five Years?
-

 Uranium2 weeks ago
The World’s Biggest Nuclear Energy Producers
-

 Education2 weeks ago
How Hard Is It to Get Into an Ivy League School?
-

 Debt2 weeks ago
How Debt-to-GDP Ratios Have Changed Since 2000
-

 Sports2 weeks ago
The Highest Earning Athletes in Seven Professional Sports
-

 Science2 weeks ago
Visualizing the Average Lifespans of Mammals
-

 Brands1 week ago
How Tech Logos Have Evolved Over Time