Misc
Ranked: The 50 Most Popular Fast Food Chains in America


The 50 Most Popular Fast Food Chains in America
Millions of Americans eat at fast food restaurants every day—and they now have more options at their disposal than ever before.
From burgers to pad thai, there’s a quick service restaurant that’ll satisfy almost any appetite. With all this choice, which fast food chains are the most popular among consumers?
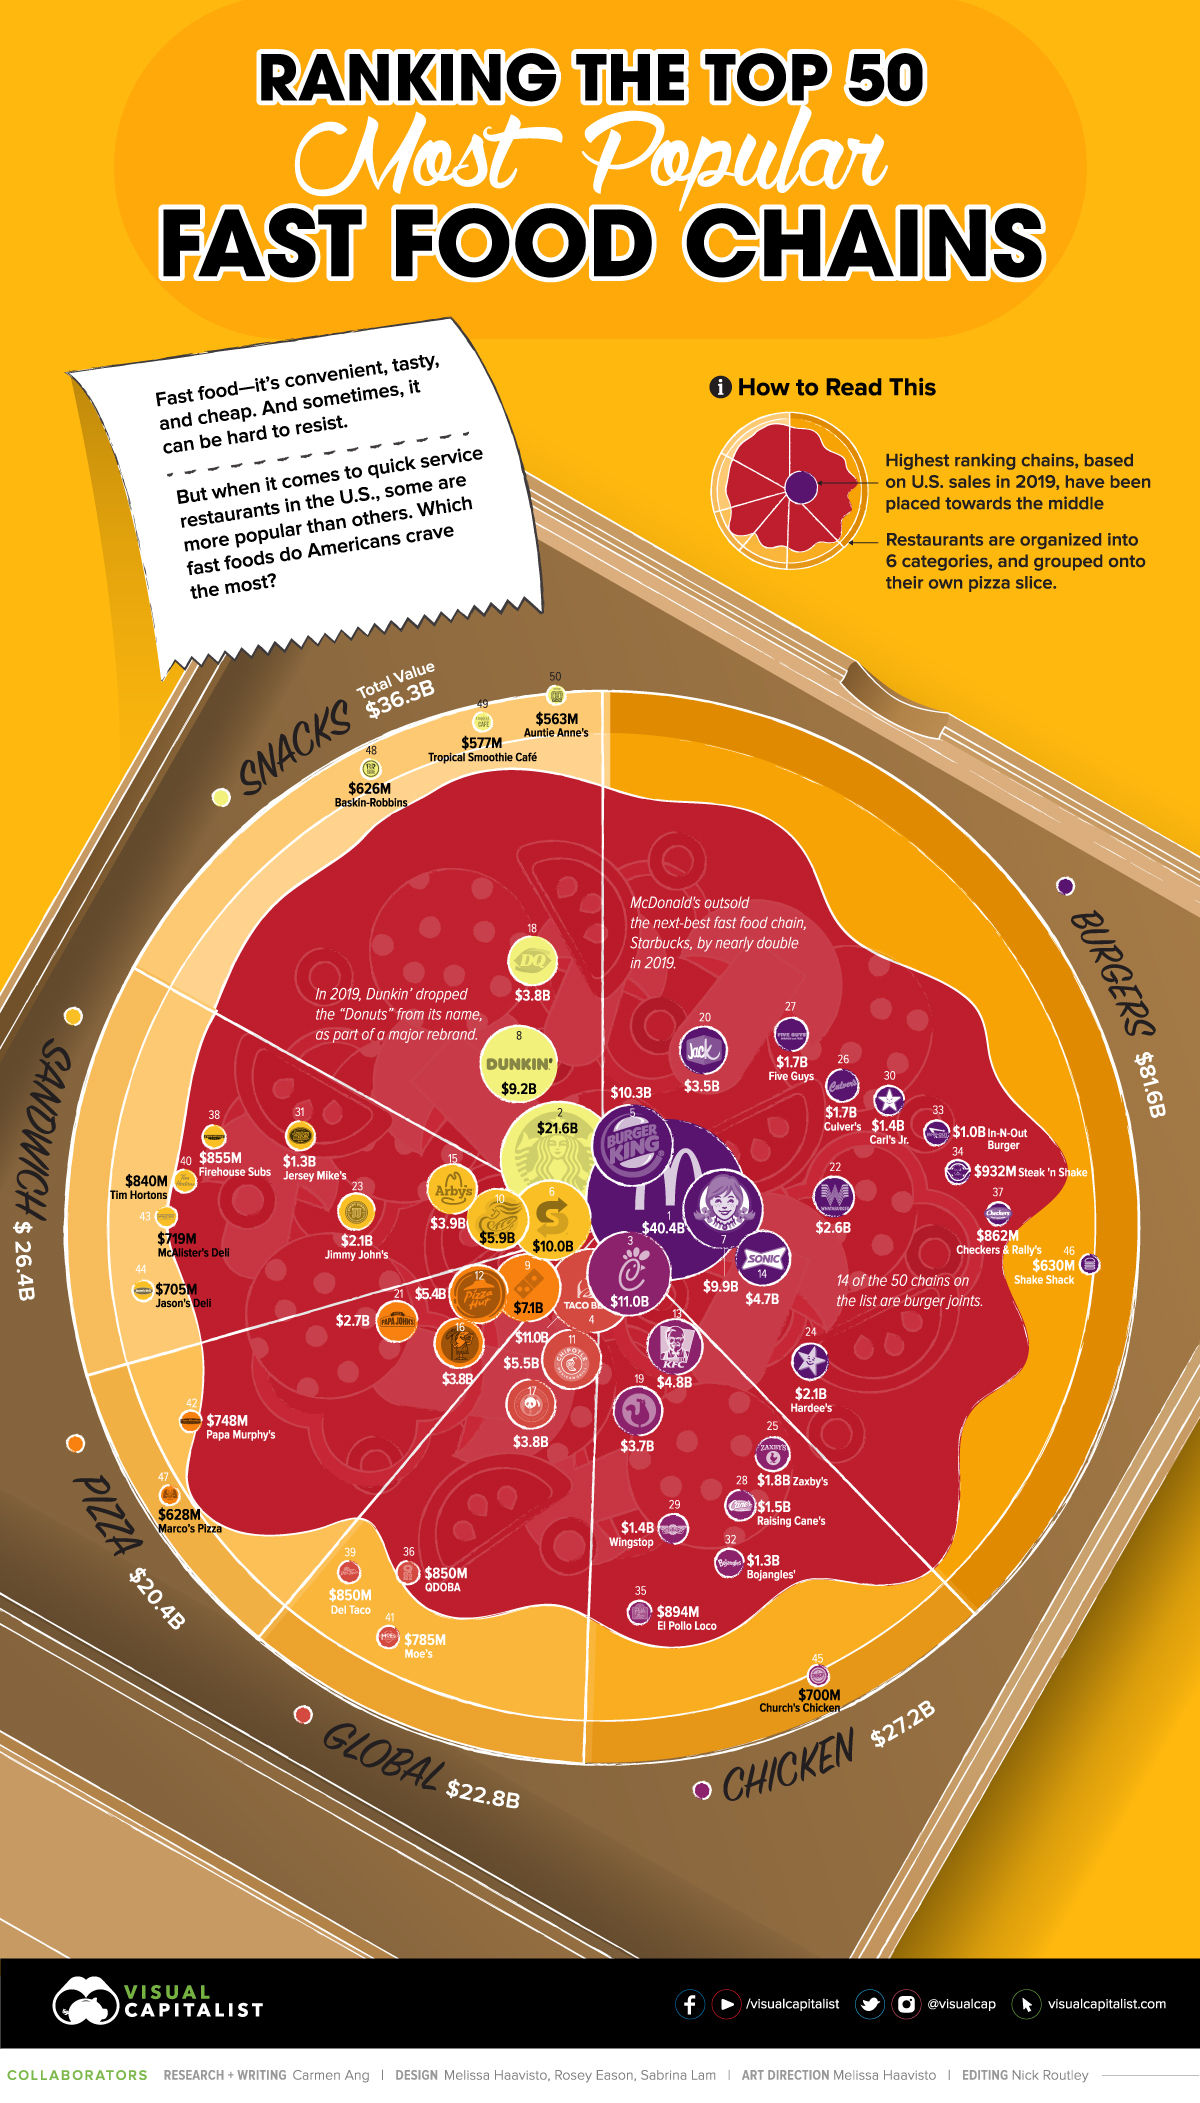
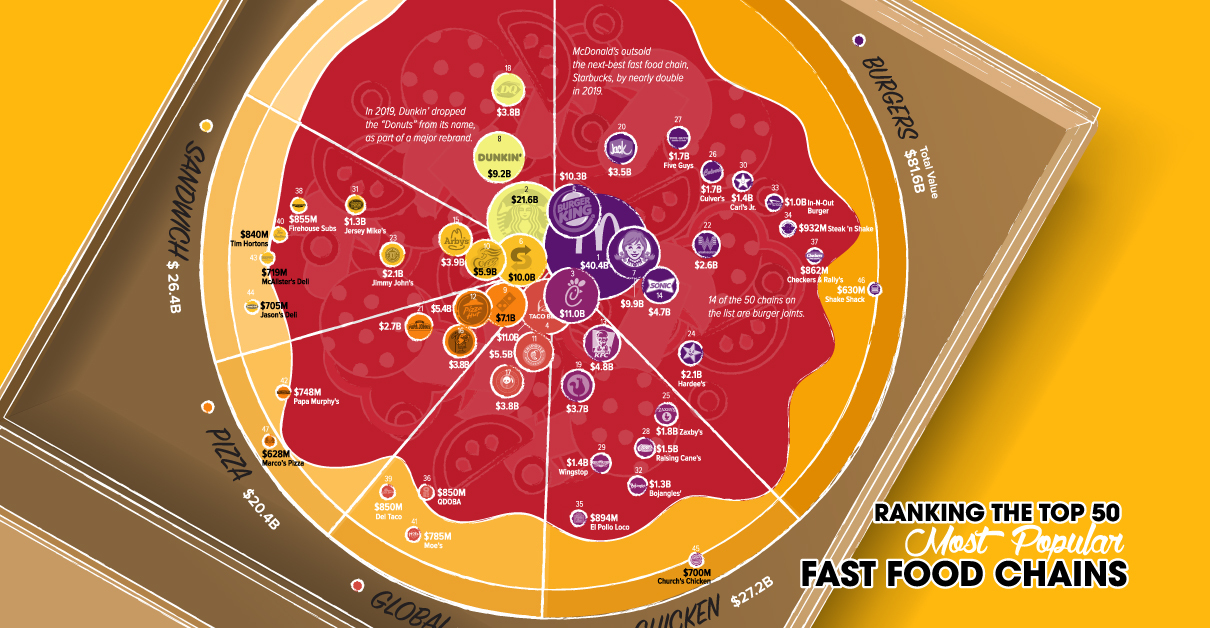
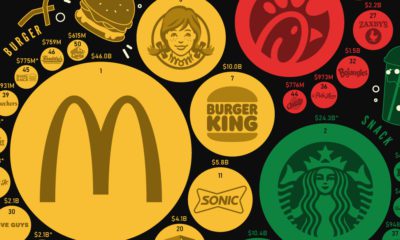
Using data from QSR Magazine, today’s infographic ranks the top 50 largest fast food chains in the U.S. by sales in 2019, providing insight into the types of foods Americans have been craving.
Fast Food Chains Ranked, by Revenue
In 2019, the 50 largest fast food chains in the U.S. generated over $200 billion in revenue. How do these quick service giants stack up against each other?
| Rank | Company | Category | U.S. Sales, Billions (2019) |
|---|---|---|---|
| 1 | McDonald's | Burger | $40.41 |
| 2 | Starbucks | Snack | $21.55 |
| 3 | Chick-fil-A | Chicken | $11.00 |
| 4 | Taco Bell | Global | $11.00 |
| 5 | Burger King | Burger | $10.30 |
| 6 | Subway | Sandwich | $10.00 |
| 7 | Wendy's | Burger | $9.87 |
| 8 | Dunkin' | Snack | $9.22 |
| 9 | Domino's | Pizza | $7.10 |
| 10 | Panera Bread | Sandwich | $5.93 |
| 11 | Chipotle | Global | $5.52 |
| 12 | Pizza Hut | Pizza | $5.38 |
| 13 | KFC | Chicken | $4.82 |
| 14 | Sonic Drive-In | Burger | $4.69 |
| 15 | Arby's | Sandwich | $3.89 |
| 16 | Little Caesars | Pizza | $3.85 |
| 17 | Panda Express | Global | $3.80 |
| 18 | Dairy Queen | Snack | $3.76 |
| 19 | Popeyes Louisiana Kitchen | Chicken | $3.75 |
| 20 | Jack in the Box | Burger | $3.51 |
| 21 | Papa John's | Pizza | $2.66 |
| 22 | Whataburger | Burger | $2.56 |
| 23 | Jimmy John's | Sandwich | $2.11 |
| 24 | Hardee's | Burger | $2.07 |
| 25 | Zaxby's | Chicken | $1.84 |
| 26 | Culver's | Burger | $1.73 |
| 27 | Five Guys | Burger | $1.66 |
| 28 | Raising Cane's | Chicken | $1.47 |
| 29 | Wingstop | Chicken | $1.40 |
| 30 | Carl's Jr. | Burger | $1.39 |
| 31 | Jersey Mike's | Sandwich | $1.34 |
| 32 | Bojangles' | Chicken | $1.29 |
| 33 | In-N-Out Burger | Burger | $1.00 |
| 34 | Steak 'n Shake | Burger | $0.93 |
| 35 | El Pollo Loco | Chicken | $0.89 |
| 36 | QDOBA | Global | $0.85 |
| 37 | Checkers/Rally's | Burger | $0.86 |
| 38 | Firehouse Subs | Sandwich | $0.86 |
| 39 | Del Taco | Global | $0.85 |
| 40 | Tim Hortons | Sandwich | $0.84 |
| 41 | Moe's | Global | $0.79 |
| 42 | Papa Murphy's | Pizza | $0.75 |
| 43 | McAlister's Deli | Sandwich | $0.72 |
| 44 | Jason's Deli | Sandwich | $0.71 |
| 45 | Church's Chicken | Chicken | $0.70 |
| 46 | Shake Shack | Burger | $0.63 |
| 47 | Marco's Pizza | Pizza | $0.63 |
| 48 | Baskin-Robbins | Snack | $0.63 |
| 49 | Tropical Smoothie Café | Snack | $0.58 |
| 50 | Auntie Anne's | Snack | $0.56 |
Unsurprisingly, McDonald’s comes in at number one with over $40 billion in sales. Despite a scandal involving its former CEO, McDonald’s still managed to significantly outsell its peers—the company made almost double that of the second-largest fast food chain, Starbucks.
But don’t worry, Starbucks did just fine for itself. With $21 billion in sales, the Seattle-based coffee chain saw a 5% increase compared to its numbers in 2018.
Top Selling Fast Food Categories
Based on the ranking, it’s clear that Americans still love their McDonald’s. But are burgers, in general, the most popular fast food item?
In short—yes. Burgers are king. Here’s a look at how burgers, pizza, chicken, and other food categories measure up:
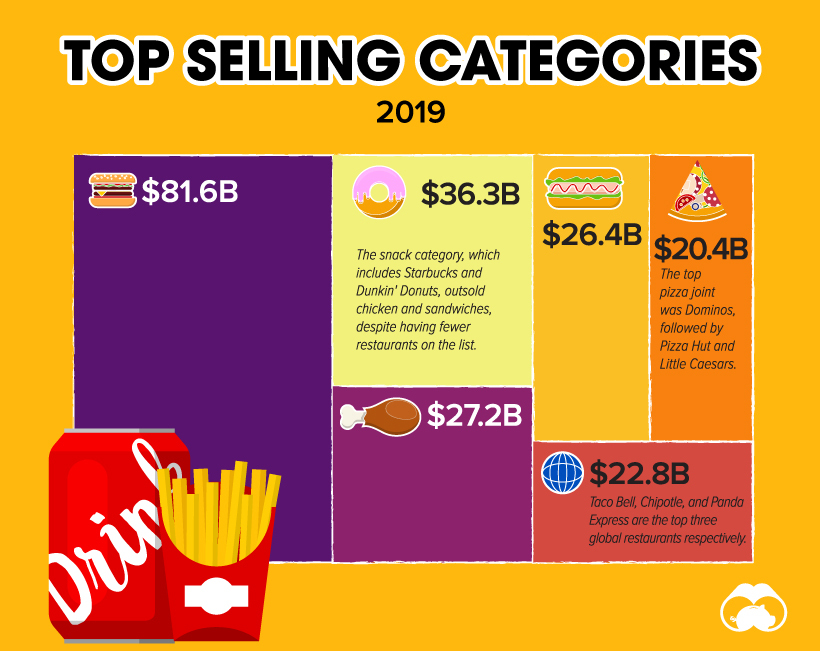
Burger joints remain the most popular fast food option among consumers—14 of the 50 chains on the list are classified as burger restaurants, with $80 billion in collective sales.
Snacks come in at second place, with a total of $36 billion in revenue. Boasting a broad variety of foods from iced coffee to donuts and ice cream, six of the restaurants on the list are included in this category. Starbucks is the most popular, followed by Dunkin’ and Dairy Queen respectively.
While the chicken and sandwich categories both have nine restaurants included in the ranking, chicken restaurants outsold sandwiches by almost $1 billion. This is largely due to Chick-fil-A, which makes up more than a third of all chicken restaurant sales included in the ranking.
COVID Closures
It’s important to note that these numbers reflect the fast food industry before the devastating impacts of COVID-19. The global pandemic has forced many fast food restaurants to adapt, and it’s also triggered a number of restaurant shutdowns.
For instance, McDonald’s is set to permanently close 200 of its 14,000 U.S. locations, and Dunkin’ will be closing 450 restaurants by the end of 2020. Starbucks has also announced it’s planning to permanently shut down up to 400 locations by mid-2021.
With online sales more important than ever, the chains with a strong digital presence may be in a better position to weather the storm. Chains with physical distancing options, such as drive-throughs, could also recover quicker.


VC+
VC+: Get Our Key Takeaways From the IMF’s World Economic Outlook
A sneak preview of the exclusive VC+ Special Dispatch—your shortcut to understanding IMF’s World Economic Outlook report.

Have you read IMF’s latest World Economic Outlook yet? At a daunting 202 pages, we don’t blame you if it’s still on your to-do list.
But don’t worry, you don’t need to read the whole April release, because we’ve already done the hard work for you.
To save you time and effort, the Visual Capitalist team has compiled a visual analysis of everything you need to know from the report—and our VC+ Special Dispatch is available exclusively to VC+ members. All you need to do is log into the VC+ Archive.
If you’re not already subscribed to VC+, make sure you sign up now to access the full analysis of the IMF report, and more (we release similar deep dives every week).
For now, here’s what VC+ members get to see.
Your Shortcut to Understanding IMF’s World Economic Outlook
With long and short-term growth prospects declining for many countries around the world, this Special Dispatch offers a visual analysis of the key figures and takeaways from the IMF’s report including:
- The global decline in economic growth forecasts
- Real GDP growth and inflation forecasts for major nations in 2024
- When interest rate cuts will happen and interest rate forecasts
- How debt-to-GDP ratios have changed since 2000
- And much more!

Get the Full Breakdown in the Next VC+ Special Dispatch
VC+ members can access the full Special Dispatch by logging into the VC+ Archive, where you can also check out previous releases.
Make sure you join VC+ now to see exclusive charts and the full analysis of key takeaways from IMF’s World Economic Outlook.
Don’t miss out. Become a VC+ member today.
What You Get When You Become a VC+ Member
VC+ is Visual Capitalist’s premium subscription. As a member, you’ll get the following:
- Special Dispatches: Deep dive visual briefings on crucial reports and global trends
- Markets This Month: A snappy summary of the state of the markets and what to look out for
- The Trendline: Weekly curation of the best visualizations from across the globe
- Global Forecast Series: Our flagship annual report that covers everything you need to know related to the economy, markets, geopolitics, and the latest tech trends
- VC+ Archive: Hundreds of previously released VC+ briefings and reports that you’ve been missing out on, all in one dedicated hub
You can get all of the above, and more, by joining VC+ today.

-

 Mining1 week ago
Gold vs. S&P 500: Which Has Grown More Over Five Years?
-

 Markets2 weeks ago
Ranked: The Most Valuable Housing Markets in America
-

 Money2 weeks ago
Which States Have the Highest Minimum Wage in America?
-

 AI2 weeks ago
Ranked: Semiconductor Companies by Industry Revenue Share
-

 Markets2 weeks ago
Ranked: The World’s Top Flight Routes, by Revenue
-

 Countries2 weeks ago
Population Projections: The World’s 6 Largest Countries in 2075
-

 Markets2 weeks ago
The Top 10 States by Real GDP Growth in 2023
-

 Demographics2 weeks ago
The Smallest Gender Wage Gaps in OECD Countries