Technology
Timeline: The Future of Money
For a larger version of this infographic, click here.
Timeline: The Future of Money
For a larger version of this infographic, click here.
Predicting the future isn’t easy. For example, in 1977 it was predicted by Ken Olsen, a well-known tech entrepreneur at the time, that “There is no reason for any individual to have a computer in his home.”
It was not only an inaccurate prediction, but decades later the exact opposite has happened. Billions of computers now fit in our homes and our pockets. Even refrigerators, thermostats, and alarm clocks are armed with computers that connect to us as the Internet of Things grows exponentially.
As a result, we should take any forward-looking guesses with an open mind and a light heart.
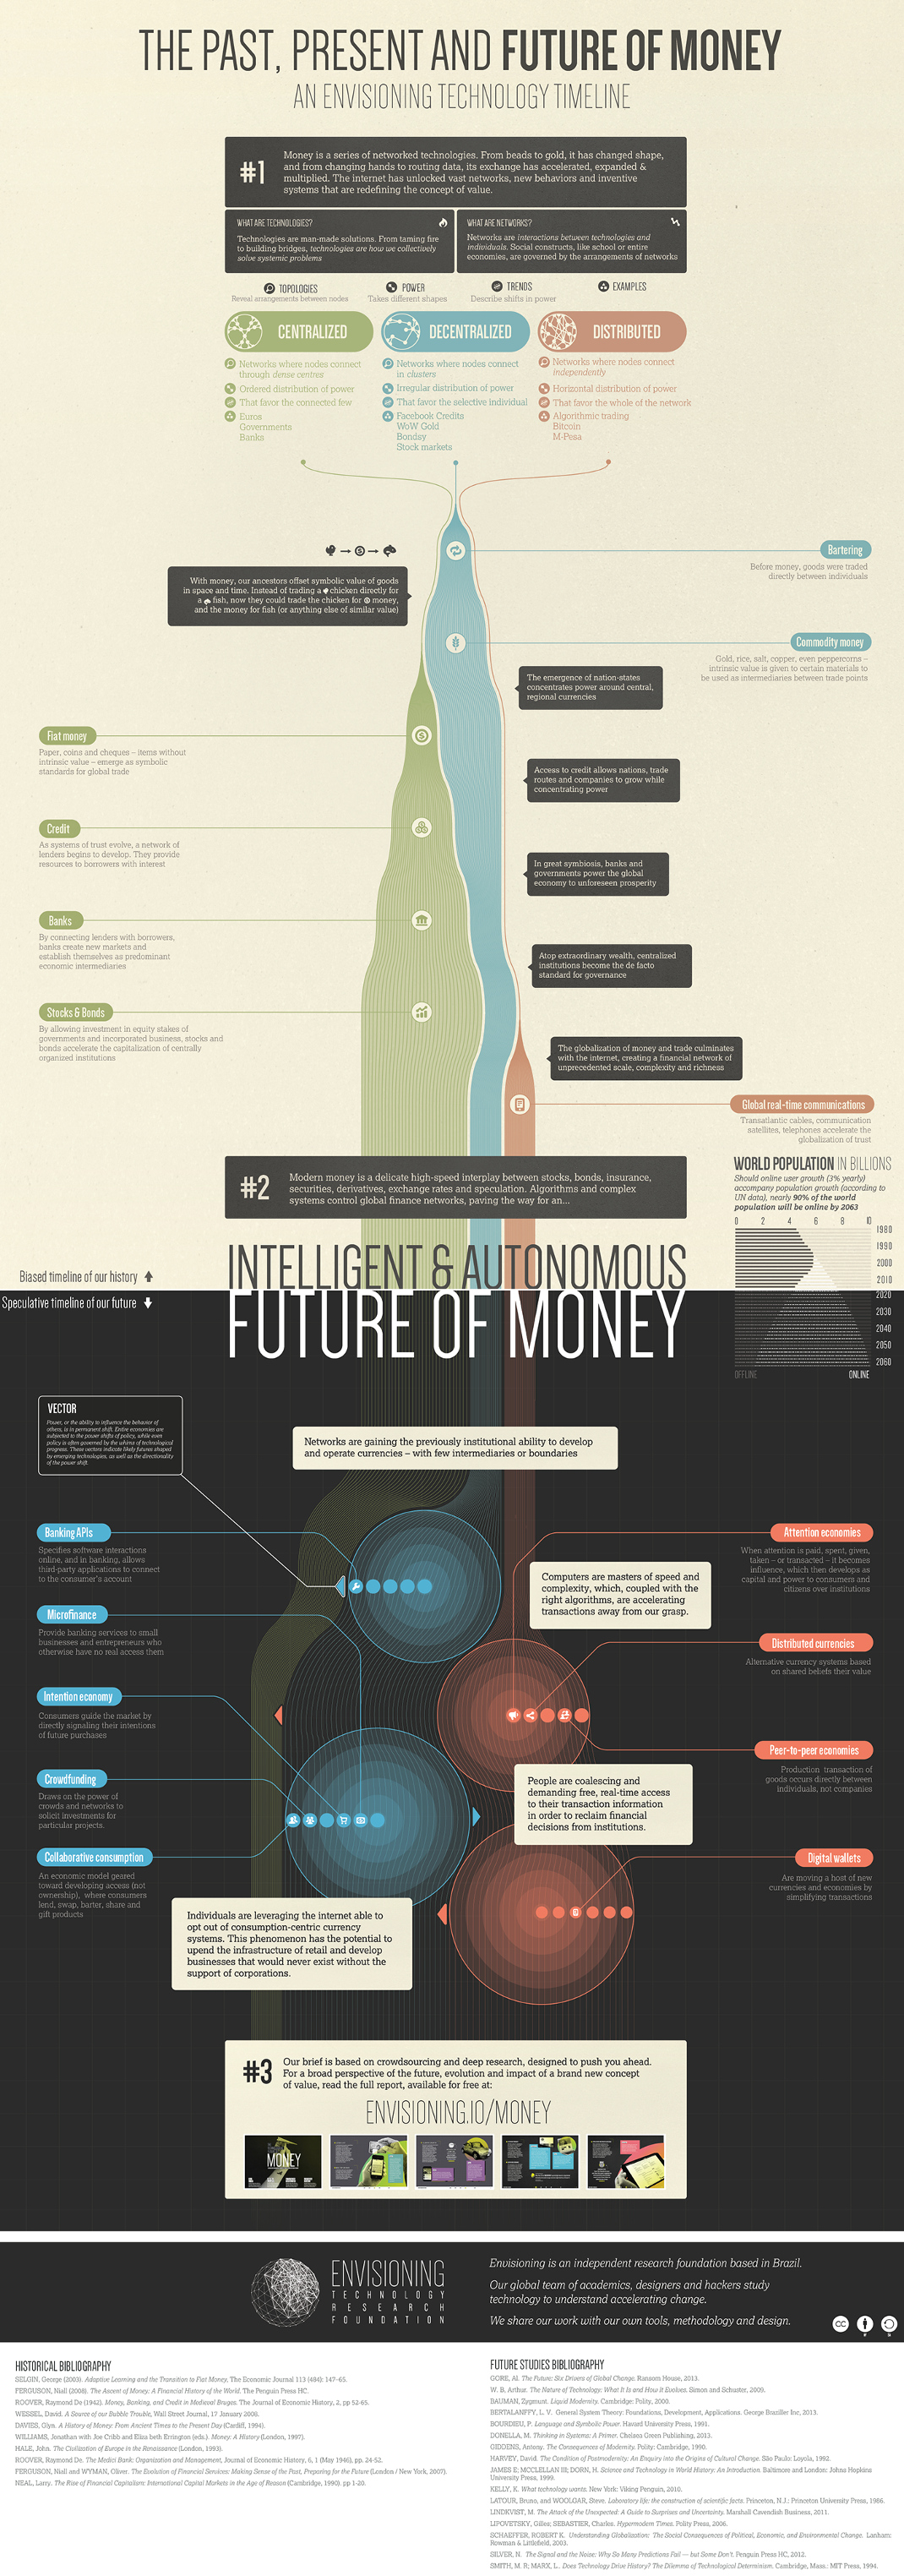
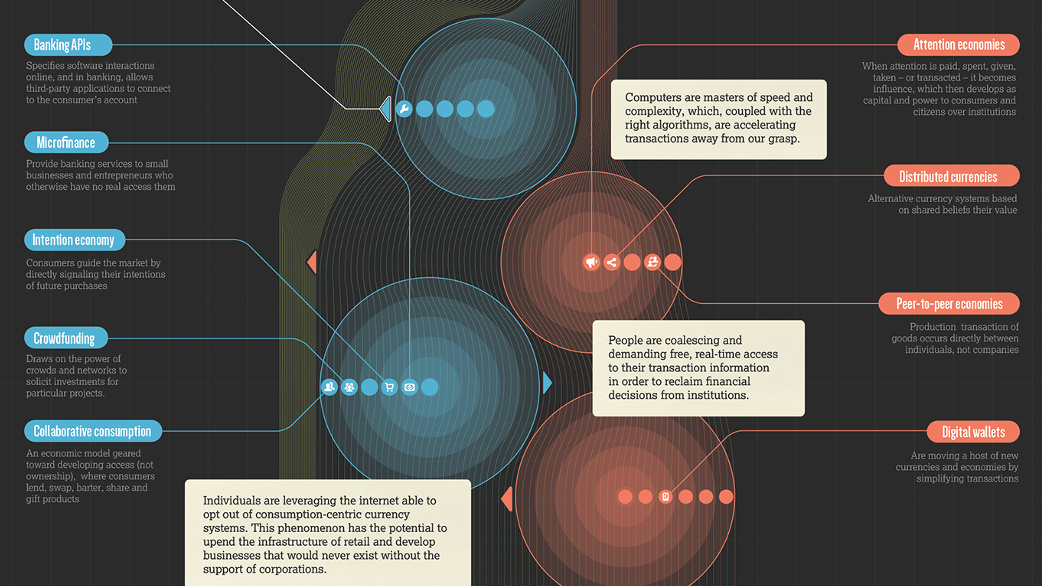
In this visualization, Envisioning.io looks at the historical relationship between currencies and technology. The graphic also looks forward to the future of trade, where new applications of technology may change and expand the ways our financial system works.
Importantly, the visualization also makes the distinction between the different types of networks that encompass currency and trade. Centralized networks are where nodes connect through dense centres that support the connected few, such as governments and banks. Decentralized networks are where nodes connect in clusters under no centralized authority. These networks favour the selective individual and give rise to things such as stock markets. Lastly, there is the distinction of distributed networks, where network nodes connect independently. This is what has enabled bitcoin and cryptocurrencies, where the whole of the network is reinforced and supported.
There are several topics covered here that we have looked at in the past in much more depth. Most recently, we showed the opportunity in mobile and electronic payments, the evolution of US currency, and also how cryptocurrencies could disrupt the financial system. We’ve also covered precious metals in depth with our gold and silver series.
Original graphic by: Envisioning


Technology
Visualizing AI Patents by Country
See which countries have been granted the most AI patents each year, from 2012 to 2022.


Visualizing AI Patents by Country
This was originally posted on our Voronoi app. Download the app for free on iOS or Android and discover incredible data-driven charts from a variety of trusted sources.
This infographic shows the number of AI-related patents granted each year from 2010 to 2022 (latest data available). These figures come from the Center for Security and Emerging Technology (CSET), accessed via Stanford University’s 2024 AI Index Report.
From this data, we can see that China first overtook the U.S. in 2013. Since then, the country has seen enormous growth in the number of AI patents granted each year.
| Year | China | EU and UK | U.S. | RoW | Global Total |
|---|---|---|---|---|---|
| 2010 | 307 | 137 | 984 | 571 | 1,999 |
| 2011 | 516 | 129 | 980 | 581 | 2,206 |
| 2012 | 926 | 112 | 950 | 660 | 2,648 |
| 2013 | 1,035 | 91 | 970 | 627 | 2,723 |
| 2014 | 1,278 | 97 | 1,078 | 667 | 3,120 |
| 2015 | 1,721 | 110 | 1,135 | 539 | 3,505 |
| 2016 | 1,621 | 128 | 1,298 | 714 | 3,761 |
| 2017 | 2,428 | 144 | 1,489 | 1,075 | 5,136 |
| 2018 | 4,741 | 155 | 1,674 | 1,574 | 8,144 |
| 2019 | 9,530 | 322 | 3,211 | 2,720 | 15,783 |
| 2020 | 13,071 | 406 | 5,441 | 4,455 | 23,373 |
| 2021 | 21,907 | 623 | 8,219 | 7,519 | 38,268 |
| 2022 | 35,315 | 1,173 | 12,077 | 13,699 | 62,264 |
In 2022, China was granted more patents than every other country combined.
While this suggests that the country is very active in researching the field of artificial intelligence, it doesn’t necessarily mean that China is the farthest in terms of capability.
Key Facts About AI Patents
According to CSET, AI patents relate to mathematical relationships and algorithms, which are considered abstract ideas under patent law. They can also have different meaning, depending on where they are filed.
In the U.S., AI patenting is concentrated amongst large companies including IBM, Microsoft, and Google. On the other hand, AI patenting in China is more distributed across government organizations, universities, and tech firms (e.g. Tencent).
In terms of focus area, China’s patents are typically related to computer vision, a field of AI that enables computers and systems to interpret visual data and inputs. Meanwhile America’s efforts are more evenly distributed across research fields.
Learn More About AI From Visual Capitalist
If you want to see more data visualizations on artificial intelligence, check out this graphic that shows which job departments will be impacted by AI the most.

-

 Mining1 week ago
Gold vs. S&P 500: Which Has Grown More Over Five Years?
-

 Markets2 weeks ago
Ranked: The Most Valuable Housing Markets in America
-

 Money2 weeks ago
Which States Have the Highest Minimum Wage in America?
-

 AI2 weeks ago
Ranked: Semiconductor Companies by Industry Revenue Share
-

 Markets2 weeks ago
Ranked: The World’s Top Flight Routes, by Revenue
-

 Countries2 weeks ago
Population Projections: The World’s 6 Largest Countries in 2075
-

 Markets2 weeks ago
The Top 10 States by Real GDP Growth in 2023
-

 Demographics2 weeks ago
The Smallest Gender Wage Gaps in OECD Countries