United States
The Top 100 Companies of the World: The U.S. vs Everyone Else


The Top 100 Companies of the World: U.S. vs Everyone
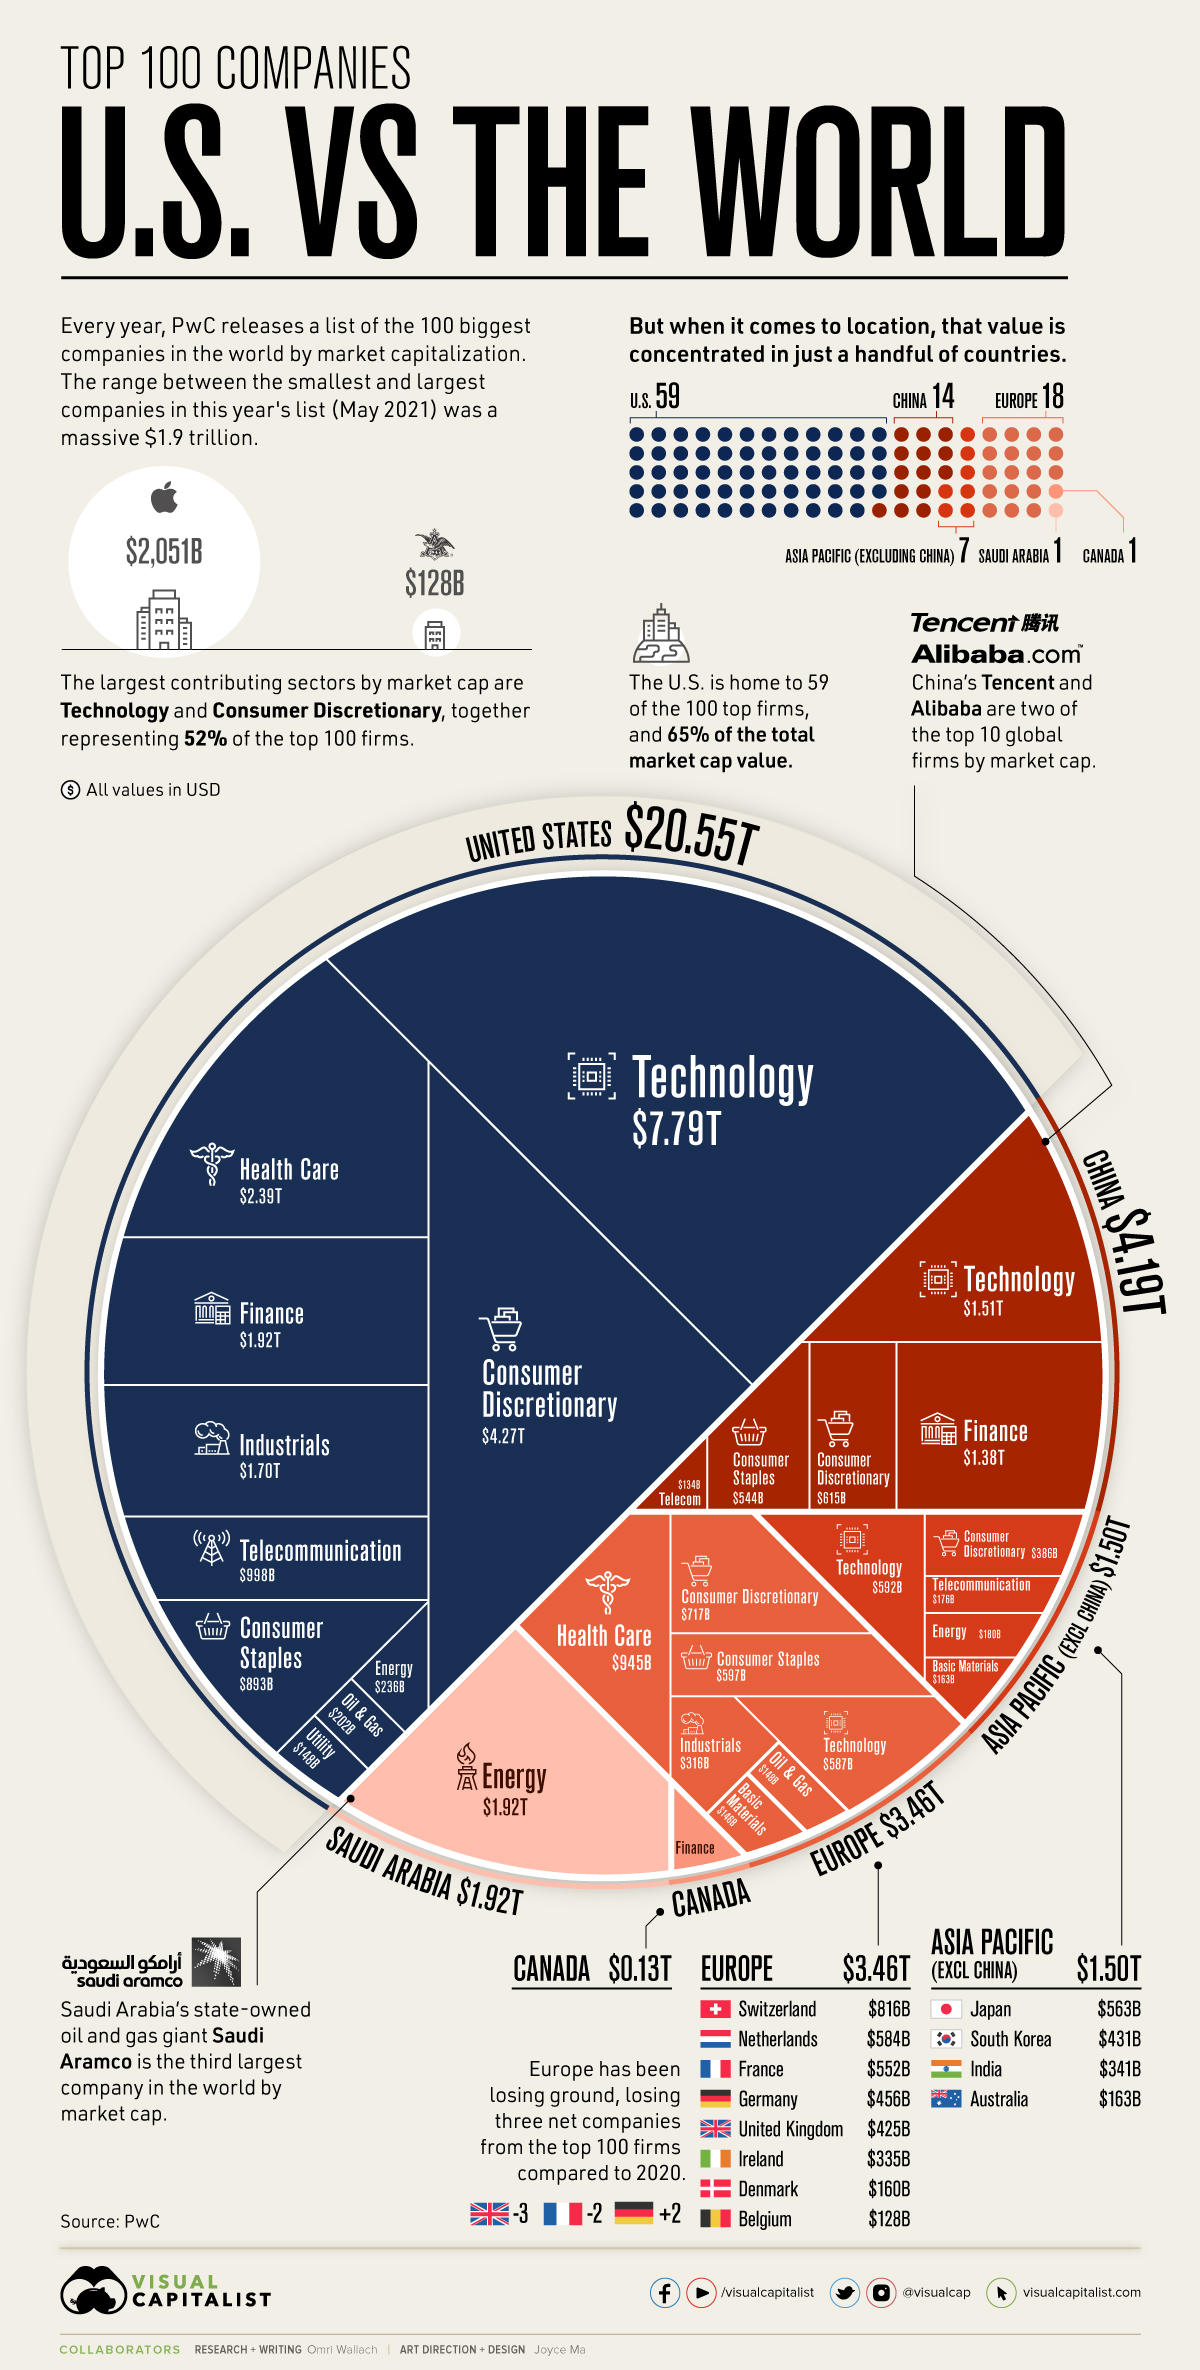
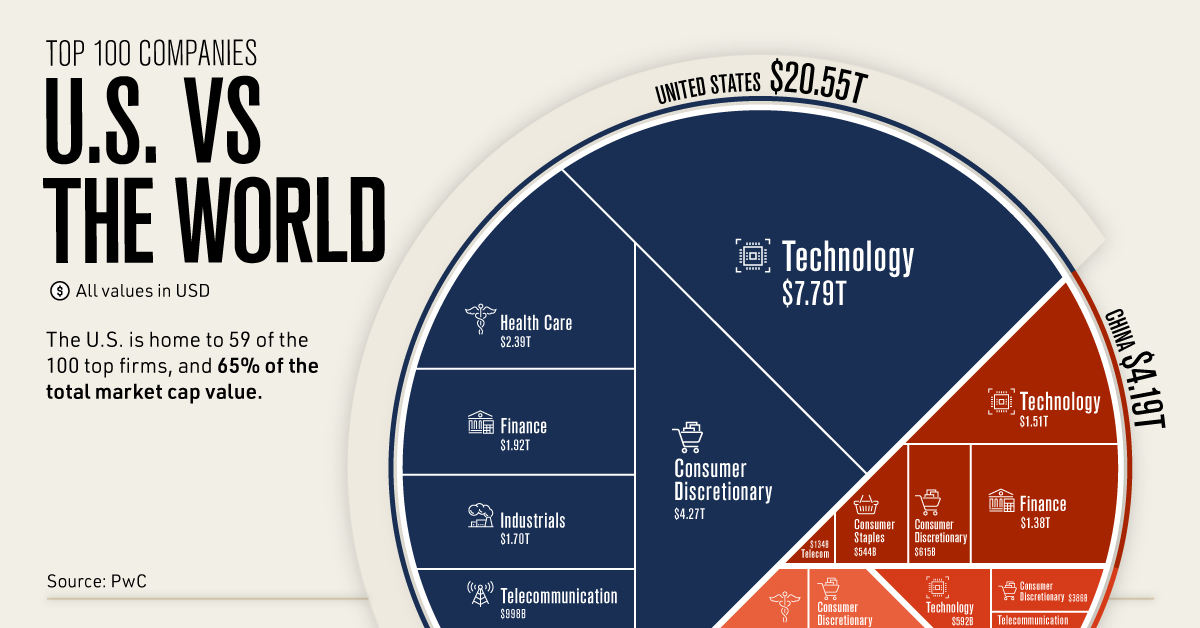
When it comes to breaking down the top 100 companies of the world, the United States still commands the largest slice of the pie.
Throughout the 20th century and before globalization reached its current peaks, American companies made the country an economic powerhouse and the source of a majority of global market value.
But even as countries like China have made headway with multi-billion dollar companies of their own, and the market’s most important sectors have shifted, the U.S. has managed to stay on top.
How do the top 100 companies of the world stack up? This visualization pulls from PwC’s annual ranking of the world’s largest companies, using market capitalization data from May 2021.
Where are the World’s Largest Companies Located?
The world’s top 100 companies account for a massive $31.7 trillion in market cap, but that wealth is not distributed evenly.
Between companies, there’s a wide range of market caps. For example, the difference between the world’s largest company (Apple) and the 100th largest (Anheuser-Busch) is $1.9 trillion.
And between countries, that divide becomes even more stark. Of the 16 countries with companies making the top 100 ranking, the U.S. accounts for 65% of the total market cap value.
| Location | # of Companies | Market Capitalization (May 2021) |
|---|---|---|
| 🇺🇸 United States | 59 | $20.55T |
| 🇨🇳 China | 14 | $4.19T |
| 🇸🇦 Saudi Arabia | 1 | $1.92T |
| 🇨🇭 Switzerland | 3 | $0.82T |
| 🇳🇱 Netherlands | 3 | $0.58T |
| 🇯🇵 Japan | 3 | $0.56T |
| 🇫🇷 France | 2 | $0.55T |
| 🇩🇪 Germany | 3 | $0.46T |
| 🇰🇷 South Korea | 1 | $0.43T |
| 🇬🇧 United Kingdom | 3 | $0.43T |
| 🇮🇳 India | 2 | $0.34T |
| 🇮🇪 Ireland | 2 | $0.34T |
| 🇦🇺 Australia | 1 | $0.16T |
| 🇩🇰 Denmark | 1 | $0.16T |
| 🇨🇦 Canada | 1 | $0.13T |
| 🇧🇪 Belgium | 1 | $0.13T |
Compared to the U.S., other once-prominent markets like Japan, France, and the UK have seen their share of the world’s top 100 companies falter over the years. In fact, all of Europe accounts for just $3.46 trillion or 11% of the total market cap value of the list.
A major reason for the U.S. dominance in market values is a shift in important industries and contributors. Of the world’s top 100 companies, 52% were based in either technology or consumer discretionary, and the current largest players like Apple, Alphabet, Tesla, and Walmart are all American-based.
The Top 100 Companies of the World: Competition From China
The biggest and most impressive competitor to the U.S. is China.
With 14 companies of its own in the world’s top 100, China accounted for $4.19 trillion or 13% of the top 100’s total market cap value. That includes two of the top 10 firms by market cap, Tencent and Alibaba.
| Company | Country | Sector | Market Cap (May 2021) | |
|---|---|---|---|---|
| #1 | Apple | United States | Technology | $2,051B |
| #2 | Saudi Aramco | Saudi Arabia | Energy | $1,920B |
| #3 | Microsoft | United States | Technology | $1,778B |
| #4 | Amazon | United States | Consumer Discretionary | $1,558B |
| #5 | Alphabet | United States | Technology | $1,393B |
| #6 | United States | Technology | $839B | |
| #7 | Tencent | China | Technology | $753B |
| #8 | Tesla | United States | Consumer Discretionary | $641B |
| #9 | Alibaba | China | Consumer Discretionary | $615B |
| #10 | Berkshire Hathway | United States | Financials | $588B |
| #11 | TSMC | China | Technology | $534B |
| #12 | Visa | United States | Industrials | $468B |
| #13 | JPMorgan Chase | United States | Financials | $465B |
| #14 | Johnson & Johnson | United States | Health Care | $433B |
| #15 | Samsung Electronics | South Korea | Technology | $431B |
| #16 | Kweichow Moutai | China | Consumer Staples | $385B |
| #17 | Walmart | United States | Consumer Discretionary | $383B |
| #18 | Mastercard | United States | Industrials | $354B |
| #19 | UnitedHealth Group | United States | Health Care | $352B |
| #20 | LVMH Moët Hennessy | France | Consumer Discretionary | $337B |
| #21 | Walt Disney Co | United States | Consumer Discretionary | $335B |
| #22 | Bank of America | United States | Financials | $334B |
| #23 | Procter & Gamble | United States | Consumer Staples | $333B |
| #24 | Nvidia | United States | Technology | $331B |
| #25 | Home Depot | United States | Consumer Discretionary | $329B |
| #26 | Nestle SA | Switzerland | Consumer Staples | $322B |
| #27 | ICBC | China | Financials | $290B |
| #28 | Paypal Holdings | United States | Industrials | $284B |
| #29 | Roche Holdings | Switzerland | Health Care | $283B |
| #30 | Intel | United States | Technology | $261B |
| #31 | ASML Holding NV | Netherlands | Technology | $255B |
| #32 | Toyota Motor | Japan | Consumer Discretionary | $254B |
| #33 | Comcast | United States | Telecommunication | $248B |
| #34 | Verizon Communications | United States | Telecommunication | $241B |
| #35 | Exxon Mobil | United States | Energy | $236B |
| #36 | Netflix | United States | Consumer Discretionary | $231B |
| #37 | Adobe | United States | Technology | $228B |
| #38 | Coca-Cola Co | United States | Consumer Staples | $227B |
| #39 | Meituan | China | Technology | $226B |
| #40 | Ping An | China | Financials | $219B |
| #41 | Cisco Systems | United States | Telecommunication | $218B |
| #42 | AT&T | United States | Financials | $216B |
| #43 | L'Oréal | France | Consumer Discretionary | $215B |
| #44 | China Construction Bank | China | Financials | $213B |
| #45 | Abbott Labs | United States | Health Care | $212B |
| #46 | Novartis AG | Switzerland | Health Care | $212B |
| #47 | Nike | United States | Consumer Discretionary | $209B |
| #48 | Oracle | United States | Technology | $202B |
| #49 | Pfizer | United States | Health Care | $202B |
| #50 | Chevron | United States | Oil & Gas | $202B |
| #51 | China Merchants Bank | China | Financials | $196B |
| #52 | PepsiCo | United States | Consumer Staples | $195B |
| #53 | Salesforce.com | United States | Technology | $195B |
| #54 | Merck & Co | United States | Health Care | $195B |
| #55 | AbbVie | United States | Health Care | $191B |
| #56 | Broadcom | United States | Technology | $189B |
| #57 | Prosus NV | Netherlands | Technology | $181B |
| #58 | Reliance Industries | India | Energy | $180B |
| #59 | Thermo Fisher Scientific | United States | Health Care | $180B |
| #60 | Eli Lilly & Co | United States | Health Care | $179B |
| #61 | Agricultural Bank of China | China | Financials | $178B |
| #62 | Softbank Group | Japan | Telecommunication | $176B |
| #63 | Accenture | Ireland | Industrials | $176B |
| #64 | Texas Instruments | United States | Technology | $174B |
| #65 | McDonalds | United States | Consumer Discretionary | $167B |
| #66 | Volkswagen AG | Germany | Consumer Discretionary | $165B |
| #67 | BHP Group | Australia | Basic Materials | $163B |
| #68 | Wells Fargo & Co | United States | Financials | $162B |
| #69 | Tata Consultancy Services | India | Technology | $161B |
| #70 | Danaher | United States | Health Care | $160B |
| #71 | Novo Nordisk | Denmark | Health Care | $160B |
| #72 | Medtronic | Ireland | Health Care | $159B |
| #73 | Wuliangye Yibin | China | Consumer Staples | $159B |
| #74 | Costco Wholesale | United States | Consumer Discretionary | $156B |
| #75 | T-Mobile US | United States | Telecommunication | $156B |
| #76 | Citigroup | United States | Financials | $152B |
| #77 | Honeywell | United States | Industrials | $151B |
| #78 | Qualcomm | United States | Technology | $151B |
| #79 | SAP SE | Germany | Technology | $151B |
| #80 | Boeing | United States | Industrials | $149B |
| #81 | Royal Dutch Shell | Netherlands | Oil & Gas | $148B |
| #82 | NextEra Energy | United States | Utilities | $148B |
| #83 | United Parcel Service | United States | Industrials | $148B |
| #84 | Union PAC | United States | Industrials | $148B |
| #85 | Unilever | United Kingdom | Consumer Staples | $147B |
| #86 | AIA | China | Financials | $147B |
| #87 | Linde | United Kingdom | Basic Materials | $146B |
| #88 | Amgen | United States | Health Care | $144B |
| #89 | Bristol Myers Squibb | United States | Health Care | $141B |
| #90 | Siemens AG | Germany | Industrials | $140B |
| #91 | Bank of China | China | Financials | $139B |
| #92 | Philip Morris | United States | Consumer Staples | $138B |
| #93 | Lowe's Companies | United States | Consumer Discretionary | $136B |
| #94 | Charter Communications | United States | Telecommunication | $135B |
| #95 | China Mobile | China | Telecommunication | $134B |
| #96 | Sony Group | Japan | Consumer Discretionary | $132B |
| #97 | Astrazeneca | United Kingdom | Health Care | $131B |
| #98 | Royal Bank of Canada | Canada | Financials | $131B |
| #99 | Starbucks | United States | Consumer Discretionary | $129B |
| #100 | Anheuser-Busch | Belgium | Consumer Staples | $128B |
Impressively, China’s rise in market value isn’t limited to well-known tech and consumer companies. The country’s second biggest contributing industry to the top 100 firms was finance, once also the most valuable sector in the U.S. (currently 4th behind tech, consumer discretionary, and health care).
Other notable countries on the list include Saudi Arabia and its state-owned oil and gas giant Saudi Aramco, which is the third largest company in the world. Despite only having one company in the top 100, Saudi Arabia had the third-largest share of the top 100’s total market cap value.
As Europe continues to lose ground year-over-year and the rest of Asia struggles to keep up, the top 100 companies might become increasingly concentrated in just the U.S. and China. The question is, will the imbalance of global market value start to even out, or become even bigger?


United States
Ranked: The Largest U.S. Corporations by Number of Employees
We visualized the top U.S. companies by employees, revealing the massive scale of retailers like Walmart, Target, and Home Depot.


The Largest U.S. Corporations by Number of Employees
This was originally posted on our Voronoi app. Download the app for free on Apple or Android and discover incredible data-driven charts from a variety of trusted sources.
Revenue and profit are common measures for measuring the size of a business, but what about employee headcount?
To see how big companies have become from a human perspective, we’ve visualized the top U.S. companies by employees. These figures come from companiesmarketcap.com, and were accessed in March 2024. Note that this ranking includes publicly-traded companies only.
Data and Highlights
The data we used to create this list of largest U.S. corporations by number of employees can be found in the table below.
| Company | Sector | Number of Employees |
|---|---|---|
| Walmart | Consumer Staples | 2,100,000 |
| Amazon | Consumer Discretionary | 1,500,000 |
| UPS | Industrials | 500,000 |
| Home Depot | Consumer Discretionary | 470,000 |
| Concentrix | Information Technology | 440,000 |
| Target | Consumer Staples | 440,000 |
| Kroger | Consumer Staples | 430,000 |
| UnitedHealth | Health Care | 400,000 |
| Berkshire Hathaway | Financials | 383,000 |
| Starbucks | Consumer Discretionary | 381,000 |
| Marriott International | Consumer Discretionary | 377,000 |
| Cognizant | Information Technology | 346,600 |
Retail and Logistics Top the List
Companies like Walmart, Target, and Kroger have a massive headcount due to having many locations spread across the country, which require everything from cashiers to IT professionals.
Moving goods around the world is also highly labor intensive, explaining why UPS has half a million employees globally.
Below the Radar?
Two companies that rank among the largest U.S. corporations by employees which may be less familiar to the public include Concentrix and Cognizant. Both of these companies are B2B brands, meaning they primarily work with other companies rather than consumers. This contrasts with brands like Amazon or Home Depot, which are much more visible among average consumers.
A Note on Berkshire Hathaway
Warren Buffett’s company doesn’t directly employ 383,000 people. This headcount actually includes the employees of the firm’s many subsidiaries, such as GEICO (insurance), Dairy Queen (retail), and Duracell (batteries).
If you’re curious to see how Buffett’s empire has grown over the years, check out this animated graphic that visualizes the growth of Berkshire Hathaway’s portfolio from 1994 to 2022.

-

 Mining1 week ago
Gold vs. S&P 500: Which Has Grown More Over Five Years?
-

 Markets2 weeks ago
Ranked: The Most Valuable Housing Markets in America
-

 Money2 weeks ago
Which States Have the Highest Minimum Wage in America?
-

 AI2 weeks ago
Ranked: Semiconductor Companies by Industry Revenue Share
-

 Markets2 weeks ago
Ranked: The World’s Top Flight Routes, by Revenue
-

 Countries2 weeks ago
Population Projections: The World’s 6 Largest Countries in 2075
-

 Markets2 weeks ago
The Top 10 States by Real GDP Growth in 2023
-

 Demographics2 weeks ago
The Smallest Gender Wage Gaps in OECD Countries