Stocks
The 50 Most Valuable Companies in the World in 2023
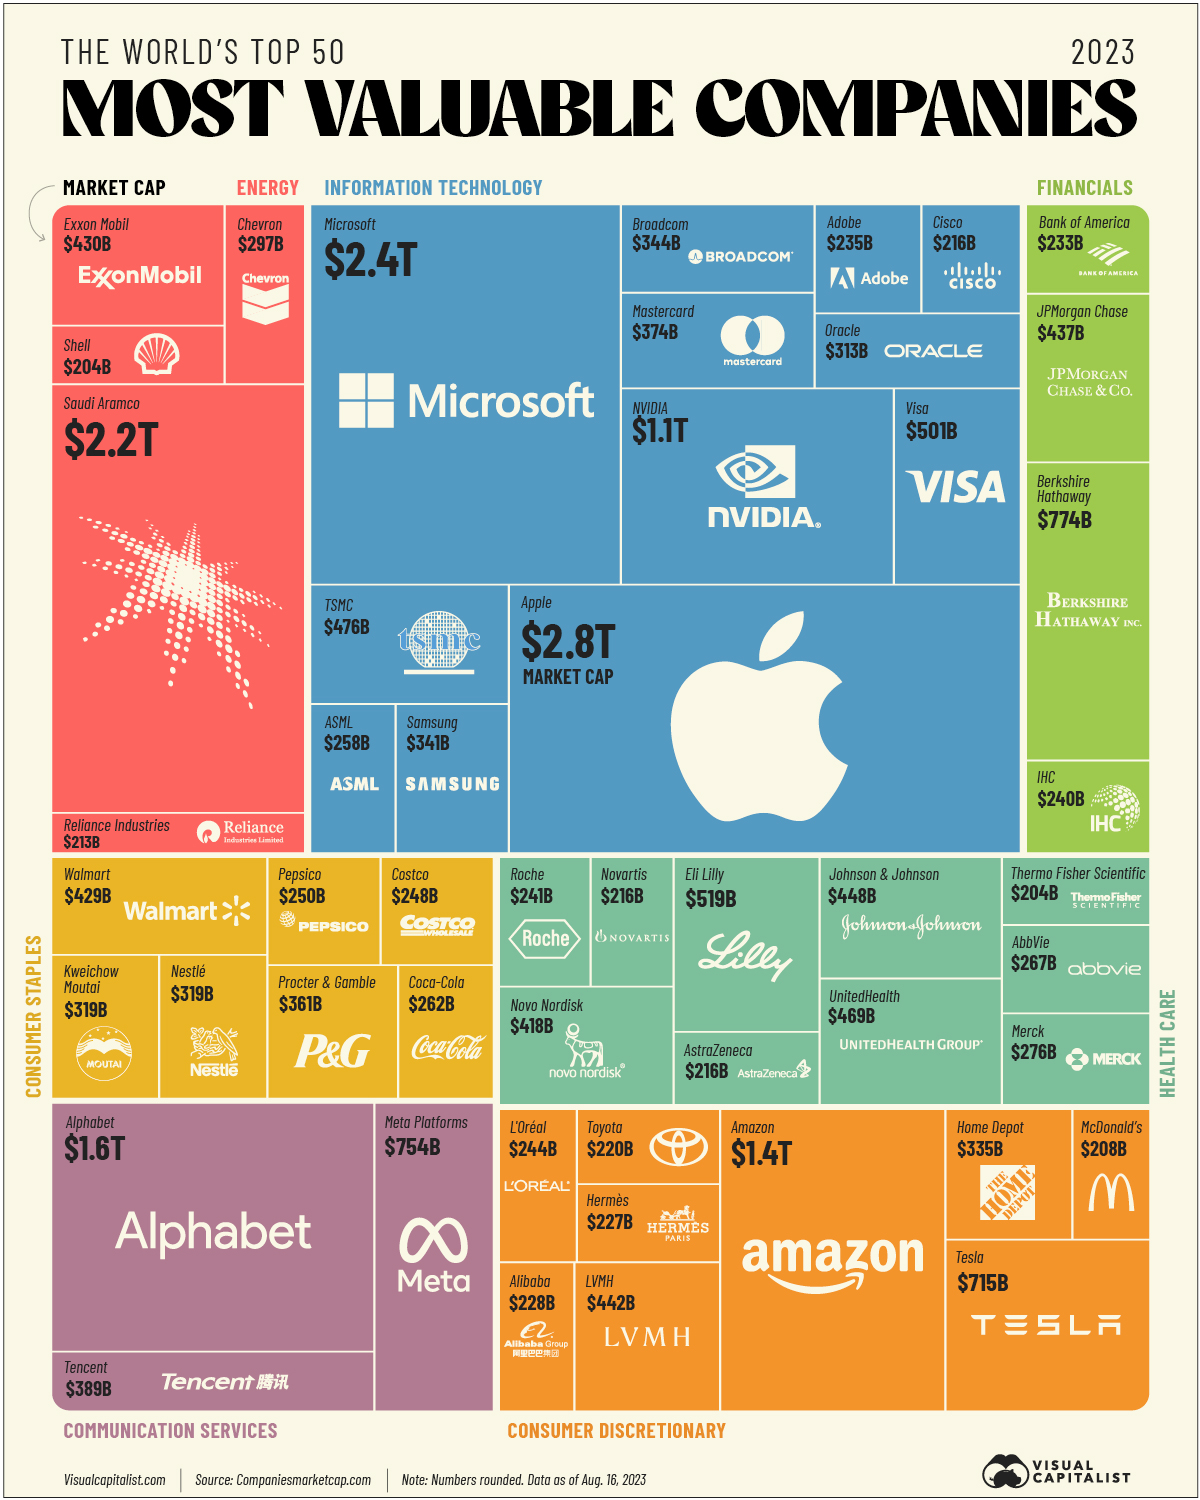


The 50 Most Valuable Companies in the World
Market capitalization, or market cap, is one measure of a company’s value as determined by the stock market. It is easily calculated by multiplying the company’s outstanding shares by its current share price.
In this graphic, we present a treemap chart that visualizes the world’s top 50 publicly-traded companies by market cap, using data as of Aug. 16, 2023.
Editor’s note: While market capitalization is a simple way to compare publicly-traded companies, it does have some limitations. Most importantly, it does not include debt or cash in the calculation.
Data and Highlights
All of the data we used to create this graphic is included in the table below.
| Company | Sector | Country | Market Cap (USD billions) |
|---|---|---|---|
| Apple | Information Technology | 🇺🇸 US | $2,777 |
| Microsoft | Information Technology | 🇺🇸 US | $2,382 |
| Saudi Aramco | Energy | 🇸🇦 Saudi Arabia | $2,222 |
| Alphabet | Communication Services | 🇺🇸 US | $1,636 |
| Amazon | Consumer Discretionary | 🇺🇸 US | $1,385 |
| NVIDIA | Information Technology | 🇺🇸 US | $1,074 |
| Berkshire Hathaway | Financials | 🇺🇸 US | $774 |
| Meta Platforms | Communication Services | 🇺🇸 US | $754 |
| Tesla | Consumer Discretionary | 🇺🇸 US | $715 |
| Eli Lilly | Health Care | 🇺🇸 US | $519 |
| Visa | Information Technology | 🇺🇸 US | $501 |
| TSMC | Information Technology | 🇹🇼 Taiwan | $476 |
| UnitedHealth | Health Care | 🇺🇸 US | $469 |
| Johnson & Johnson | Health Care | 🇺🇸 US | $448 |
| LVMH | Consumer Discretionary | 🇫🇷 France | $442 |
| JPMorgan Chase | Financials | 🇺🇸 US | $436 |
| Exxon Mobil | Energy | 🇺🇸 US | $430 |
| Walmart | Consumer Staples | 🇺🇸 US | $429 |
| Novo Nordisk | Health Care | 🇩🇰 Denmark | $418 |
| Tencent | Communication Services | 🇨🇳 China | $389 |
| Mastercard | Information Technology | 🇺🇸 US | $374 |
| Procter & Gamble | Consumer Staples | 🇺🇸 US | $361 |
| Broadcom | Information Technology | 🇺🇸 US | $344 |
| Samsung | Information Technology | 🇰🇷 South Korea | $341 |
| Home Depot | Consumer Discretionary | 🇺🇸 US | $335 |
| Kweichow Moutai | Consumer Staples | 🇨🇳 China | $319 |
| Nestlé | Consumer Staples | 🇨🇭 Switzerland | $319 |
| Oracle | Information Technology | 🇺🇸 US | $313 |
| Chevron | Energy | 🇺🇸 US | $297 |
| Merck | Health Care | 🇺🇸 US | $276 |
| AbbVie | Health Care | 🇺🇸 US | $267 |
| Coca-Cola | Consumer Staples | 🇺🇸 US | $262 |
| ASML | Information Technology | 🇳🇱 Netherlands | $258 |
| Pepsico | Consumer Staples | 🇺🇸 US | $249 |
| Costco | Consumer Staples | 🇺🇸 US | $248 |
| L'Oréal | Consumer Discretionary | 🇫🇷 France | $244 |
| Roche | Health Care | 🇨🇭 Switzerland | $241 |
| International Holding Company | Financials | 🇦🇪 UAE | $240 |
| Adobe | Information Technology | 🇺🇸 US | $235 |
| Bank of America | Financials | 🇺🇸 US | $233 |
| Alibaba | Consumer Discretionary | 🇨🇳 China | $228 |
| Hermès | Consumer Discretionary | 🇫🇷 France | $227 |
| Toyota | Consumer Discretionary | 🇯🇵 Japan | $220 |
| Novartis | Health Care | 🇨🇭 Switzerland | $216 |
| AstraZeneca | Health Care | 🇬🇧 UK | $216 |
| Cisco | Information Technology | 🇺🇸 US | $216 |
| Reliance Industries | Energy | 🇮🇳 India | $213 |
| McDonald | Consumer Discretionary | 🇺🇸 US | $208 |
| Thermo Fisher Scientific | Health Care | 🇺🇸 US | $204 |
| Shell | Energy | 🇬🇧 UK | $204 |
From this data, we can see that there are only a handful of trillion dollar companies in the world, including Apple, Microsoft, Saudi Aramco, Amazon, Alphabet, and Nvidia.
Two former members of the trillion dollar club are Meta and Tesla, but both companies currently hover around the $700 billion range in terms of market capitalization. In 2022, Meta lost significant value as its earnings fell, while Tesla suffered from demand concerns.
Altogether, the 50 most valuable companies represent over $26.5 trillion in shareholder value. At a sector level, Information Technology is the most represented in the top 50, with $9.3 trillion in combined market cap. The next biggest sectors are Consumer Discretionary ($4.0 trillion) and Health Care ($3.3 trillion).
Geographical Breakdown
At a geographical level, the majority of the 50 most valuable companies are American. The following chart shows each country’s tally.
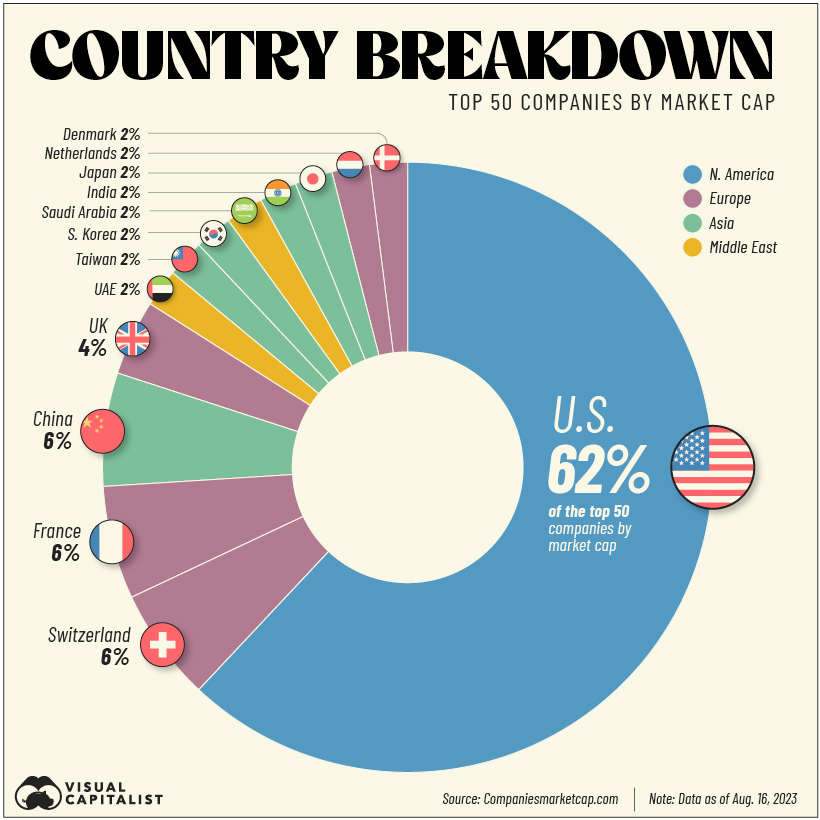
After the U.S., the three most represented countries are Switzerland, France, and China, with three companies apiece.
From Switzerland are companies such as Nestlé, Roche, and Novartis. The latter two are major players in the healthcare industry.
France’s companies in the top 50 list all belong to the Consumer Discretionary sector, and include fashion giants LVMH and Hermès, as well as L’Oréal, a global leader in cosmetics. Earlier this year, LVMH CEO Bernard Arnault was officially the richest person in the world with a fortune of $215 billion.
Finally, from the Chinese side are two globally-recognized names in Tencent and Alibaba. China’s third company on this list is Kweichow Moutai, a partially state-owned producer of alcoholic beverages.


Markets
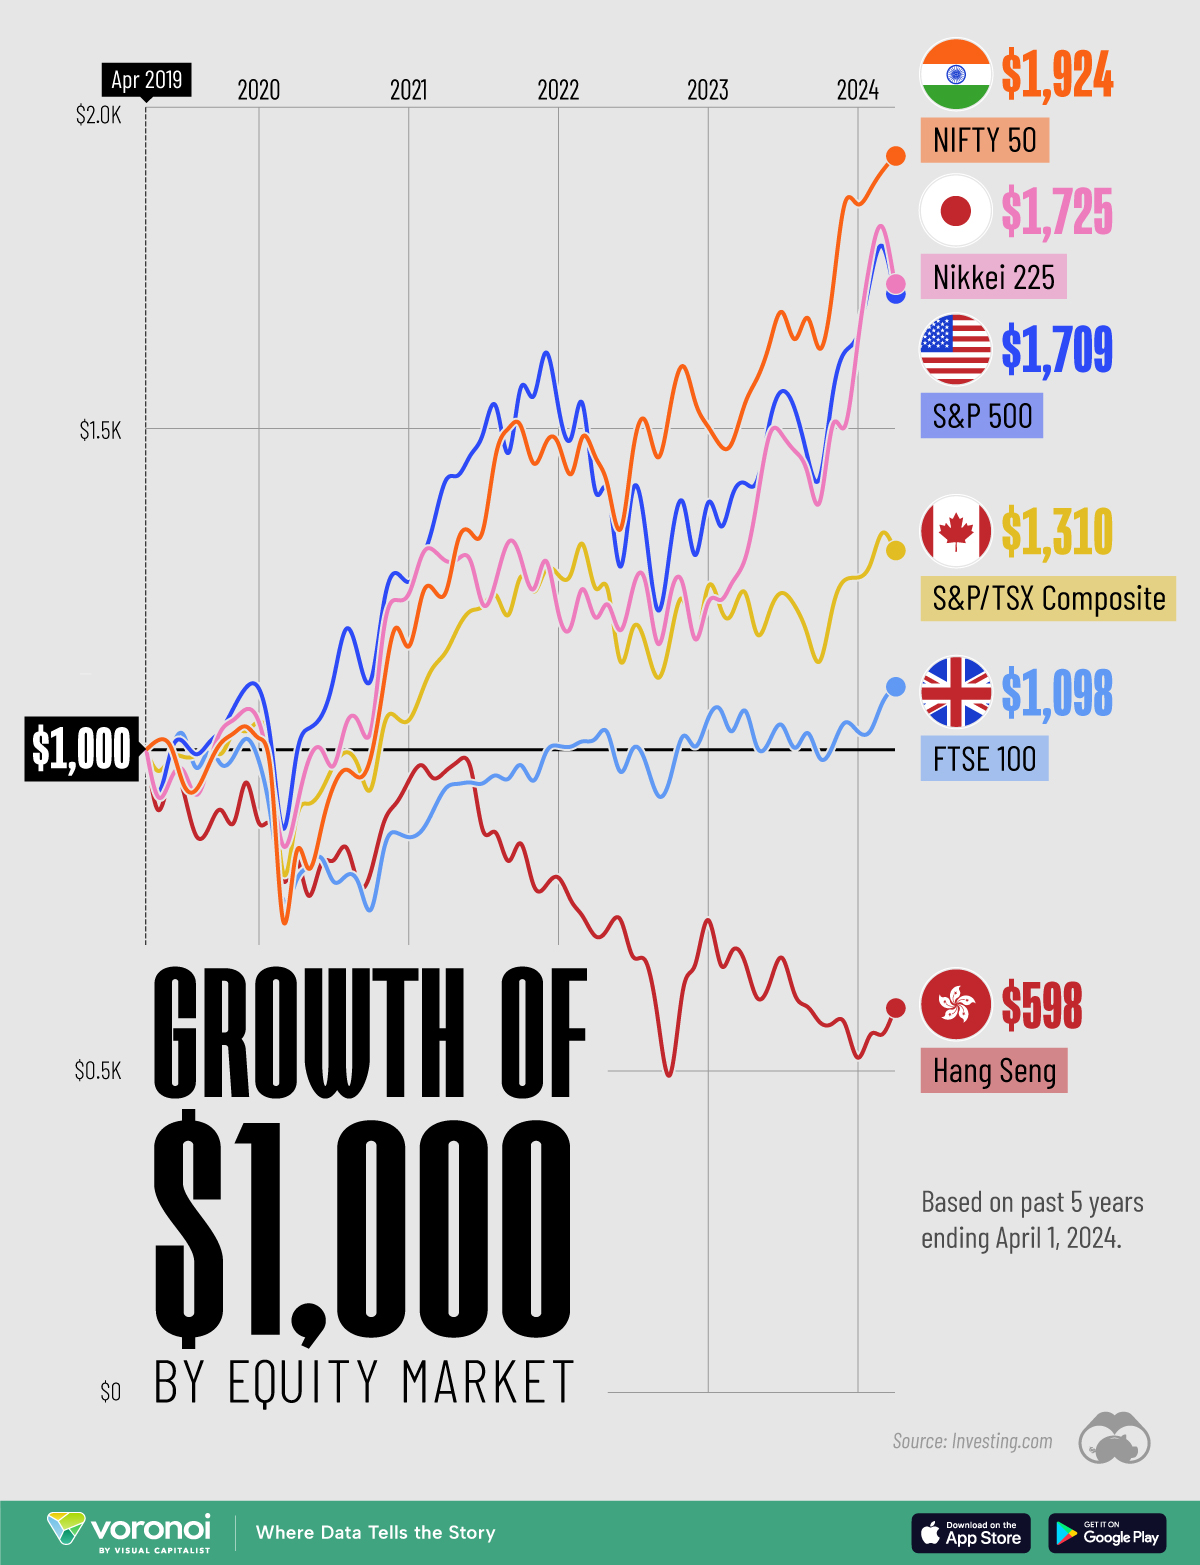
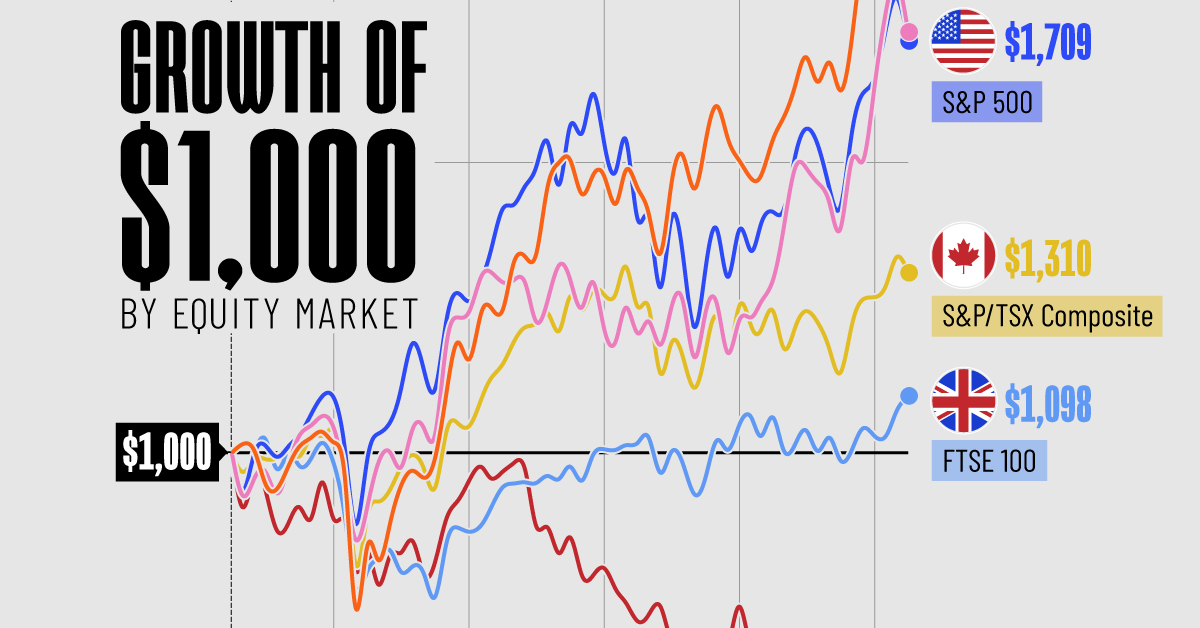
The Growth of a $1,000 Equity Investment, by Stock Market
In this graphic, we’ve visualized stock market growth by country over the past five years using major indices.
Visualizing Stock Market Growth by Country
This was originally posted on our Voronoi app. Download the app for free on iOS or Android and discover incredible data-driven charts from a variety of trusted sources.
In this graphic, we show the change in value of a $1,000 investment in various leading equity indexes from around the world. This data was sourced from Investing.com, and covers a five-year period from April 2019 to April 2024.
See the following table for the five-year annual return figures of the indexes shown above.
| Index | 5-Yr Return as of April 1, 2024 |
|---|---|
| 🇮🇳 NIFTY 50 | 92.4% |
| 🇯🇵 Nikkei 225 | 72.5% |
| 🇺🇸 S&P 500 | 70.9% |
| 🇨🇦 S&P/TSX Composite | 31.0% |
| 🇬🇧 FTSE 100 | 9.8% |
| 🇭🇰 Hang Seng | -40.2% |
In terms of stock market growth by country, India (represented here by the NIFTY 50) has impressively surpassed both the U.S. and Japan.
What is the NIFTY 50?
The NIFTY 50 is an index of the 50 largest and most actively traded Indian stocks. Similar to the S&P 500, it represents a range of industries and acts as a benchmark for investors to gauge the performance of the country’s broader stock market.
What’s Going on in India?
India’s multi-year bull market has led to several records being shattered in 2023. For example, the country’s total stock market market capitalization surpassed $4 trillion for the first time, while India-focused ETFs pulled in net inflows of $8.6 billion over the year.
A primary driver of this growth is the country’s fast-rising middle class. According to a report by Morgan Stanley, this “once-in-a-generation shift” will result in India having the third largest stock market globally by 2030, presumably behind the U.S. and China.
Japan Also Breaks Records
Japanese equities (represented in this graphic by the Nikkei 225) slightly outperformed the S&P 500 over the past five years. The index, which represents the top 225 companies on the Tokyo Stock Exchange, recently set a new record high for the first time since 1989.
Japanese companies have reported strong earnings as of late, partly thanks to a weak yen, which benefits many of the country’s export-reliant companies.
Learn More About Global Markets From Visual Capitalist
If you enjoyed this graphic, be sure to check out The World’s Biggest Stock Markets, by Country, which provides a unique perspective on country-level market capitalizations.

-

 Energy5 days ago
Who’s Building the Most Solar Energy?
-

 Wealth2 weeks ago
Charted: Which Country Has the Most Billionaires in 2024?
-

 Business2 weeks ago
The Top Private Equity Firms by Country
-

 Markets2 weeks ago
The Best U.S. Companies to Work for According to LinkedIn
-

 Economy2 weeks ago
Ranked: The Top 20 Countries in Debt to China
-

 Politics1 week ago
Charted: Trust in Government Institutions by G7 Countries
-

 Energy1 week ago
Mapped: The Age of Energy Projects in Interconnection Queues, by State
-

 Mining1 week ago
Visualizing Global Gold Production in 2023