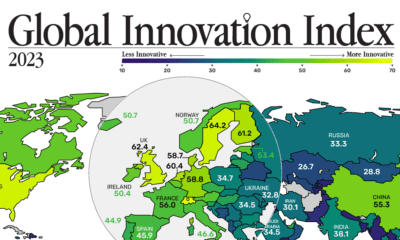

In this graphic, we show the most innovative countries in the world, and the factors underlying their innovative strength.
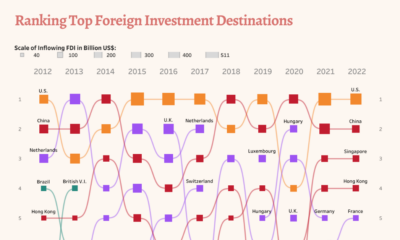

Take a look at changes in foreign direct investment flows over a decade, analyzing the top destinations and biggest investors.
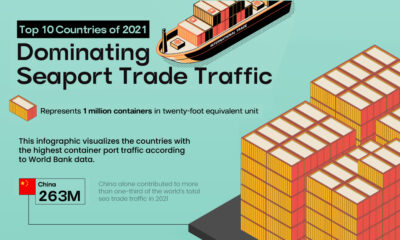

This infographic highlights the countries with the highest container traffic across their ports, thus dominating seaport trade in 2021.
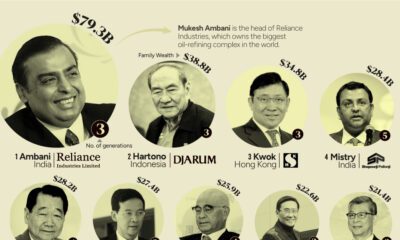

This graphic shows the 15 richest families in Asia. From energy to banking, these dynasties have built fortunes across many sectors.
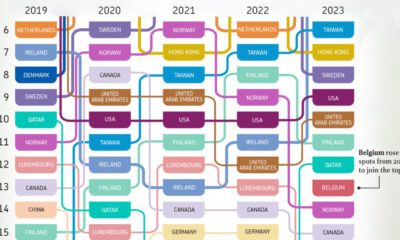

What are the most competitive countries when it comes to business? This visual highlights the top 20 economies over the last five years.
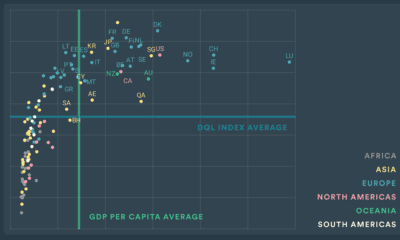

Which countries have the best internet quality, or electronic security? This index breaks down the digital quality of life of countries in 2022.
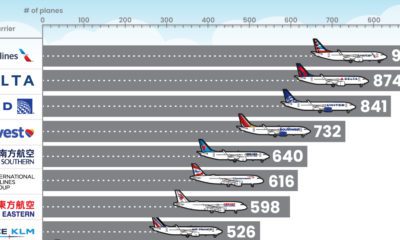

What type of aircraft do the world’s largest airlines use? This infographic breaks down the airline fleets of major carriers
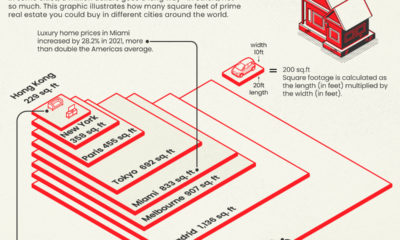

Is $1 million enough to buy you a luxury home? As this infographic shows, the answer varies greatly from city to city.
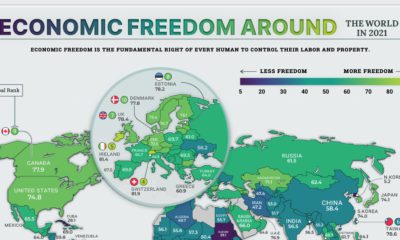

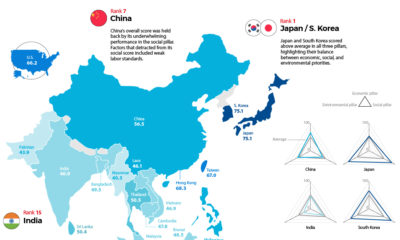
The global average economic freedom score is at the highest its been in 27 years. Here we map the economic freedom score of nearly every country.

The Sustainable Trade Index ranks 19 Asian economies and the U.S. across three categories of trade sustainability.


 Creator Program