Technology
Ranking Countries By Digital Quality of Life in 2022
Article/Editing:
This content may not be loading as Surfshark is blocked in some regions. Please scroll down for the 2022 rankings table.
Ranking Countries By Digital Quality of Life in 2022
Life and work in the 21st century is increasingly reliant on modern technology, with a country’s digital quality of life playing a massive role on people’s day-to-day.
Some countries excel in internet access and affordability, while others have more modern digital systems and relevant laws. And many regions of the world suffer with lacking digital infrastructure and access across the board.
The 2022 Digital Quality of Life Index (DQL) from Surfshark analyzes countries on digital wellbeing, based on data from the UN, World Bank, Freedom House, and the International Communications Union.
5 Metrics for Measuring Digital Wellbeing
The DQL Index covers 117 countries with readily available data, making up 92% of the global population. Each country is scored on five pillars:
- Internet Affordability—How much time people have to work to afford a stable internet connection.
- Internet Quality—How fast and stable the internet connectivity in a country is and how well it’s improving.
- Electronic Infrastructure—How well developed and inclusive a country’s existing electronic infrastructure is.
- Electronic Security—How safe and protected people feel in a country.
- Electronic Government—How advanced and digitized a country’s government services are.
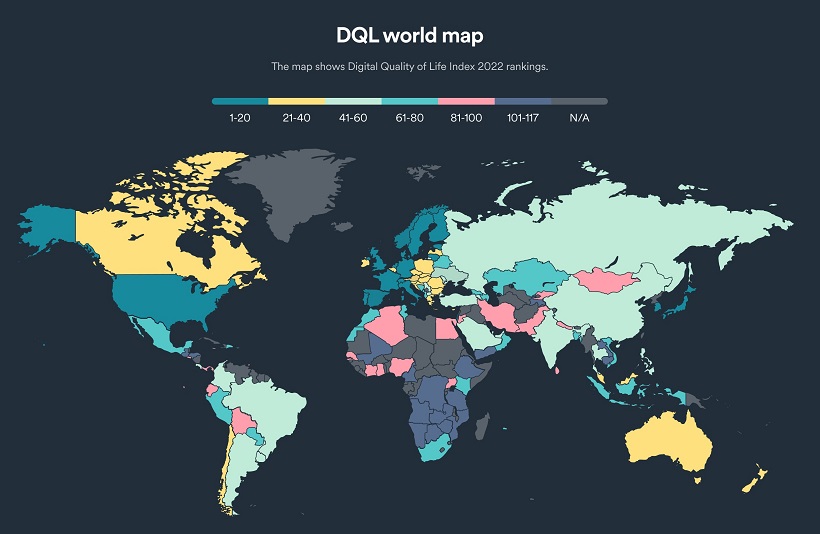
Visualizing The World’s Digital Quality of Life
Overall, Europe and Asia led the digital quality of life rankings in 2022. Israel took the top spot with an incredibly strong score in internet affordability. Here are the countries sorted by rankings and their weighted scores in each category:
| Rank | Country | Affordability | Quality | E-infrastructure | E-security | E-government |
|---|---|---|---|---|---|---|
| 1 | Israel | 0.1917 | 0.0981 | 0.1668 | 0.1503 | 0.1541 |
| 2 | Denmark | 0.047 | 0.1186 | 0.1968 | 0.1878 | 0.1844 |
| 3 | Germany | 0.0718 | 0.0926 | 0.1922 | 0.1946 | 0.1612 |
| 4 | France | 0.0534 | 0.111 | 0.1834 | 0.1878 | 0.1749 |
| 5 | Sweden | 0.0213 | 0.1059 | 0.1958 | 0.1878 | 0.1787 |
| 6 | Netherlands | 0.0241 | 0.0985 | 0.1956 | 0.1865 | 0.1796 |
| 7 | Finland | 0.0171 | 0.0973 | 0.192 | 0.1892 | 0.1869 |
| 8 | Japan | 0.0684 | 0.1024 | 0.1846 | 0.1462 | 0.177 |
| 9 | U.K. | 0.0413 | 0.0898 | 0.1882 | 0.1611 | 0.188 |
| 10 | South Korea | 0.0252 | 0.1139 | 0.1884 | 0.1516 | 0.1868 |
| 11 | Lithuania | 0.0508 | 0.087 | 0.1705 | 0.1973 | 0.1592 |
| 12 | U.S. | 0.0326 | 0.113 | 0.1944 | 0.1224 | 0.1947 |
| 13 | Switzerland | 0.0337 | 0.1114 | 0.1914 | 0.1597 | 0.1607 |
| 14 | Estonia | 0.0219 | 0.0759 | 0.1852 | 0.1946 | 0.1779 |
| 15 | Singapore | 0.0717 | 0.1134 | 0.1852 | 0.0943 | 0.19 |
| 16 | Spain | 0.0257 | 0.0924 | 0.1777 | 0.1919 | 0.1656 |
| 17 | Norway | 0.0136 | 0.0923 | 0.194 | 0.1649 | 0.174 |
| 18 | Luxembourg | 0.0272 | 0.0911 | 0.1878 | 0.1689 | 0.1597 |
| 19 | Italy | 0.0362 | 0.082 | 0.1733 | 0.1824 | 0.159 |
| 20 | Portugal | 0.0085 | 0.1101 | 0.1576 | 0.1932 | 0.1565 |
| 21 | Belgium | 0.0162 | 0.0868 | 0.1823 | 0.1973 | 0.1409 |
| 22 | Austria | 0.0279 | 0.0717 | 0.1782 | 0.1716 | 0.1719 |
| 23 | Poland | 0.0242 | 0.0869 | 0.1566 | 0.1905 | 0.1568 |
| 24 | Ireland | 0.0217 | 0.0874 | 0.1799 | 0.1662 | 0.1596 |
| 25 | Czechia | 0.023 | 0.0755 | 0.1707 | 0.196 | 0.1472 |
| 26 | Canada | 0.0228 | 0.0967 | 0.1831 | 0.1289 | 0.1723 |
| 27 | Hungary | 0.0206 | 0.1046 | 0.1647 | 0.1676 | 0.1425 |
| 28 | New Zealand | 0.0166 | 0.1027 | 0.1731 | 0.1341 | 0.1702 |
| 29 | Slovakia | 0.0233 | 0.0807 | 0.161 | 0.1865 | 0.1417 |
| 30 | Bulgaria | 0.0308 | 0.1025 | 0.1352 | 0.177 | 0.1452 |
| 31 | Croatia | 0.0133 | 0.0911 | 0.1625 | 0.1865 | 0.1346 |
| 32 | Slovenia | 0.0102 | 0.0934 | 0.1619 | 0.1622 | 0.1591 |
| 33 | Latvia | 0.0235 | 0.0918 | 0.1628 | 0.1784 | 0.1289 |
| 34 | Romania | 0.0299 | 0.105 | 0.1427 | 0.1743 | 0.1327 |
| 35 | Australia | 0.0453 | 0.0706 | 0.1755 | 0.1089 | 0.1802 |
| 36 | Malta | 0.0104 | 0.093 | 0.1639 | 0.1527 | 0.1547 |
| 37 | Cyprus | 0.0139 | 0.0718 | 0.1589 | 0.1689 | 0.1548 |
| 38 | Malaysia | 0.0319 | 0.0838 | 0.1636 | 0.1224 | 0.1561 |
| 39 | Greece | 0.0085 | 0.0713 | 0.142 | 0.2 | 0.1344 |
| 40 | Chile | 0.0251 | 0.1202 | 0.1469 | 0.1022 | 0.1538 |
| 41 | Uruguay | 0.0051 | 0.1054 | 0.1569 | 0.13 | 0.1498 |
| 42 | Russia | 0.0556 | 0.0794 | 0.1512 | 0.0943 | 0.152 |
| 43 | China | 0.0241 | 0.1045 | 0.1485 | 0.0741 | 0.175 |
| 44 | U.A.E. | 0.0071 | 0.1148 | 0.1779 | 0.0419 | 0.1712 |
| 45 | Argentina | 0.0073 | 0.0694 | 0.1575 | 0.13 | 0.1464 |
| 46 | Qatar | 0.0077 | 0.1077 | 0.1705 | 0.0808 | 0.1421 |
| 47 | Armenia | 0.1009 | 0.07 | 0.1356 | 0.0765 | 0.1221 |
| 48 | Serbia | 0.0184 | 0.0739 | 0.1387 | 0.1238 | 0.1429 |
| 49 | Thailand | 0.0081 | 0.1045 | 0.151 | 0.0876 | 0.1391 |
| 50 | Ukraine | 0.0259 | 0.0581 | 0.1613 | 0.1184 | 0.1256 |
| 51 | Saudi Arabia | 0.0057 | 0.0873 | 0.1635 | 0.0865 | 0.1408 |
| 52 | Turkey | 0.0153 | 0.0679 | 0.1526 | 0.0968 | 0.1488 |
| 53 | Brazil | 0.0078 | 0.0884 | 0.1388 | 0.0686 | 0.1558 |
| 54 | Moldova | 0.0357 | 0.0687 | 0.1359 | 0.0927 | 0.1226 |
| 55 | Philippines | 0.0044 | 0.0779 | 0.1371 | 0.1062 | 0.1265 |
| 56 | Bahrain | 0.0084 | 0.0878 | 0.166 | 0.047 | 0.1396 |
| 57 | Colombia | 0.0051 | 0.0775 | 0.1248 | 0.0954 | 0.1433 |
| 58 | Costa Rica | 0.0042 | 0.0721 | 0.1523 | 0.0954 | 0.1206 |
| 59 | India | 0.0266 | 0.071 | 0.1149 | 0.0822 | 0.1489 |
| 60 | N. Macedonia | 0.0095 | 0.0684 | 0.1409 | 0.0981 | 0.1237 |
| 61 | Kazakhstan | 0.0185 | 0.0639 | 0.1408 | 0.07 | 0.1473 |
| 62 | Mexico | 0.0111 | 0.0688 | 0.1291 | 0.0792 | 0.142 |
| 63 | Paraguay | 0.0091 | 0.0724 | 0.1424 | 0.0862 | 0.113 |
| 64 | Albania | 0.0087 | 0.0567 | 0.1313 | 0.09 | 0.1328 |
| 65 | Oman | 0.0053 | 0.065 | 0.1455 | 0.0473 | 0.1502 |
| 66 | South Africa | 0.0198 | 0.0689 | 0.1171 | 0.0778 | 0.1294 |
| 67 | Georgia | 0.0097 | 0.0577 | 0.1408 | 0.0941 | 0.1103 |
| 68 | Mauritius | 0.0149 | 0.0459 | 0.1311 | 0.09 | 0.1298 |
| 69 | Belarus | 0.0224 | 0.068 | 0.1396 | 0.0554 | 0.123 |
| 70 | Vietnam | 0.0145 | 0.0712 | 0.1396 | 0.0578 | 0.1241 |
| 71 | Morocco | 0.0068 | 0.0603 | 0.1247 | 0.113 | 0.1004 |
| 72 | Indonesia | 0.0064 | 0.0639 | 0.1382 | 0.0605 | 0.1342 |
| 73 | Peru | 0.0037 | 0.069 | 0.126 | 0.0819 | 0.1213 |
| 74 | Azerbaijan | 0.0093 | 0.0618 | 0.1361 | 0.0592 | 0.1253 |
| 75 | Montenegro | 0.0149 | 0.0566 | 0.1339 | 0.0765 | 0.1064 |
| 76 | Bangladesh | 0.024 | 0.0681 | 0.1204 | 0.0703 | 0.1021 |
| 77 | Tunisia | 0.011 | 0.0484 | 0.1225 | 0.0886 | 0.1142 |
| 78 | Kenya | 0.0047 | 0.0492 | 0.1391 | 0.0714 | 0.1193 |
| 79 | Dominican Republic | 0.0047 | 0.0597 | 0.1163 | 0.0754 | 0.1229 |
| 80 | Bosnia and Herzegovina | 0.0127 | 0.0634 | 0.1353 | 0.0697 | 0.0974 |
| 81 | Panama | 0.0032 | 0.0851 | 0.1279 | 0.05 | 0.1111 |
| 82 | Ecuador | 0.0045 | 0.0656 | 0.132 | 0.0365 | 0.1256 |
| 83 | Trinidad and Tobago | 0.0094 | 0.0622 | 0.1277 | 0.0551 | 0.1074 |
| 84 | Iran | 0.0149 | 0.0585 | 0.1482 | 0.0149 | 0.1113 |
| 85 | Egypt | 0.0064 | 0.0583 | 0.1098 | 0.0595 | 0.1135 |
| 86 | Nigeria | 0.0014 | 0.0552 | 0.1187 | 0.0768 | 0.0916 |
| 87 | Jordan | 0.0048 | 0.0754 | 0.1434 | 0.0297 | 0.0862 |
| 88 | Ghana | 0.0025 | 0.0531 | 0.0957 | 0.0724 | 0.1091 |
| 89 | Sri Lanka | 0.0071 | 0.0658 | 0.0943 | 0.0446 | 0.1184 |
| 90 | Mongolia | 0.015 | 0.059 | 0.135 | 0.0189 | 0.0951 |
| 91 | Kyrgyzstan | 0.0105 | 0.0603 | 0.0986 | 0.0457 | 0.1074 |
| 92 | Algeria | 0.005 | 0.0601 | 0.1312 | 0.0551 | 0.0707 |
| 93 | Bolivia | 0.0051 | 0.0583 | 0.1287 | 0.0324 | 0.0941 |
| 94 | Nepal | 0.0069 | 0.0684 | 0.1132 | 0.0497 | 0.0762 |
| 95 | Senegal | 0.0036 | 0.055 | 0.1048 | 0.0603 | 0.0906 |
| 96 | Pakistan | 0.006 | 0.0616 | 0.0938 | 0.0446 | 0.1015 |
| 97 | Jamaica | 0.0047 | 0.0584 | 0.113 | 0.0432 | 0.0859 |
| 98 | Uganda | 0.0007 | 0.0489 | 0.0777 | 0.0768 | 0.0943 |
| 99 | El Salvador | 0.0028 | 0.0662 | 0.1066 | 0.0257 | 0.0944 |
| 100 | Ivory Coast | 0.0006 | 0.0465 | 0.0881 | 0.0724 | 0.0869 |
| 101 | Cambodia | 0.0043 | 0.0631 | 0.1178 | 0.0162 | 0.0831 |
| 102 | Mali | 0.0011 | 0.0548 | 0.0969 | 0.0603 | 0.0689 |
| 103 | Namibia | 0.0046 | 0.0517 | 0.0955 | 0.0322 | 0.0899 |
| 104 | Guatemala | 0.0029 | 0.059 | 0.0877 | 0.0257 | 0.0878 |
| 105 | Zambia | 0.0034 | 0.0241 | 0.0935 | 0.0781 | 0.0613 |
| 106 | Botswana | 0.0051 | 0.0523 | 0.0977 | 0.023 | 0.0777 |
| 107 | Tanzania | 0.0021 | 0.0517 | 0.0813 | 0.0257 | 0.0924 |
| 108 | Honduras | 0.004 | 0.0675 | 0.0838 | 0.0108 | 0.0861 |
| 109 | Zimbabwe | 0.0019 | 0.034 | 0.0907 | 0.0362 | 0.0854 |
| 110 | Angola | 0.0047 | 0.0567 | 0.0576 | 0.0495 | 0.0748 |
| 111 | Laos | 0.0066 | 0.0489 | 0.0955 | 0.0189 | 0.059 |
| 112 | Tajikistan | 0.0108 | 0.0485 | 0.073 | 0.0108 | 0.0754 |
| 113 | Cameroon | 0.0014 | 0.0178 | 0.073 | 0.0338 | 0.0832 |
| 114 | Mozambique | 0.0021 | 0.0378 | 0.0526 | 0.0295 | 0.0815 |
| 115 | Ethiopia | 0.0032 | 0.0472 | 0.048 | 0.0338 | 0.0682 |
| 116 | Yemen | 0.007 | 0.0644 | 0.0479 | 0.0081 | 0.0527 |
| 117 | Congo DR | 0.0063 | 0.0596 | 0.0446 | 0.0027 | 0.0394 |
Overall, 15 of the top 20 highest-scoring countries were located in Europe, including #2 Denmark and #3 Germany, reflecting the region’s strong scores in electronic infrastructure and security.
In addition to Israel, the Asia region was represented at the top by #8 Japan, #10 South Korea, and #15 Singapore. The only non-Asian and non-European country to make the top 20 was the United States at #12.
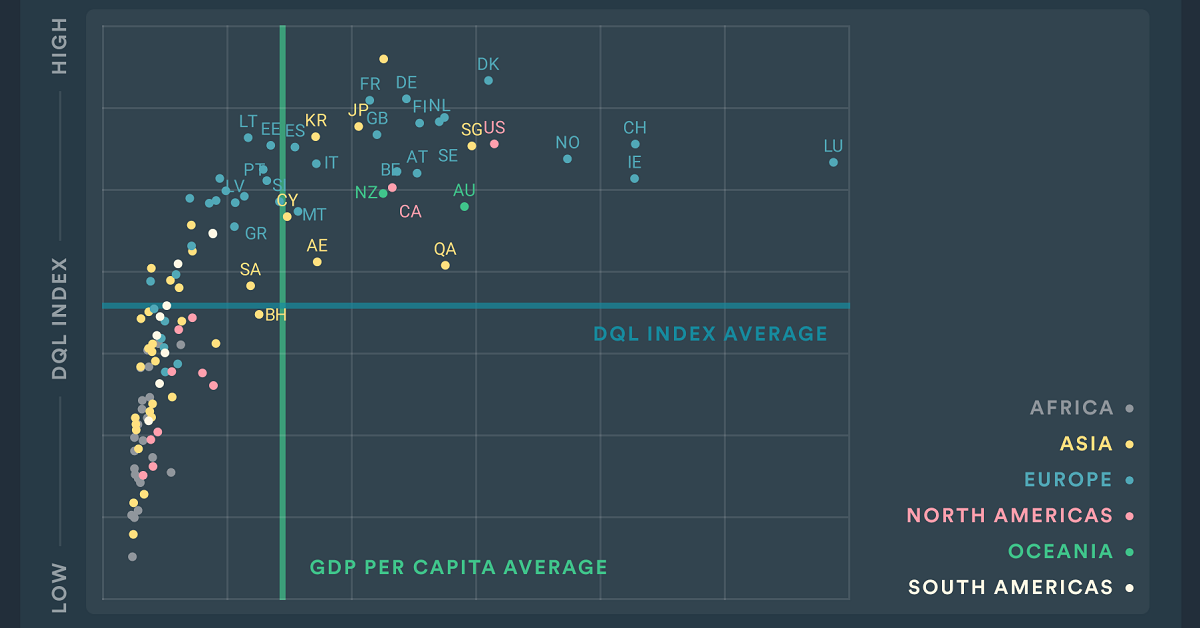
GDP’s Impact on Digital Infrastructure
Of the 117 countries that had data available for the index, the majority of the lowest-ranking countries were in Africa or Asia. This includes the bottom five: Cameroon, Mozambique, Ethiopia, Yemen, and DR Congo.
In fact, when the DQL Index was charted against GDP per capita, a clear and unsurprising trend emerges:
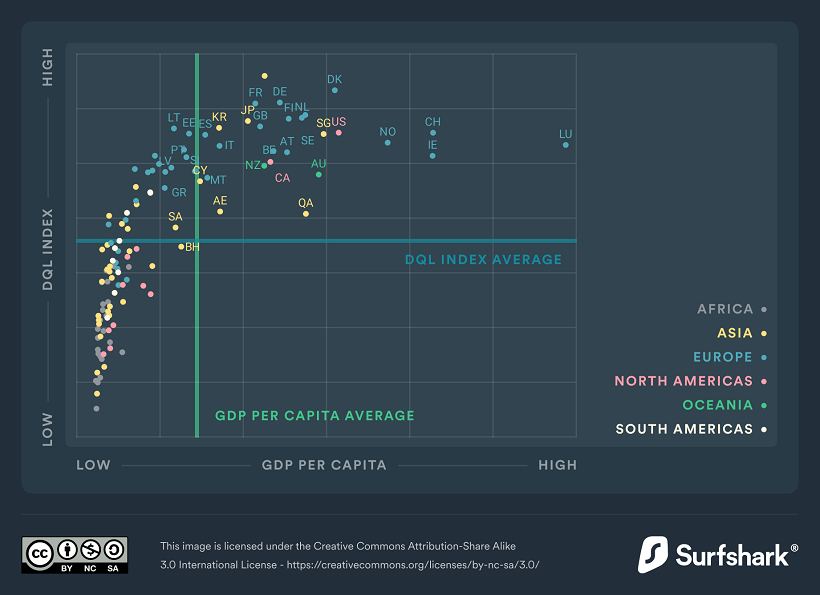
As countries have to grapple with limited resources and capital for increasing their digital wellbeing, we can see different priorities emerge. For example. many countries scored poorly on internet affordability and electronic government while prioritizing investments in internet quality and electronic infrastructure.
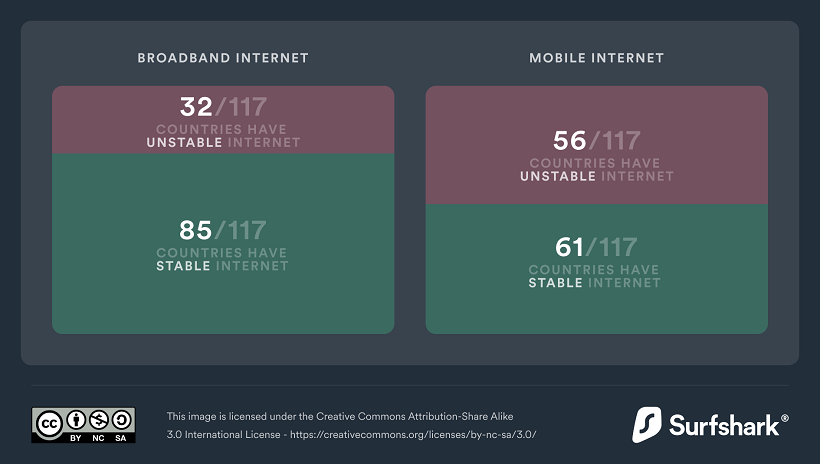
And despite the proliferation of mobile phones across the world, more countries were able to set up stable broadband internet over mobile internet.
To find out more interesting insights, dive in to the full Digital Quality of Life Index.

This article was published as a part of Visual Capitalist's Creator Program, which features data-driven visuals from some of our favorite Creators around the world.


Technology
Visualizing AI Patents by Country
See which countries have been granted the most AI patents each year, from 2012 to 2022.


Visualizing AI Patents by Country
This was originally posted on our Voronoi app. Download the app for free on iOS or Android and discover incredible data-driven charts from a variety of trusted sources.
This infographic shows the number of AI-related patents granted each year from 2010 to 2022 (latest data available). These figures come from the Center for Security and Emerging Technology (CSET), accessed via Stanford University’s 2024 AI Index Report.
From this data, we can see that China first overtook the U.S. in 2013. Since then, the country has seen enormous growth in the number of AI patents granted each year.
| Year | China | EU and UK | U.S. | RoW | Global Total |
|---|---|---|---|---|---|
| 2010 | 307 | 137 | 984 | 571 | 1,999 |
| 2011 | 516 | 129 | 980 | 581 | 2,206 |
| 2012 | 926 | 112 | 950 | 660 | 2,648 |
| 2013 | 1,035 | 91 | 970 | 627 | 2,723 |
| 2014 | 1,278 | 97 | 1,078 | 667 | 3,120 |
| 2015 | 1,721 | 110 | 1,135 | 539 | 3,505 |
| 2016 | 1,621 | 128 | 1,298 | 714 | 3,761 |
| 2017 | 2,428 | 144 | 1,489 | 1,075 | 5,136 |
| 2018 | 4,741 | 155 | 1,674 | 1,574 | 8,144 |
| 2019 | 9,530 | 322 | 3,211 | 2,720 | 15,783 |
| 2020 | 13,071 | 406 | 5,441 | 4,455 | 23,373 |
| 2021 | 21,907 | 623 | 8,219 | 7,519 | 38,268 |
| 2022 | 35,315 | 1,173 | 12,077 | 13,699 | 62,264 |
In 2022, China was granted more patents than every other country combined.
While this suggests that the country is very active in researching the field of artificial intelligence, it doesn’t necessarily mean that China is the farthest in terms of capability.
Key Facts About AI Patents
According to CSET, AI patents relate to mathematical relationships and algorithms, which are considered abstract ideas under patent law. They can also have different meaning, depending on where they are filed.
In the U.S., AI patenting is concentrated amongst large companies including IBM, Microsoft, and Google. On the other hand, AI patenting in China is more distributed across government organizations, universities, and tech firms (e.g. Tencent).
In terms of focus area, China’s patents are typically related to computer vision, a field of AI that enables computers and systems to interpret visual data and inputs. Meanwhile America’s efforts are more evenly distributed across research fields.
Learn More About AI From Visual Capitalist
If you want to see more data visualizations on artificial intelligence, check out this graphic that shows which job departments will be impacted by AI the most.

-

 Mining1 week ago
Gold vs. S&P 500: Which Has Grown More Over Five Years?
-

 Markets2 weeks ago
Ranked: The Most Valuable Housing Markets in America
-

 Money2 weeks ago
Which States Have the Highest Minimum Wage in America?
-

 AI2 weeks ago
Ranked: Semiconductor Companies by Industry Revenue Share
-

 Markets2 weeks ago
Ranked: The World’s Top Flight Routes, by Revenue
-

 Countries2 weeks ago
Population Projections: The World’s 6 Largest Countries in 2075
-

 Markets2 weeks ago
The Top 10 States by Real GDP Growth in 2023
-

 Demographics2 weeks ago
The Smallest Gender Wage Gaps in OECD Countries