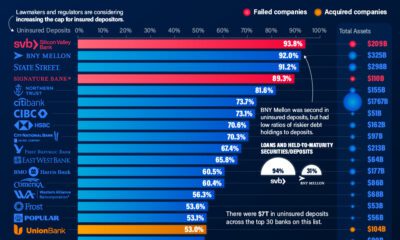

Uninsured deposits in the U.S. total at least $7 trillion. We show the top 30 banks with the highest level of these deposits.


Where do the happiest people on earth live? This map is a snapshot of the world's most (and least) happy countries in 2023.
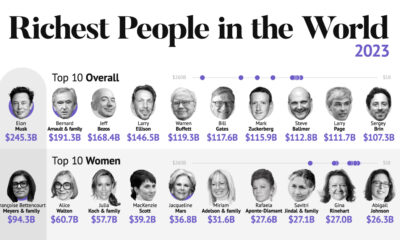

The world's five richest people are worth a combined $871 billion. From luxury moguls to Asia's rising titans, we show the richest in 2023.
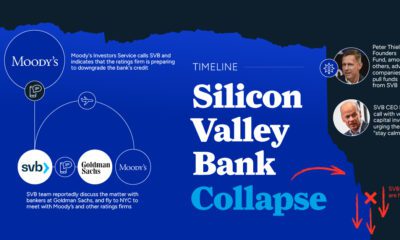

Silicon Valley Bank was shuttered by regulators becoming the largest bank to fail since the height of the Financial Crisis. What happened?


In this visual, we've ranked the top U.S. metropolitan areas in terms of their GDP. How does your city rank?


This month sees the launch of the VC+ archive, giving easy access to all past content we've sent out alongside March's special features.


While Russia still makes billions from fossil fuel exports, revenues are declining. Here are the largest importers since the start of the invasion.


This century has seen divergent price movement. Many consumer goods are cheaper, while critical categories like health and education have skyrocketed.


How much oil, coal, and natural gas do we extract each year? See the scale of annual fossil fuel production in perspective.


Prices for our premium memberships will be increasing on Feb 1st. Act now and get VC+ at its current rate.


