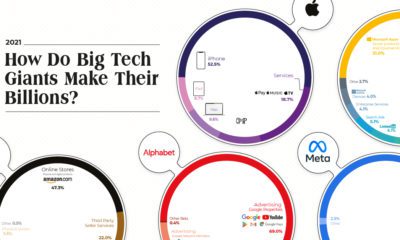

The Big Five tech companies made $1.4 trillion in revenue combined—more than Mexico’s entire GDP. Here's how they earned it all.
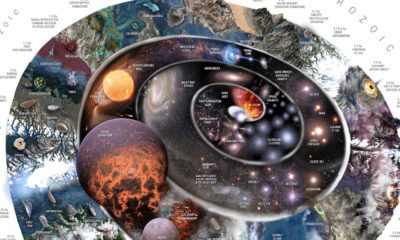

This spiral timeline shows the events that led us to our modern world, from the Big Bang to the present.

Now, you can explore even more data-driven visualizations from the global talent in our newly launched Creator Program.
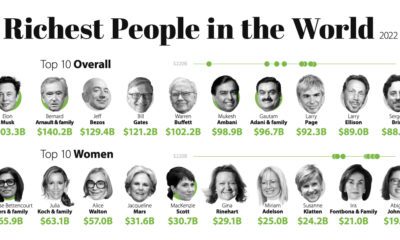

Elon Musk. MacKenzie Bezos. Zhang Yiming. This infographic is a snapshot of the richest people in the world during this turbulent time.
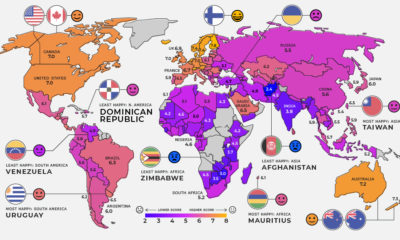

Global happiness levels are determined by several different factors. Here's a look at the happiest and unhappiest countries in every region.

Here's a sneak preview of features that VC+ members will have delivered straight to their inbox in March 2022.
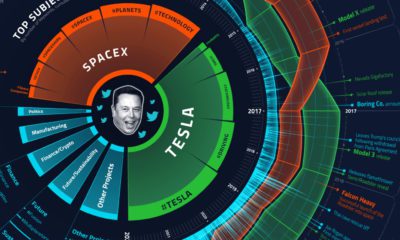

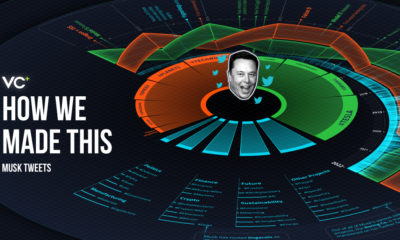
What goes on in the mind of Elon Musk, the world’s richest person? We analyzed over 15,000 of his tweets to find out.
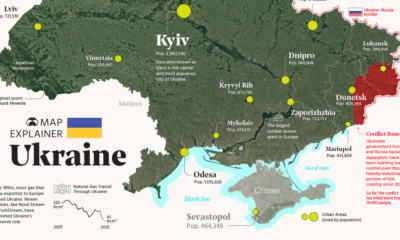

Ukraine has made the headlines due to the ongoing tensions with Russia. In this map infographic, we examine Ukraine from a structural point of view.

Here's a sneak preview of features that VC+ members will have delivered straight to their inbox in February 2022.
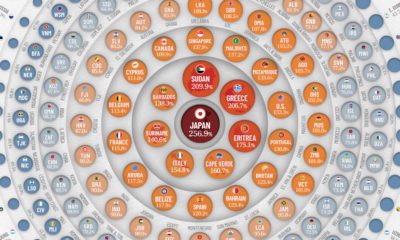

Global debt reached $226T by the end of 2020 – the biggest one-year jump since WWII. This graphic compares the debt-to-GDP ratio of various countries.


 Creator Program