Markets
Summing Up 5 Key Predictions For Global Markets in 2018
Despite being roughly nine years into the second-longest bull market in history, recent headwinds have cropped up to make the start of 2018 an interesting one for markets.
As investors re-evaluate their portfolios and exposure, it’s worth exploring some of the major themes and trends that are expected to drive markets in 2018.
Predictions for 2018
Today’s infographic was done in collaboration with Swissquote, a Swiss banking group, and it highlights their five most important predictions for the rest of the year ahead.
Taken from their 2018 Market Outlook Report, which can be downloaded for free, the following graphic discusses key themes of the year such as central bank policy, European unity, China, cryptocurrencies, and emerging markets.

Enjoy the infographic? Get the full report for free from the Swissquote 2018 Market Outlook page.
Swissquote’s Predictions
Here are the high level points of Swissquote’s predictions:
1. Fed in Inflation Fighting Stance
Despite a strong economy, specifically tight labor markets, inflation has perplexingly not appeared. In Swissquote’s view, expansionary monetary policy by central banks is the primary reason for the current stretched valuations.
And of the central banks, the Fed is not only the most important – but also the most active. Expecting a sudden kick from ultra-tight labor markets to boost wage growth and consumer inflation, the Fed is again ready to act in 2018.
As a result, Swissquote sees U.S. GDP growing 2.2%, the labor market tightening, and annual core PCE inflation hitting 1.8%.
Prediction: The Fed will hike three times.
2. Unified Europe Will Emerge from Spain
The start of 2017 brought fears of the EU’s demise, as rising political populism suggested an end to EU federalism. However, despite recent events in Catalonia, Swissquote sees Europe actually emerging from 2018 more united.
Heading into 2018, economic sentiment in Europe is at 10-year highs. Further, the election of Macron in France – and the re-election of Merkel in Germany – will mean a continued push for deeper EU integration.
In 2018, Swissquote sees the following headwinds in Europe: uncertainty around independence in Catalonia, the Italian elections, and austerity in Greece.
Prediction: The powerful trio of Macron, Merkel, and Draghi will weather the storm – and their unity will have a profound effect on pricing in events such as Brexit and the Italian elections.
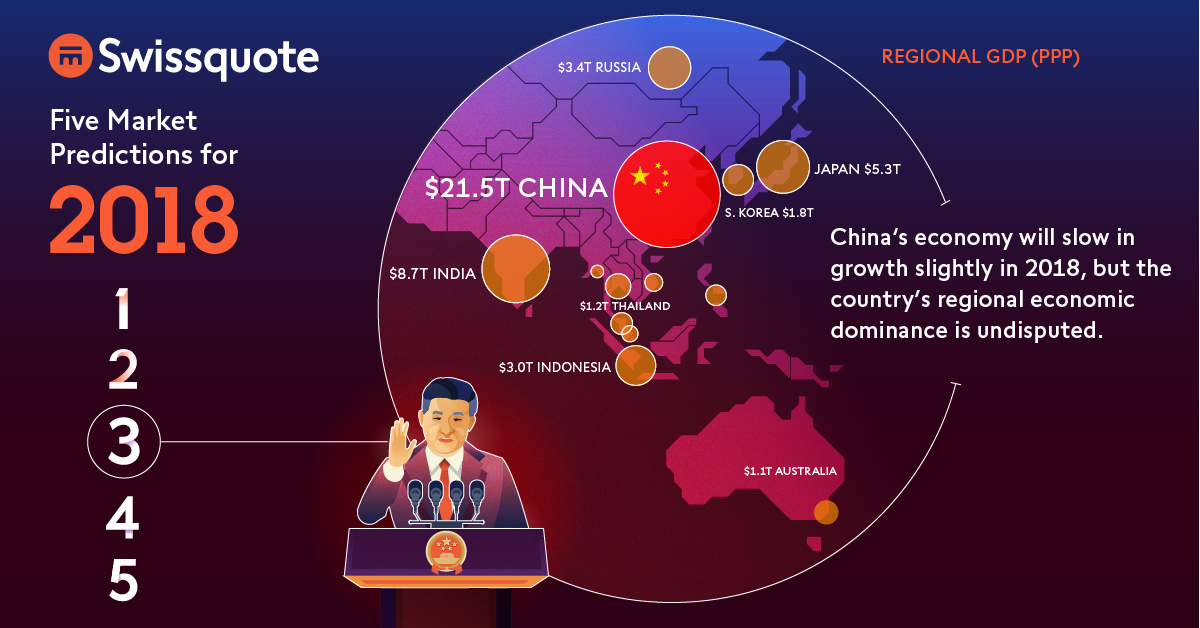
3. China Grabs the Political Void
China’s economy will slow in growth slightly in 2018, but the country’s regional economic dominance is undisputed. With a GDP (PPP) of $21.5 trillion, it even dwarfs India ($8.7 trillion), Japan ($5.3 trillion) and Russia ($3.4 trillion) combined.
And empowered by the volatile behavior of President Trump, China has embraced its new role as regional and global leader. Judging from the 2017 World Economic Forum in Davos and the Chinese Communist party congress, Xi Jinping and China are ready to step into the light.
Prediction: China will step up efforts to further entrench its hybrid model, which includes politics and economics.
4. Cryptocurrencies are the Real “Populist” Vote
While the Brexit and Trump votes represent the protest of existing systems – there’s also a monetary component to that populism that is hiding in plain sight.
Central banks have created trillions of dollars out of thin air since the 2008 crisis, and people no longer trust the government to protect their money and wealth. As a result? People have been pouring money into bitcoins and altcoins instead.
Prediction: This “populist” vote against the monetary policy of global central banks will continue in full form.
5. Emerging Markets Lead the Growth Charge
GDP growth in emerging markets for 2017 is expected to be 4.5% – its highest point since 2015 – versus 2.1% for developed markets.
Although protectionism will continue to make the headlines, any real action will be limited, even by the Trump administration.
Prediction: The story for EM in 2018 will be a further increase in international trading. Following a trend, China has reached 15 free-trade agreements with 23 countries and regions. And like in 2017, emerging markets will continue to have more growth and higher returns as a result.


Markets
Visualized: Interest Rate Forecasts for Advanced Economies
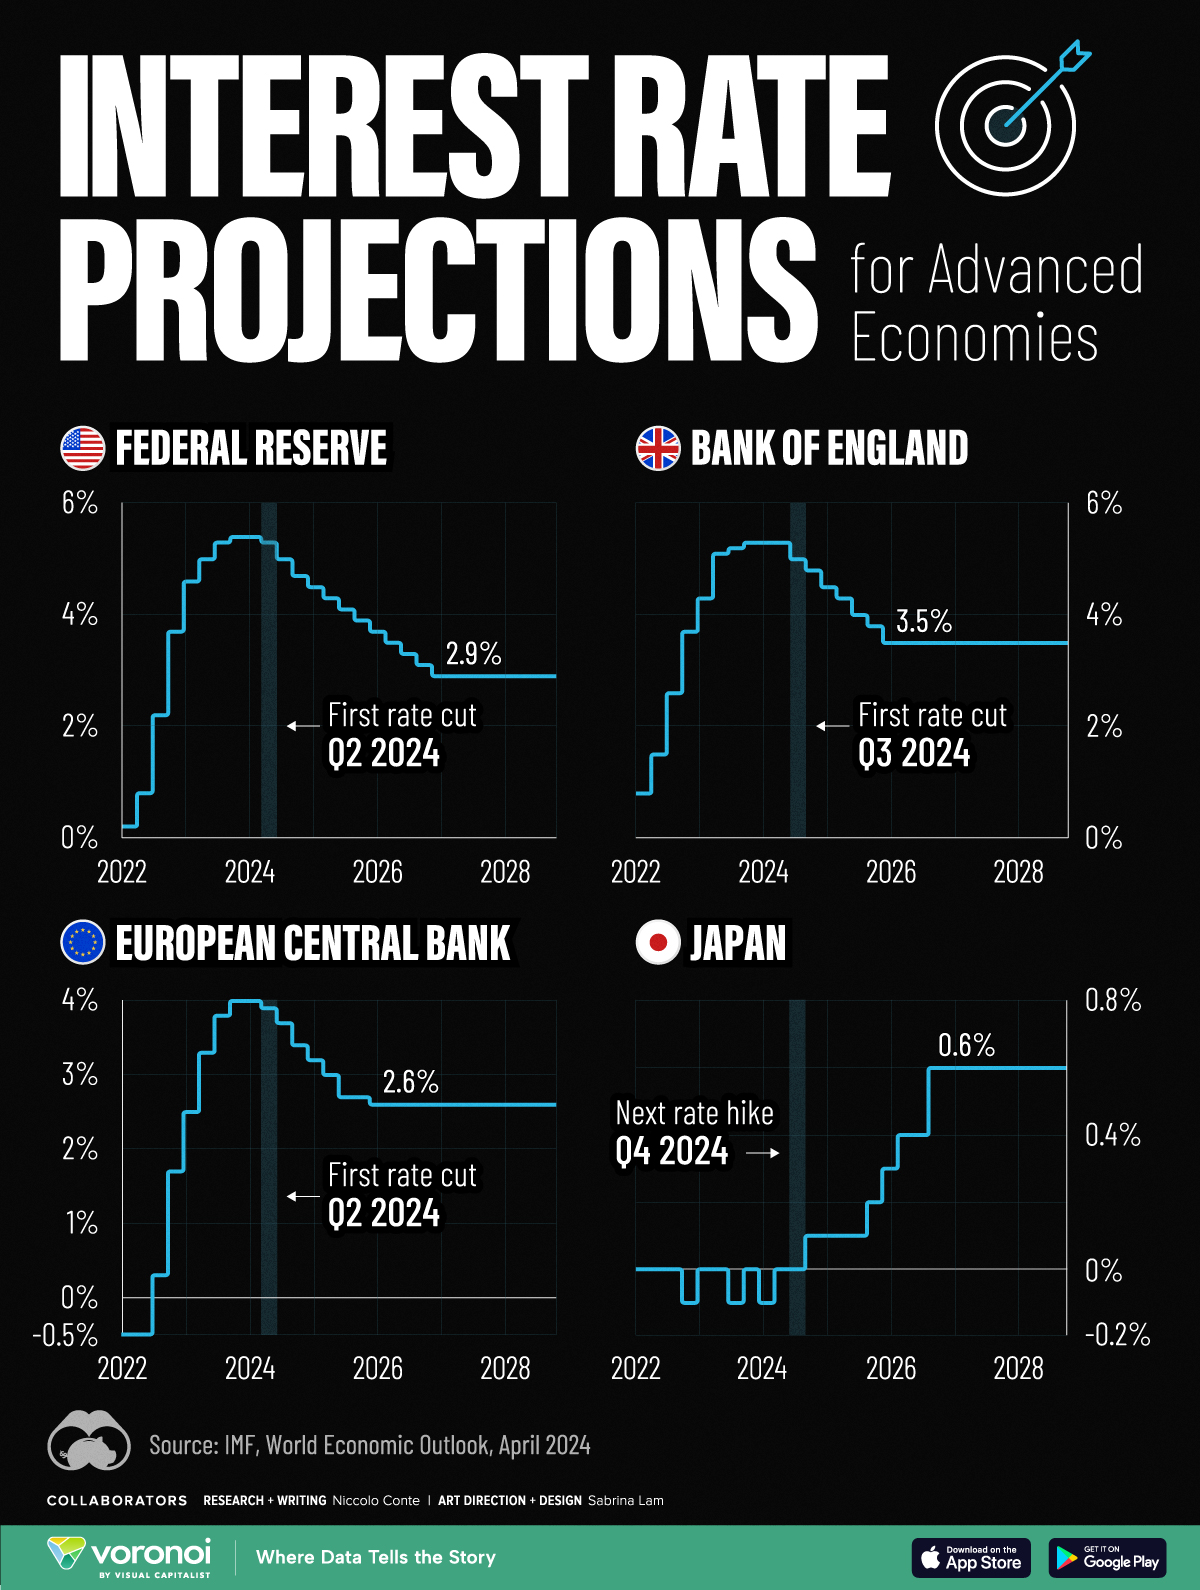
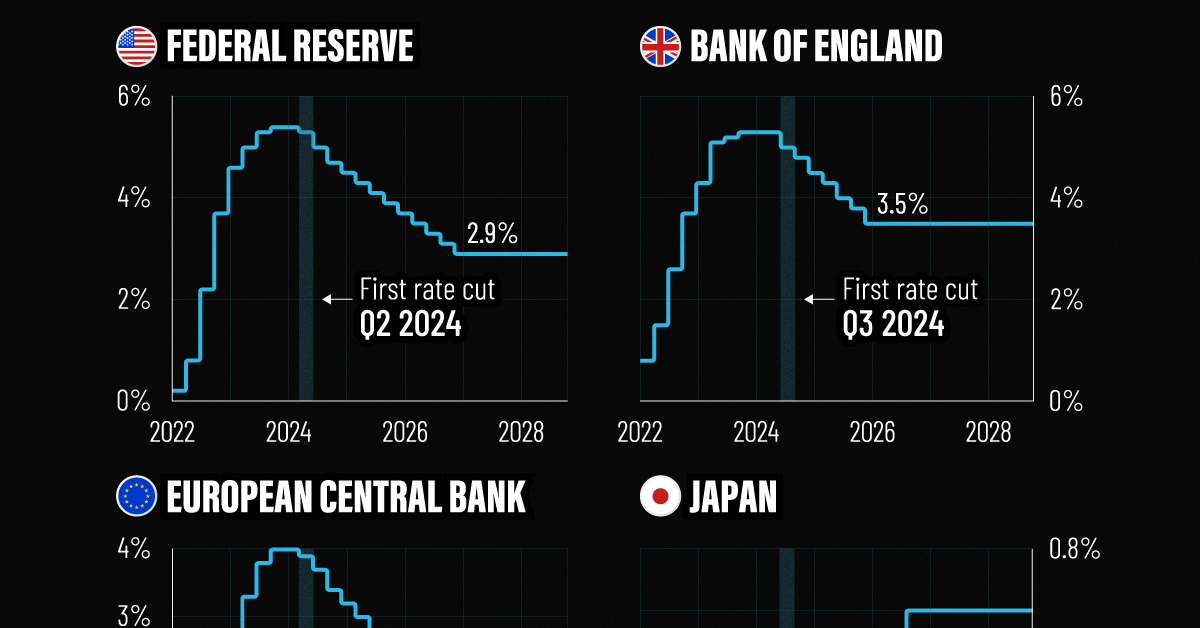
In this graphic, we show the IMF’s interest rate forecast for the U.S., Europe, the UK, and Japan for the next five years ahead.
Interest Rate Projections for Advanced Economies
While U.S. inflation cooled in the second half of last year, price pressures returned in 2024, leading investors to rethink how soon central bankers will cut rates.
Despite the recent increase, the interest rate forecast for many economies looks optimistic, thanks to subdued energy price shocks and abating supply chain disruptions. Still, short-term risks remain, including persistently high services inflation clouding the outlook.
This graphic shows the interest rate forecast for advanced economies, based on the International Monetary Fund’s (IMF) 2024 World Economic Outlook.
Get the Key Insights of the IMF’s World Economic Outlook
Want a visual breakdown of the insights from the IMF’s 2024 World Economic Outlook report?
This visual is part of a special dispatch of the key takeaways exclusively for VC+ members.
Get the full dispatch of charts by signing up to VC+.
A Closer Look at the IMF Interest Rate Forecast
Below, we show the projected path of interest rates based on the IMF’s latest data:
| Federal Reserve | Bank of England | ECB | Bank of Japan | |
|---|---|---|---|---|
| Q1 2024 | 5.4% | 4.0% | -0.1% | 5.3% |
| Q2 2024 | 5.3% | 3.9% | 0.0% | 5.3% |
| Q3 2024 | 5.0% | 3.7% | 0.0% | 5.0% |
| Q4 2024 | 4.7% | 3.4% | 0.1% | 4.8% |
| Q1 2025 | 4.5% | 3.2% | 0.1% | 4.5% |
| Q2 2025 | 4.3% | 3.0% | 0.1% | 4.3% |
| Q3 2025 | 4.1% | 2.7% | 0.1% | 4.0% |
| Q4 2025 | 3.9% | 2.7% | 0.2% | 3.8% |
| Q1 2026 | 3.7% | 2.6% | 0.3% | 3.5% |
| Q2 2026 | 3.5% | 2.6% | 0.4% | 3.5% |
| Q3 2026 | 3.3% | 2.6% | 0.4% | 3.5% |
| Q4 2026 | 3.1% | 2.6% | 0.6% | 3.5% |
| Q1 2027 | 2.9% | 2.6% | 0.6% | 3.5% |
| Q2 2027 | 2.9% | 2.6% | 0.6% | 3.5% |
| Q3 2027 | 2.9% | 2.6% | 0.6% | 3.5% |
| Q4 2027 | 2.9% | 2.6% | 0.6% | 3.5% |
| Q1 2028 | 2.9% | 2.6% | 0.6% | 3.5% |
| Q2 2028 | 2.9% | 2.6% | 0.6% | 3.5% |
| Q3 2028 | 2.9% | 2.6% | 0.6% | 3.5% |
| Q4 2028 | 2.9% | 2.6% | 0.6% | 3.5% |
As we can see, the U.S. is forecast to see its first rate cut in the second quarter of 2024.
Broadly speaking, rates will be cut very gradually, with two additional rate cuts anticipated for this year. By 2027, interest rates are projected to fall to 2.9% after a series of moderate rate cuts as inflation dissipates.
Like the U.S., the European Central Bank is forecast to cut rates in the second quarter of 2024, with rates set to fall to 2.6% by 2026. While inflation has cooled at a faster rate across Europe compared to the U.S., GDP growth is also projected to be more muted. This year, the IMF projects that GDP across the euro area will increase just 0.8% versus 2.7% for the U.S. economy.
In the UK, monetary easing is projected to move more gradually, with the first cut projected for the third quarter of this year. Growth across the UK economy is projected to be tepid for 2024, weighed down by the impact of higher rates, lower productivity, and sluggish investment growth.
Rates Rising Slowly in Japan
After years of enduring negative interest rates, Japan raised its short-term policy rate to 0.0-0.1% in March 2024.
This was due in part to a promising inflation outlook over the coming years. The IMF projects that the next rate hike will take place in the fourth quarter of 2024, as it moves away from a multi-decade battle with deflation.
Get the Full Analysis of the IMF’s Outlook on VC+
This visual is part of an exclusive special dispatch for VC+ members which breaks down the key takeaways from the IMF’s 2024 World Economic Outlook.
For the full set of charts and analysis, sign up for VC+.

-

 Wealth6 days ago
Charted: Which City Has the Most Billionaires in 2024?
-

 Mining2 weeks ago
Gold vs. S&P 500: Which Has Grown More Over Five Years?
-

 Uranium2 weeks ago
The World’s Biggest Nuclear Energy Producers
-

 Education2 weeks ago
How Hard Is It to Get Into an Ivy League School?
-

 Debt2 weeks ago
How Debt-to-GDP Ratios Have Changed Since 2000
-

 Sports2 weeks ago
The Highest Earning Athletes in Seven Professional Sports
-

 Science2 weeks ago
Visualizing the Average Lifespans of Mammals
-

 Brands1 week ago
How Tech Logos Have Evolved Over Time