Visualized: A Step-by-Step Guide to Tax-Loss Harvesting
A Step-by-Step Guide to Tax-Loss Harvesting
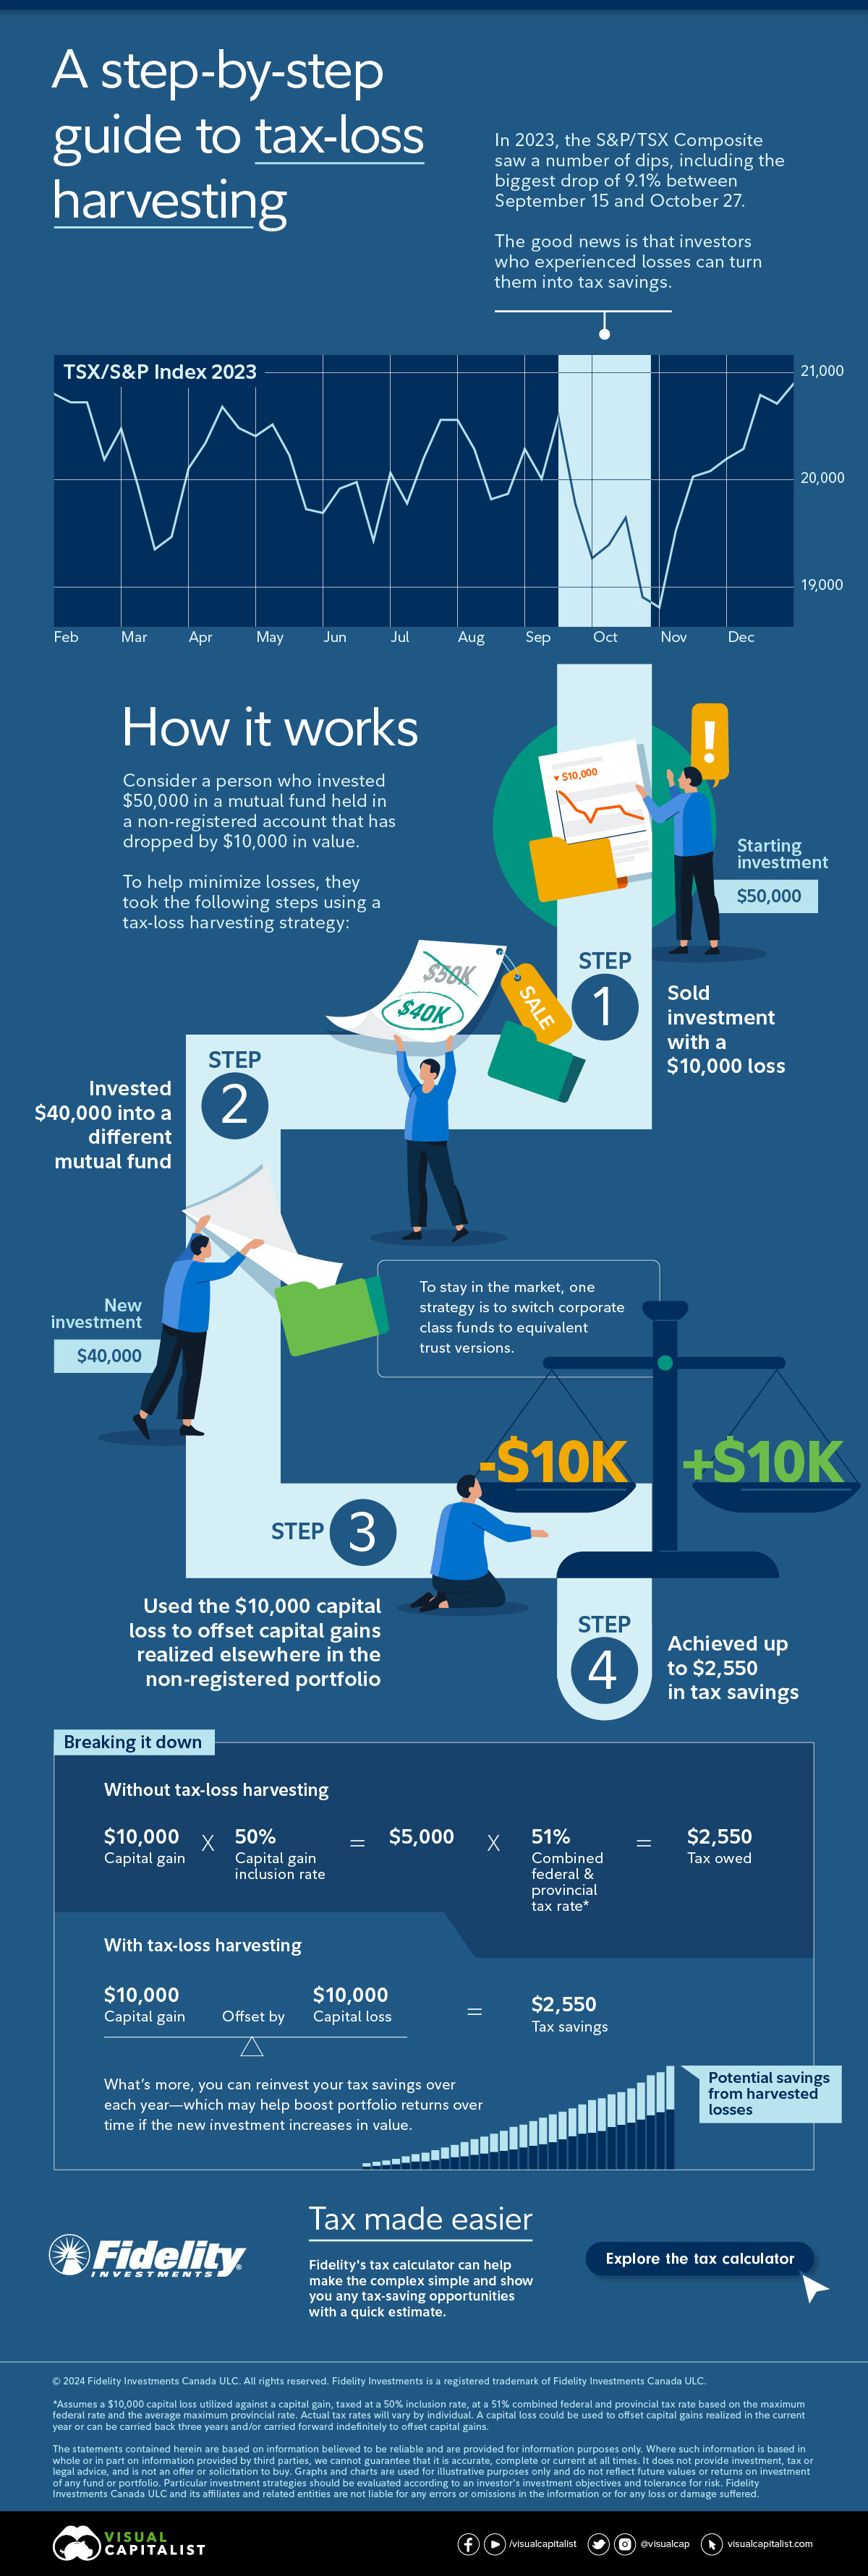
Market ups and downs can be unnerving, but the good news is that tax-loss harvesting allows investors in Canada to capture tax savings when their portfolio drops in value.
While it sounds complicated, a tax-loss harvesting strategy is actually fairly straightforward. An investor can use capital losses to offset capital gains found elsewhere in their portfolio, leading to a lower tax bill. While there are important conditions to keep in mind, investors can use this strategy to enhance portfolio returns over time by reinvesting these tax savings.
This graphic from Fidelity Investments shows how tax-loss harvesting works and why it may improve tax efficiency in an investor’s portfolio.
Breaking It Down
Consider a person who invested $50,000 in a mutual fund held in a non-registered account that has dropped by $10,000 in value. To help minimize losses, they took the following steps in a tax-loss harvesting strategy.
For the sake of this example, taxes are based on the maximum federal rate and the average maximum provincial tax rate.
- Sold investment with a $10,000 loss
- Invested $40,000 into a different mutual fund
- Used the $10,000 capital loss to offset capital gains realized elsewhere in the non-registered portfolio
- Achieved up to $2,550 in tax savings
The investor realized as much as $2,550 in tax savings by utilizing a $10,000 loss against a $10,000 capital gain. Without tax-loss harvesting, this $10,000 capital gain would be taxed at a 50% capital gains inclusion rate ($10,000 X 50% = $5,000). This $5,000 in applicable gains is then taxed at a 51% combined federal and provincial tax rate ($5,000 X 51% = $2,550 in taxes owed).
In contrast, by using tax-loss harvesting, the investor would have achieved up to $2,550 in tax savings.
What’s more, you can reinvest your tax savings over each year—which may help boost portfolio returns over time if the new investment increases in value.
Tax-Loss Harvesting Tips
With a tax-loss harvesting strategy, here are some key tips and considerations to keep in mind:
- Investment Timeline: A capital loss can be used to offset capital gains not only in the current year, but in the three years prior and/or any year indefinitely in the future.
- New Investment Type: After selling an investment that’s dropped in value, it’s important to buy a different investment to avoid triggering the ‘superficial loss rule’. Investors can aim to choose an investment with similar long-term returns.
- Plan for Year-End: In order to achieve a capital loss, plan to sell an investment at least two to three days before the year’s final trading day so the investment settles before year-end.
Together, these tips can help investors strategically execute a tax-loss harvesting strategy.
Tax Made Easier
During volatile markets, investors can seize the opportunity to turn losses into tax savings using tax-loss harvesting as a key tool to help generate higher after-tax returns.
Explore Fidelity’s tax calculator to discover tax-saving opportunities.

-

 Investor Education6 months ago
The 20 Most Common Investing Mistakes, in One Chart
Here are the most common investing mistakes to avoid, from emotionally-driven investing to paying too much in fees.
-

 Stocks10 months ago
Visualizing BlackRock’s Top Equity Holdings
BlackRock is the world’s largest asset manager, with over $9 trillion in holdings. Here are the company’s top equity holdings.
-

 Investor Education11 months ago
10-Year Annualized Forecasts for Major Asset Classes
This infographic visualizes 10-year annualized forecasts for both equities and fixed income using data from Vanguard.
-

 Investor Education1 year ago
Visualizing 90 Years of Stock and Bond Portfolio Performance
How have investment returns for different portfolio allocations of stocks and bonds compared over the last 90 years?
-

 Debt2 years ago
Countries with the Highest Default Risk in 2022
In this infographic, we examine new data that ranks the top 25 countries by their default risk.
-

 Markets2 years ago
The Best Months for Stock Market Gains
This infographic analyzes over 30 years of stock market performance to identify the best and worst months for gains.