Chart of the Week
The Sum of Its Parts: The Smartphone Multiplier Market


The Sum of Its Parts: The Smartphone Multiplier Market
There’s a 60% chance you’re reading this article on a smartphone right now—a testament to how ubiquitous these devices have truly become in our lives.
We rely on smartphones every waking minute to stay connected. However, the various products and services—also known as the smartphone multiplier market—that allow us to use these devices in the first place can often be an afterthought.
Today’s chart uses data from Deloitte Insights to show just how sizable this ecosystem is becoming, and why it’s heating up as a battleground for big technology companies such as Apple, Alphabet, and Amazon.
The Smartphone Plateau
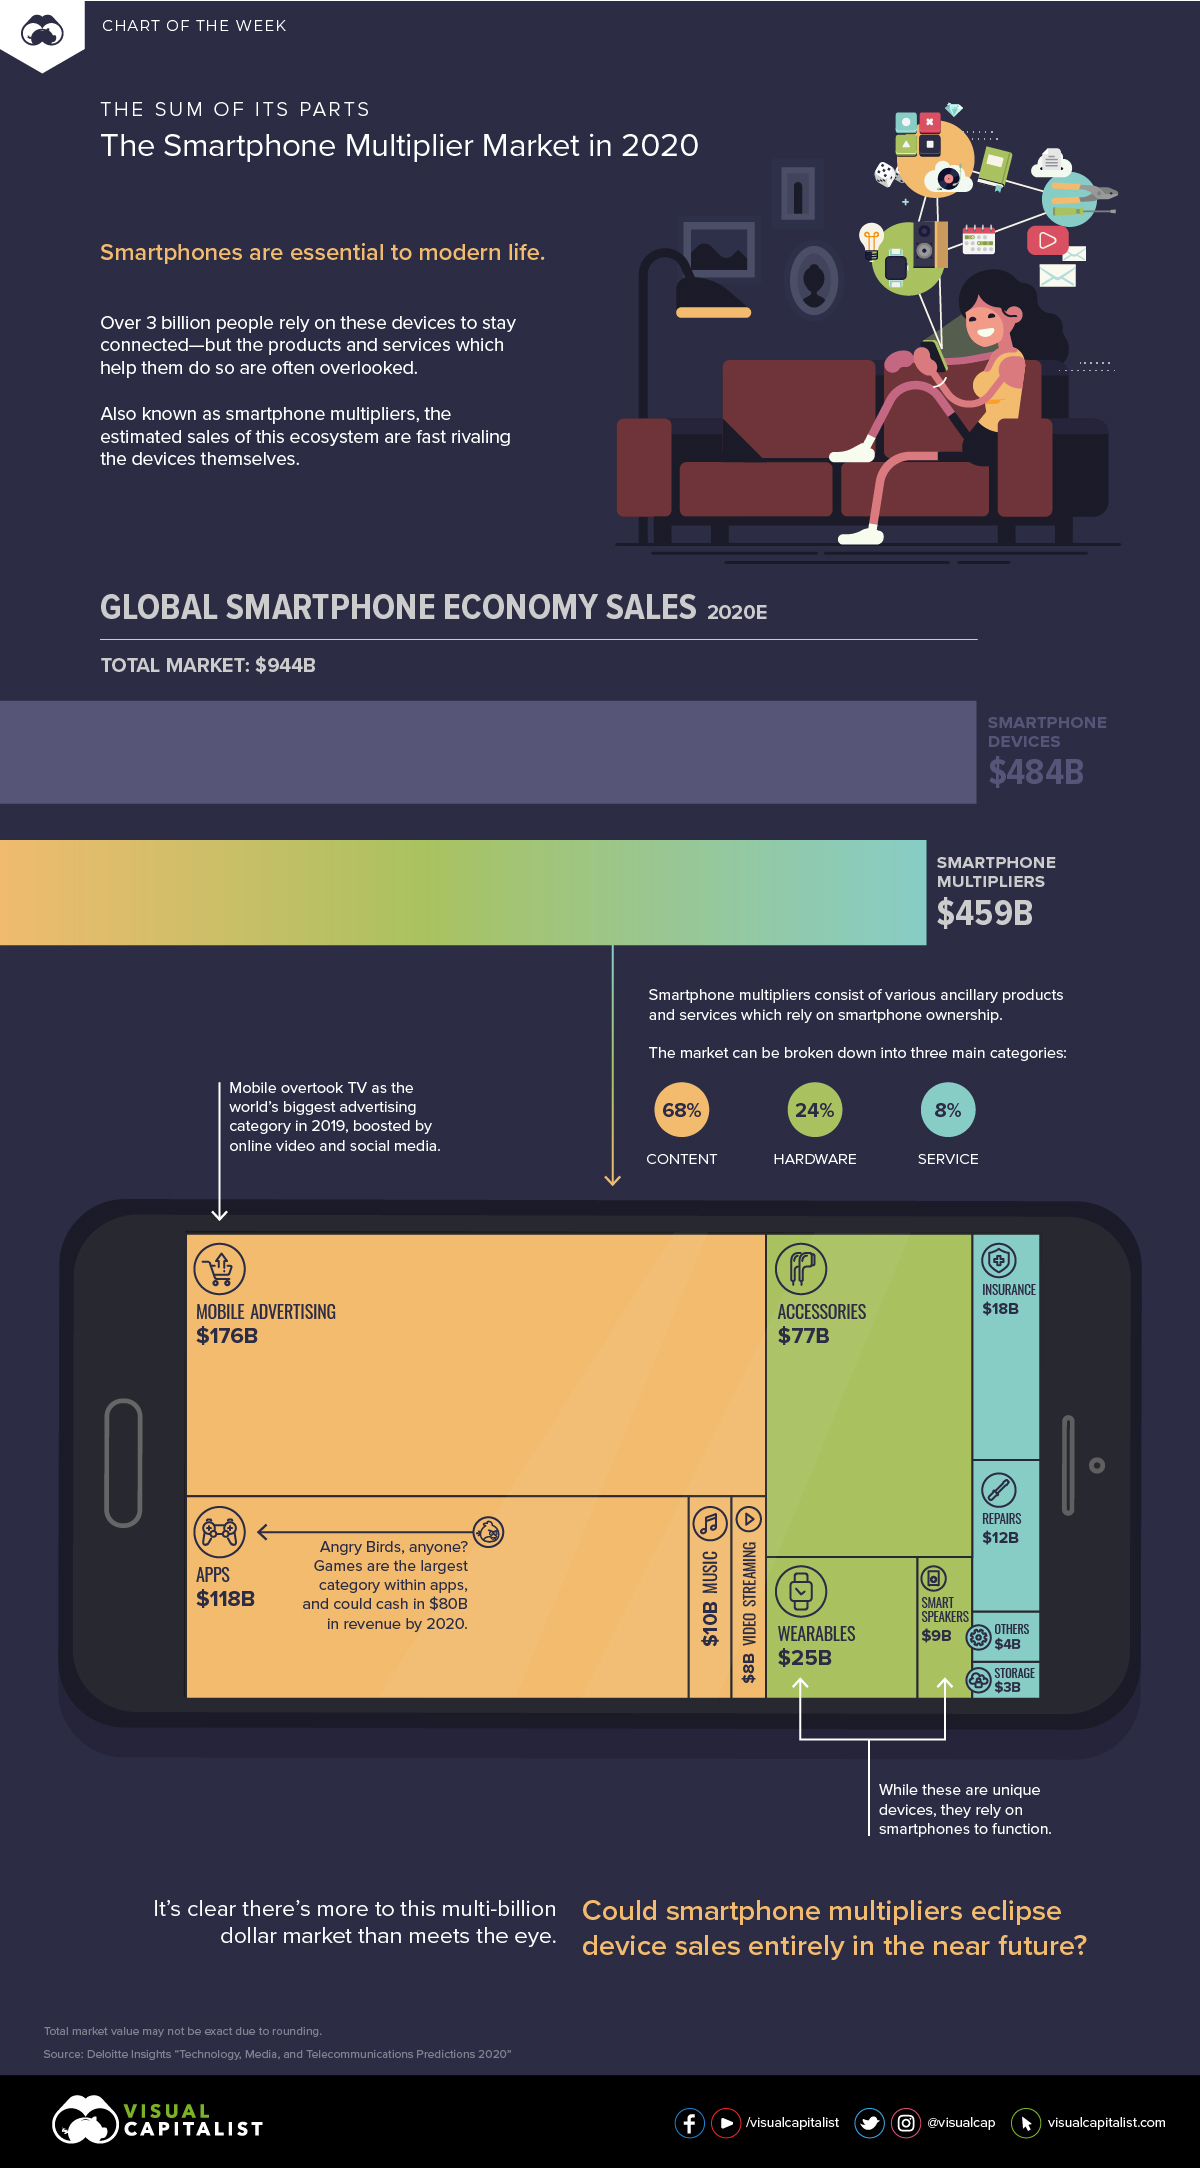
There are over 3.3 billion smartphone users in the world today.
The smartphone economy—estimated to pull in $944 billion in total revenue in 2020—is so massive that it rivals the GDP of countries like Indonesia and the Netherlands.
At the moment, the smartphones themselves contribute over half the market value. Despite the continued hype surrounding the release of new models, global unit shipments of smartphone devices appears to have reached a saturation point:
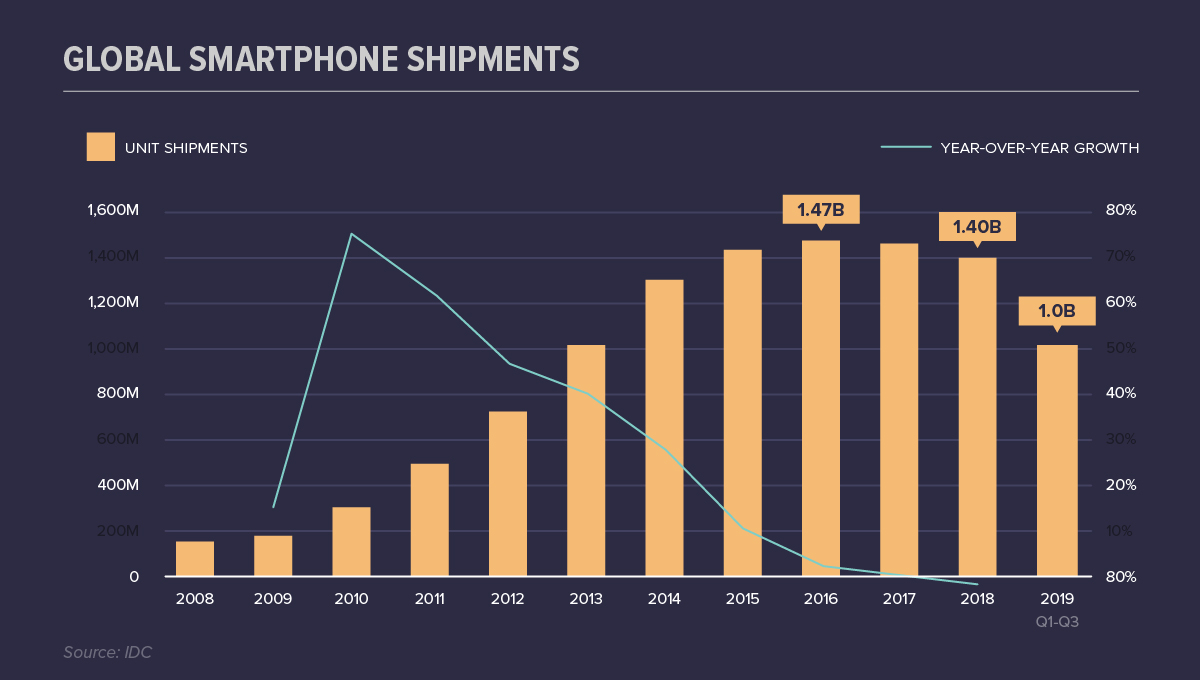
There are two theories as to why shipments are leveling off. First, product innovation is more iterative today than in the past, which means there are fewer groundbreaking features to entice consumers into purchasing new devices. A second factor is that people are simply holding onto their devices for longer than in the past.
As device sales plateau, tech giants are diversifying efforts to find new ways to lure customers back in—and another related market is growing more lucrative as a result.
What is a “Smartphone Multiplier”?
When people think of the smartphone market, hardware likely springs to mind first, but an equally important part of the equation is the plethora of apps, services, accessories, and complementary devices that help us connect with the digital world.
The ecosystem of these products and services are known as smartphone multipliers. According to Deloitte, this ecosystem will drive $459 billion of revenues in 2020, an impressive 15% increase from the prior year.
The market can be broken down into three main categories:
| Category | Market Value (2020e) | Sub-categories |
|---|---|---|
| Content | $312B (68% of total) | $176B: Mobile ads $118B: Apps $10B: Music $8B: Video |
| Hardware | $111B (24% of total) | $77B: Accessories $25B: Wearables $9B: Smart speakers |
| Services | $37B (8% of total) | $18B: Insurance $12B: Repairs $4B: Others $3B: Storage |
Largely driven by mobile advertising and app sales, content is by far the largest subcategory, accounting for 68% of revenues:
- Mobile advertising surpassed TV as the largest advertising channel in 2019, partially thanks to the relentless growth of online video and social media, making ads virtually unavoidable on a smartphone.
- Gaming apps are benefiting from the immense processing power of today’s smartphones—and will bring in over two-thirds of total app revenue in 2020. Apple’s app store brought in approximately $1.8 billion in sales between Christmas Eve and New Year’s Day alone.
If you’ve ever owned a pair of headphones or a powerbank, it’s easy to understand why accessories are the third-largest subcategory in the smartphone multiplier market. With more people ditching the cable for wireless headphones, this subcategory is also set to grow even more.
The Next $1T Economy?
In the U.S., 73% of adults go online several times a day or almost constantly, which makes it clear that they aren’t going to give up their smartphones anytime soon.
As a result, smartphone multipliers will continue to evolve and flourish, presenting a unique opportunity for investors and businesses.
Altogether, it’s expected that the smartphone multiplier market will grow between 5 and 10% annually through 2023, likely propelling the entire smartphone economy past the $1 trillion benchmark in the coming years.
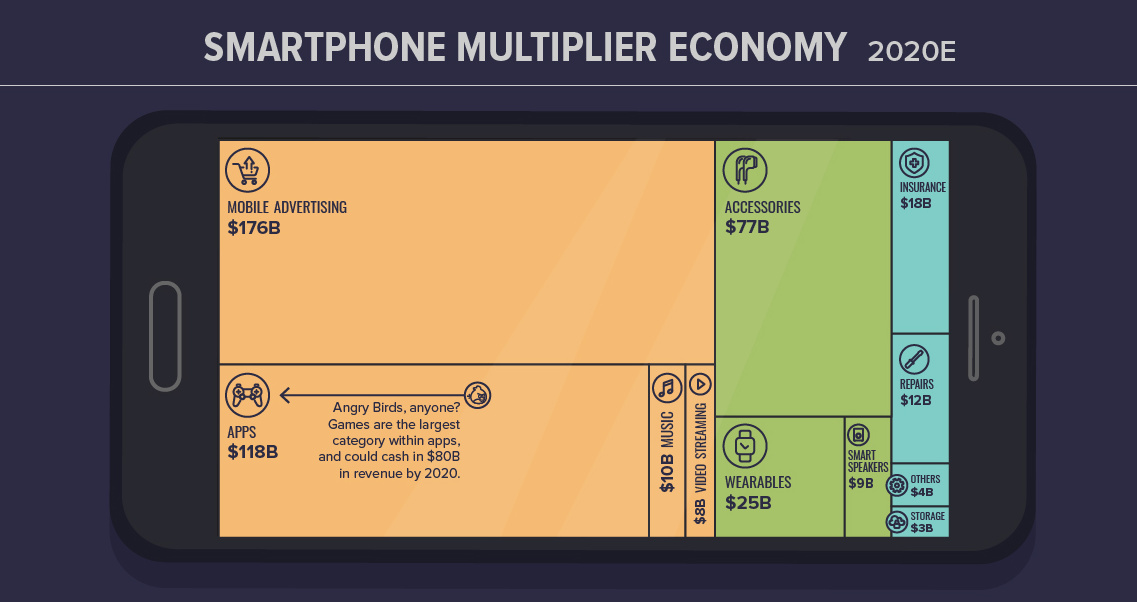


Chart of the Week
The Road to Recovery: Which Economies are Reopening?
We look at mobility rates as well as COVID-19 recovery rates for 41 economies, to see which countries are reopening for business.

The Road to Recovery: Which Economies are Reopening?
COVID-19 has brought the world to a halt—but after months of uncertainty, it seems that the situation is slowly taking a turn for the better.
Today’s chart measures the extent to which 41 major economies are reopening, by plotting two metrics for each country: the mobility rate and the COVID-19 recovery rate:
- Mobility Index
This refers to the change in activity around workplaces, subtracting activity around residences, measured as a percentage deviation from the baseline. - COVID-19 Recovery Rate
The number of recovered cases in a country is measured as the percentage of total cases.
Data for the first measure comes from Google’s COVID-19 Community Mobility Reports, which relies on aggregated, anonymous location history data from individuals. Note that China does not show up in the graphic as the government bans Google services.
COVID-19 recovery rates rely on values from CoronaTracker, using aggregated information from multiple global and governmental databases such as WHO and CDC.
Reopening Economies, One Step at a Time
In general, the higher the mobility rate, the more economic activity this signifies. In most cases, mobility rate also correlates with a higher rate of recovered people in the population.
Here’s how these countries fare based on the above metrics.
| Country | Mobility Rate | Recovery Rate | Total Cases | Total Recovered |
|---|---|---|---|---|
| Argentina | -56% | 31.40% | 14,702 | 4,617 |
| Australia | -41% | 92.03% | 7,150 | 6,580 |
| Austria | -100% | 91.93% | 16,628 | 15,286 |
| Belgium | -105% | 26.92% | 57,849 | 15,572 |
| Brazil | -48% | 44.02% | 438,812 | 193,181 |
| Canada | -67% | 52.91% | 88,512 | 46,831 |
| Chile | -110% | 41.58% | 86,943 | 36,150 |
| Colombia | -73% | 26.28% | 25,366 | 6,665 |
| Czechia | -29% | 70.68% | 9,140 | 6,460 |
| Denmark | -93% | 88.43% | 11,512 | 10,180 |
| Finland | -93% | 81.57% | 6,743 | 5,500 |
| France | -100% | 36.08% | 186,238 | 67,191 |
| Germany | -99% | 89.45% | 182,452 | 163,200 |
| Greece | -32% | 47.28% | 2,906 | 1,374 |
| Hong Kong | -10% | 97.00% | 1,067 | 1,035 |
| Hungary | -49% | 52.31% | 3,816 | 1,996 |
| India | -65% | 42.88% | 165,386 | 70,920 |
| Indonesia | -77% | 25.43% | 24,538 | 6,240 |
| Ireland | -79% | 88.92% | 24,841 | 22,089 |
| Israel | -31% | 87.00% | 16,872 | 14,679 |
| Italy | -52% | 64.99% | 231,732 | 150,604 |
| Japan | -33% | 84.80% | 16,683 | 14,147 |
| Malaysia | -53% | 80.86% | 7,629 | 6,169 |
| Mexico | -69% | 69.70% | 78,023 | 54,383 |
| Netherlands | -97% | 0.01% | 45,950 | 3 |
| New Zealand | -21% | 98.01% | 1,504 | 1,474 |
| Norway | -100% | 91.87% | 8,411 | 7,727 |
| Philippines | -87% | 23.08% | 15,588 | 3,598 |
| Poland | -36% | 46.27% | 22,825 | 10,560 |
| Portugal | -65% | 58.99% | 31,596 | 18,637 |
| Singapore | -105% | 55.02% | 33,249 | 18,294 |
| South Africa | -74% | 52.44% | 27,403 | 14,370 |
| South Korea | -4% | 91.15% | 11,344 | 10,340 |
| Spain | -67% | 69.11% | 284,986 | 196,958 |
| Sweden | -93% | 13.91% | 35,727 | 4,971 |
| Switzerland | -101% | 91.90% | 30,796 | 28,300 |
| Taiwan | 4% | 95.24% | 441 | 420 |
| Thailand | -36% | 96.08% | 3,065 | 2,945 |
| U.S. | -56% | 28.20% | 1,768,346 | 498,720 |
| United Kingdom | -82% | 0.05% | 269,127 | 135 |
| Vietnam | 15% | 85.02% | 327 | 278 |
Mobility data as of May 21, 2020 (Latest available). COVID-19 case data as of May 29, 2020.
In the main scatterplot visualization, we’ve taken things a step further, assigning these countries into four distinct quadrants:
1. High Mobility, High Recovery
High recovery rates are resulting in lifted restrictions for countries in this quadrant, and people are steadily returning to work.
New Zealand has earned praise for its early and effective pandemic response, allowing it to curtail the total number of cases. This has resulted in a 98% recovery rate, the highest of all countries. After almost 50 days of lockdown, the government is recommending a flexible four-day work week to boost the economy back up.
2. High Mobility, Low Recovery
Despite low COVID-19 related recoveries, mobility rates of countries in this quadrant remain higher than average. Some countries have loosened lockdown measures, while others did not have strict measures in place to begin with.
Brazil is an interesting case study to consider here. After deferring lockdown decisions to state and local levels, the country is now averaging the highest number of daily cases out of any country. On May 28th, for example, the country had 24,151 new cases and 1,067 new deaths.
3. Low Mobility, High Recovery
Countries in this quadrant are playing it safe, and holding off on reopening their economies until the population has fully recovered.
Italy, the once-epicenter for the crisis in Europe is understandably wary of cases rising back up to critical levels. As a result, it has opted to keep its activity to a minimum to try and boost the 65% recovery rate, even as it slowly emerges from over 10 weeks of lockdown.
4. Low Mobility, Low Recovery
Last but not least, people in these countries are cautiously remaining indoors as their governments continue to work on crisis response.
With a low 0.05% recovery rate, the United Kingdom has no immediate plans to reopen. A two-week lag time in reporting discharged patients from NHS services may also be contributing to this low number. Although new cases are leveling off, the country has the highest coronavirus-caused death toll across Europe.
The U.S. also sits in this quadrant with over 1.7 million cases and counting. Recently, some states have opted to ease restrictions on social and business activity, which could potentially result in case numbers climbing back up.
Over in Sweden, a controversial herd immunity strategy meant that the country continued business as usual amid the rest of Europe’s heightened regulations. Sweden’s COVID-19 recovery rate sits at only 13.9%, and the country’s -93% mobility rate implies that people have been taking their own precautions.
COVID-19’s Impact on the Future
It’s important to note that a “second wave” of new cases could upend plans to reopen economies. As countries reckon with these competing risks of health and economic activity, there is no clear answer around the right path to take.
COVID-19 is a catalyst for an entirely different future, but interestingly, it’s one that has been in the works for a while.
Without being melodramatic, COVID-19 is like the last nail in the coffin of globalization…The 2008-2009 crisis gave globalization a big hit, as did Brexit, as did the U.S.-China trade war, but COVID is taking it to a new level.
—Carmen Reinhart, incoming Chief Economist for the World Bank
Will there be any chance of returning to “normal” as we know it?

-

 Brands6 days ago
How Tech Logos Have Evolved Over Time
-

 Demographics2 weeks ago
The Smallest Gender Wage Gaps in OECD Countries
-

 Economy2 weeks ago
Where U.S. Inflation Hit the Hardest in March 2024
-

 Green2 weeks ago
Top Countries By Forest Growth Since 2001
-

 United States2 weeks ago
Ranked: The Largest U.S. Corporations by Number of Employees
-

 Maps2 weeks ago
The Largest Earthquakes in the New York Area (1970-2024)
-

 Green2 weeks ago
Ranked: The Countries With the Most Air Pollution in 2023
-

 Green2 weeks ago
Ranking the Top 15 Countries by Carbon Tax Revenue