Markets
Ranked: The Most Valuable Nation Brands
Ranked: The Most Valuable Nation Brands
Talent and capital are increasingly mobile, so a country’s image and reputation — its brand — can have a big impact on the country’s economic fortunes.
This is particularly true in smaller nations such as Singapore, Switzerland, and the United Arab Emirates, which have all cultivated an investment and tourism-friendly image. Whether it’s attracting talent or wooing investment dollars, highly ranked nation brands can often outperform their rivals in the global marketplace.
The effect of a country’s image on the brands based there and the economy as a whole makes a nation brand the most important asset of any state.
– David Haigh, CEO, Brand Finance
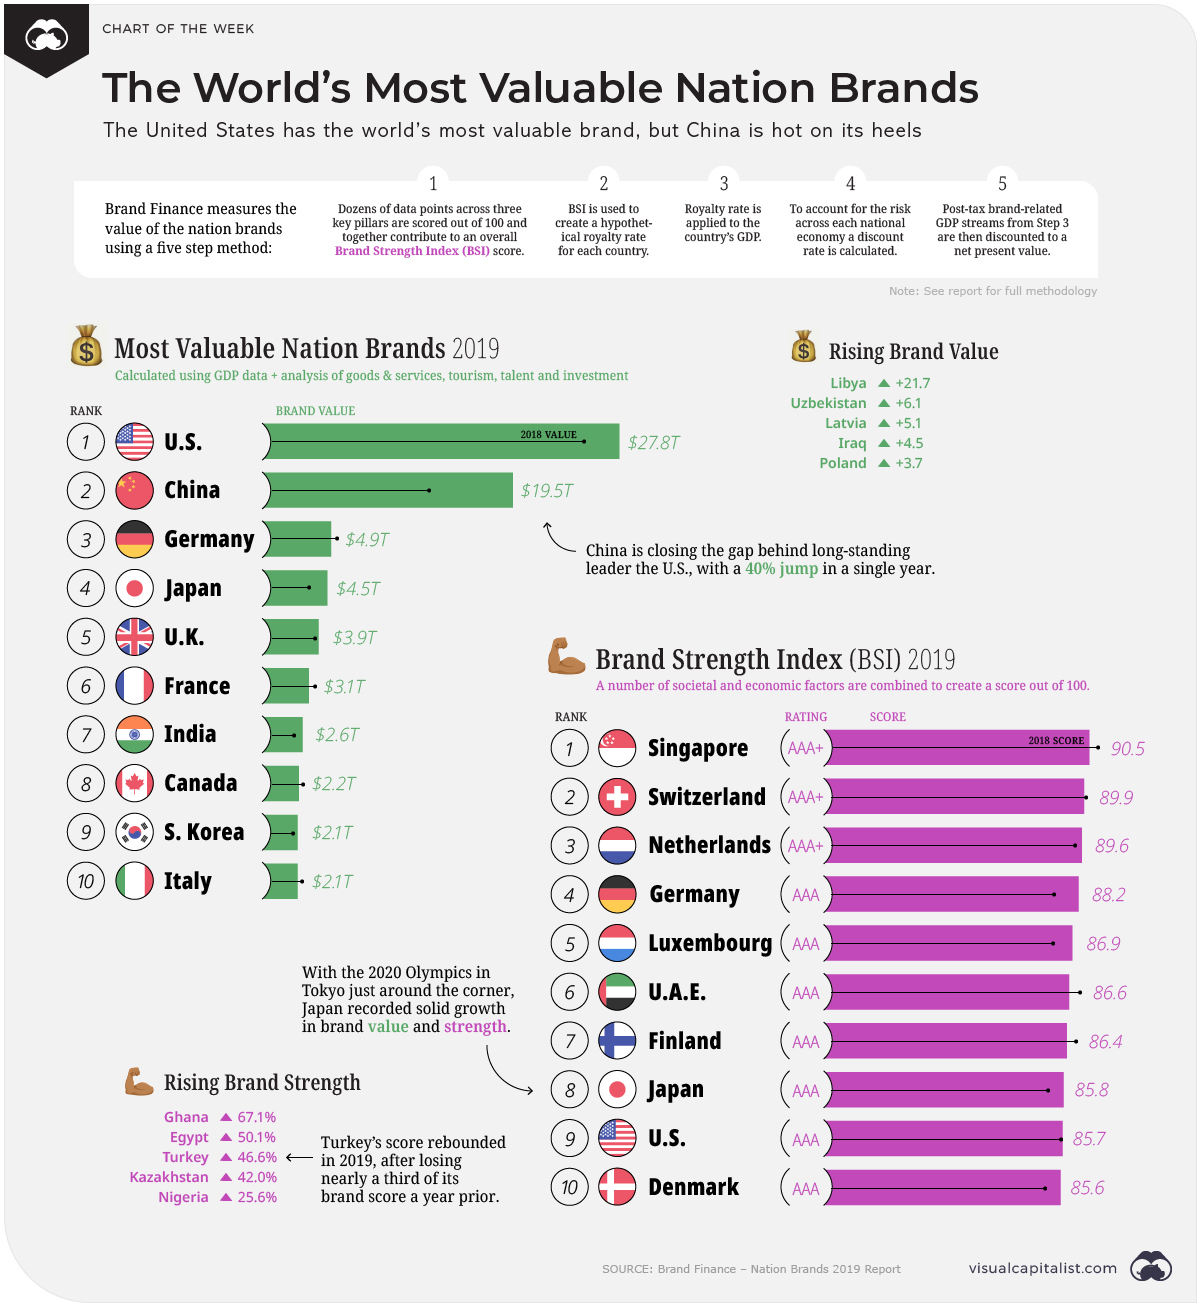
Today’s Chart of the Week uses data from Brand Finance’s Nation Brands report, which attempts to quantify the reputations of various countries around the world.
Quantifying Perception
The report breaks down the methodology in more detail, but here how the scoring system works. Brand Finance uses three pillars to calculate a Brand Strength Index (BSI) score:
- Goods & Services: Includes factors such as openness to tourism, market size, and trade rules
- Society: Includes factors such as quality of life, corruption, and cultural image
- Investment: Includes items such as talent retention, use of technology, R&D, taxation, and regulation
The BSI score is then used to calculate a hypothetical royalty rate, and to forecast revenues to ultimately derive a brand value (post-tax revenues discounted to calculate a net present value). This calculation produces the “Brand Value” of a country.
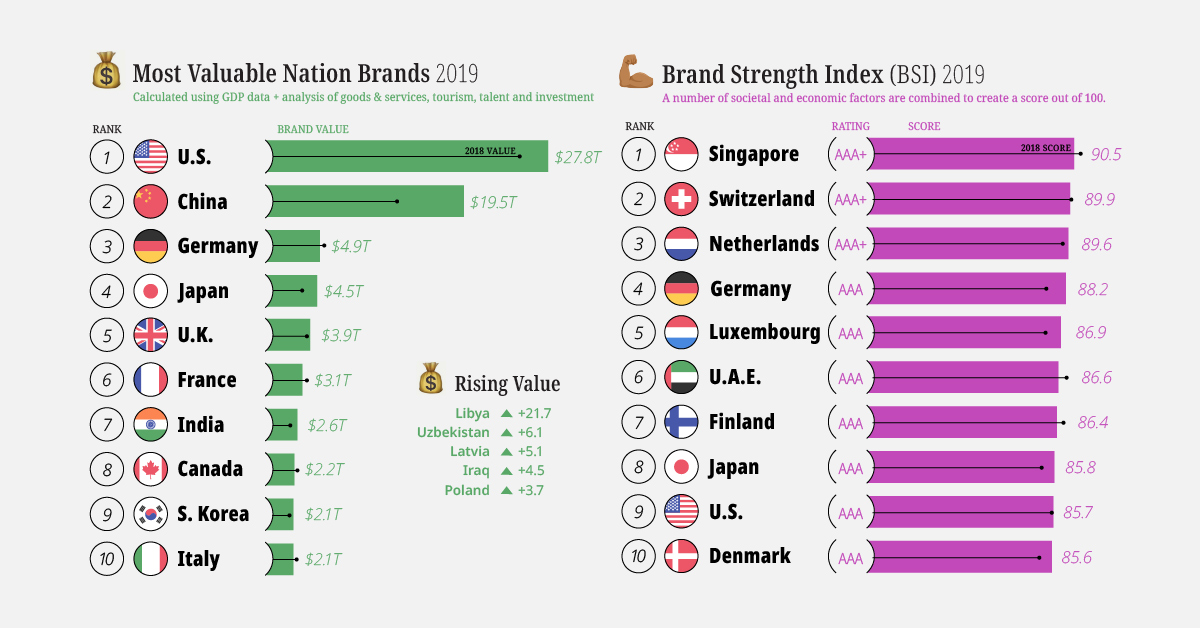
The Most Valuable Nation Brands
One of most impressive gains came from second-ranked China, which is rapidly closing the gap separating them from the United States. China’s brand value surged over 40% to $19.4 trillion — more than the cumulative brand value of the next five countries.
Not to be outdone, the United States also posted impressive numbers. Despite being a mature economy, the country’s brand value grew by 7.2% over the last year.
Here is the full top 10 list:
| Rank | Country | Nation Brand Value | Change vs 2018 |
|---|---|---|---|
| 1 | 🇺🇸 United States | $27.8T | +7.2% |
| 2 | 🇨🇳 China | $19.5T | +40.5% |
| 3 | 🇩🇪 Germany | $4.9T | -5.7% |
| 4 | 🇯🇵 Japan | $4.5T | +26.0% |
| 5 | 🇬🇧 United Kingdom | $3.9T | +2.7% |
| 6 | 🇫🇷 France | $3.1T | -4.0% |
| 7 | 🇮🇳 India | $2.6T | +18.7% |
| 8 | 🇨🇦 Canada | $2.2T | -1.8% |
| 9 | 🇰🇷 South Korea | $2.1T | +6.7% |
| 10 | 🇮🇹 Italy | $2.1T | -4.7% |
Top Countries by Brand Strength
One characteristic of the brand value score is that it’s heavily weighted towards the world’s larger economies. The BSI score, by contrast, may be a more accurate reflection of a government’s guidance of its nation brand as it eliminates the inherent GDP advantage that these bigger economies have.
Using the BSI scoring method, Singapore comes out on top — as it has every year since it supplanted Germany in 2015. The highly prosperous city-state serves as the business hub of Southeast Asia and is renowned for its world-class education, healthcare, transport, and low crime levels. These factors, paired with the nation’s unwavering political stability and commitment to its ‘Future Economy’ strategy, makes the island a very strong and stable nation on the global stage.
The top 10 strongest nation brands:
| Rank | Country | Brand Strength Index (BSI) Score | Change vs 2018 | BSI Rating |
|---|---|---|---|---|
| 1 | 🇸🇬 Singapore | 90.5 | -1.9 | AAA+ |
| 2 | 🇨🇭 Switzerland | 89.9 | -0.3 | AAA+ |
| 3 | 🇳🇱 Netherlands | 89.6 | +1.9 | AAA+ |
| 4 | 🇩🇪 Germany | 88.2 | +3.5 | AAA |
| 5 | 🇱🇺 Luxembourg | 86.9 | +2.1 | AAA |
| 6 | 🇦🇪 U.A.E. | 86.6 | -1.9 | AAA |
| 7 | 🇫🇮 Finland | 86.4 | -1.0 | AAA |
| 8 | 🇯🇵 Japan | 85.8 | +1.9 | AAA |
| 9 | 🇺🇸 United States | 85.7 | +0.1 | AAA |
| 10 | 🇩🇰 Denmark | 85.6 | +2.6 | AAA |
The United States makes the top 10, but has fallen in the rankings since sitting at fourth place in 2014. That isn’t necessarily an indictment of the U.S. though — the country’s rating has improved somewhat, moving from AA+ to AAA over that same time period.
Turkey was one of the success stories of 2019. The country’s BSI score rebounded by nearly 50% after experiencing a large drop in 2018.


Markets
The European Stock Market: Attractive Valuations Offer Opportunities
On average, the European stock market has valuations that are nearly 50% lower than U.S. valuations. But how can you access the market?


European Stock Market: Attractive Valuations Offer Opportunities
Europe is known for some established brands, from L’Oréal to Louis Vuitton. However, the European stock market offers additional opportunities that may be lesser known.
The above infographic, sponsored by STOXX, outlines why investors may want to consider European stocks.
Attractive Valuations
Compared to most North American and Asian markets, European stocks offer lower or comparable valuations.
| Index | Price-to-Earnings Ratio | Price-to-Book Ratio |
|---|---|---|
| EURO STOXX 50 | 14.9 | 2.2 |
| STOXX Europe 600 | 14.4 | 2 |
| U.S. | 25.9 | 4.7 |
| Canada | 16.1 | 1.8 |
| Japan | 15.4 | 1.6 |
| Asia Pacific ex. China | 17.1 | 1.8 |
Data as of February 29, 2024. See graphic for full index names. Ratios based on trailing 12 month financials. The price to earnings ratio excludes companies with negative earnings.
On average, European valuations are nearly 50% lower than U.S. valuations, potentially offering an affordable entry point for investors.
Research also shows that lower price ratios have historically led to higher long-term returns.
Market Movements Not Closely Connected
Over the last decade, the European stock market had low-to-moderate correlation with North American and Asian equities.
The below chart shows correlations from February 2014 to February 2024. A value closer to zero indicates low correlation, while a value of one would indicate that two regions are moving in perfect unison.
| EURO STOXX 50 | STOXX EUROPE 600 | U.S. | Canada | Japan | Asia Pacific ex. China |
|
|---|---|---|---|---|---|---|
| EURO STOXX 50 | 1.00 | 0.97 | 0.55 | 0.67 | 0.24 | 0.43 |
| STOXX EUROPE 600 | 1.00 | 0.56 | 0.71 | 0.28 | 0.48 | |
| U.S. | 1.00 | 0.73 | 0.12 | 0.25 | ||
| Canada | 1.00 | 0.22 | 0.40 | |||
| Japan | 1.00 | 0.88 | ||||
| Asia Pacific ex. China | 1.00 |
Data is based on daily USD returns.
European equities had relatively independent market movements from North American and Asian markets. One contributing factor could be the differing sector weights in each market. For instance, technology makes up a quarter of the U.S. market, but health care and industrials dominate the broader European market.
Ultimately, European equities can enhance portfolio diversification and have the potential to mitigate risk for investors.
Tracking the Market
For investors interested in European equities, STOXX offers a variety of flagship indices:
| Index | Description | Market Cap |
|---|---|---|
| STOXX Europe 600 | Pan-regional, broad market | €10.5T |
| STOXX Developed Europe | Pan-regional, broad-market | €9.9T |
| STOXX Europe 600 ESG-X | Pan-regional, broad market, sustainability focus | €9.7T |
| STOXX Europe 50 | Pan-regional, blue-chip | €5.1T |
| EURO STOXX 50 | Eurozone, blue-chip | €3.5T |
Data is as of February 29, 2024. Market cap is free float, which represents the shares that are readily available for public trading on stock exchanges.
The EURO STOXX 50 tracks the Eurozone’s biggest and most traded companies. It also underlies one of the world’s largest ranges of ETFs and mutual funds. As of November 2023, there were €27.3 billion in ETFs and €23.5B in mutual fund assets under management tracking the index.
“For the past 25 years, the EURO STOXX 50 has served as an accurate, reliable and tradable representation of the Eurozone equity market.”
— Axel Lomholt, General Manager at STOXX
Partnering with STOXX to Track the European Stock Market
Are you interested in European equities? STOXX can be a valuable partner:
- Comprehensive, liquid and investable ecosystem
- European heritage, global reach
- Highly sophisticated customization capabilities
- Open architecture approach to using data
- Close partnerships with clients
- Part of ISS STOXX and Deutsche Börse Group
With a full suite of indices, STOXX can help you benchmark against the European stock market.
Learn how STOXX’s European indices offer liquid and effective market access.

-

 Economy2 days ago
Economic Growth Forecasts for G7 and BRICS Countries in 2024
The IMF has released its economic growth forecasts for 2024. How do the G7 and BRICS countries compare?
-

 Markets2 weeks ago
U.S. Debt Interest Payments Reach $1 Trillion
U.S. debt interest payments have surged past the $1 trillion dollar mark, amid high interest rates and an ever-expanding debt burden.
-

 United States2 weeks ago
Ranked: The Largest U.S. Corporations by Number of Employees
We visualized the top U.S. companies by employees, revealing the massive scale of retailers like Walmart, Target, and Home Depot.
-

 Markets2 weeks ago
The Top 10 States by Real GDP Growth in 2023
This graphic shows the states with the highest real GDP growth rate in 2023, largely propelled by the oil and gas boom.
-

 Markets2 weeks ago
Ranked: The World’s Top Flight Routes, by Revenue
In this graphic, we show the highest earning flight routes globally as air travel continued to rebound in 2023.
-

 Markets3 weeks ago
Ranked: The Most Valuable Housing Markets in America
The U.S. residential real estate market is worth a staggering $47.5 trillion. Here are the most valuable housing markets in the country.


-

 Debt1 week ago
How Debt-to-GDP Ratios Have Changed Since 2000
-
Markets2 weeks ago
Ranked: The World’s Top Flight Routes, by Revenue
-

 Countries2 weeks ago
Population Projections: The World’s 6 Largest Countries in 2075
-
Markets2 weeks ago
The Top 10 States by Real GDP Growth in 2023
-

 Demographics2 weeks ago
The Smallest Gender Wage Gaps in OECD Countries
-

 United States2 weeks ago
Where U.S. Inflation Hit the Hardest in March 2024
-

 Green2 weeks ago
Top Countries By Forest Growth Since 2001
-
United States2 weeks ago
Ranked: The Largest U.S. Corporations by Number of Employees