Technology
The Shrinking Trillion Dollar Market Cap Club
The Shrinking Trillion Dollar Club
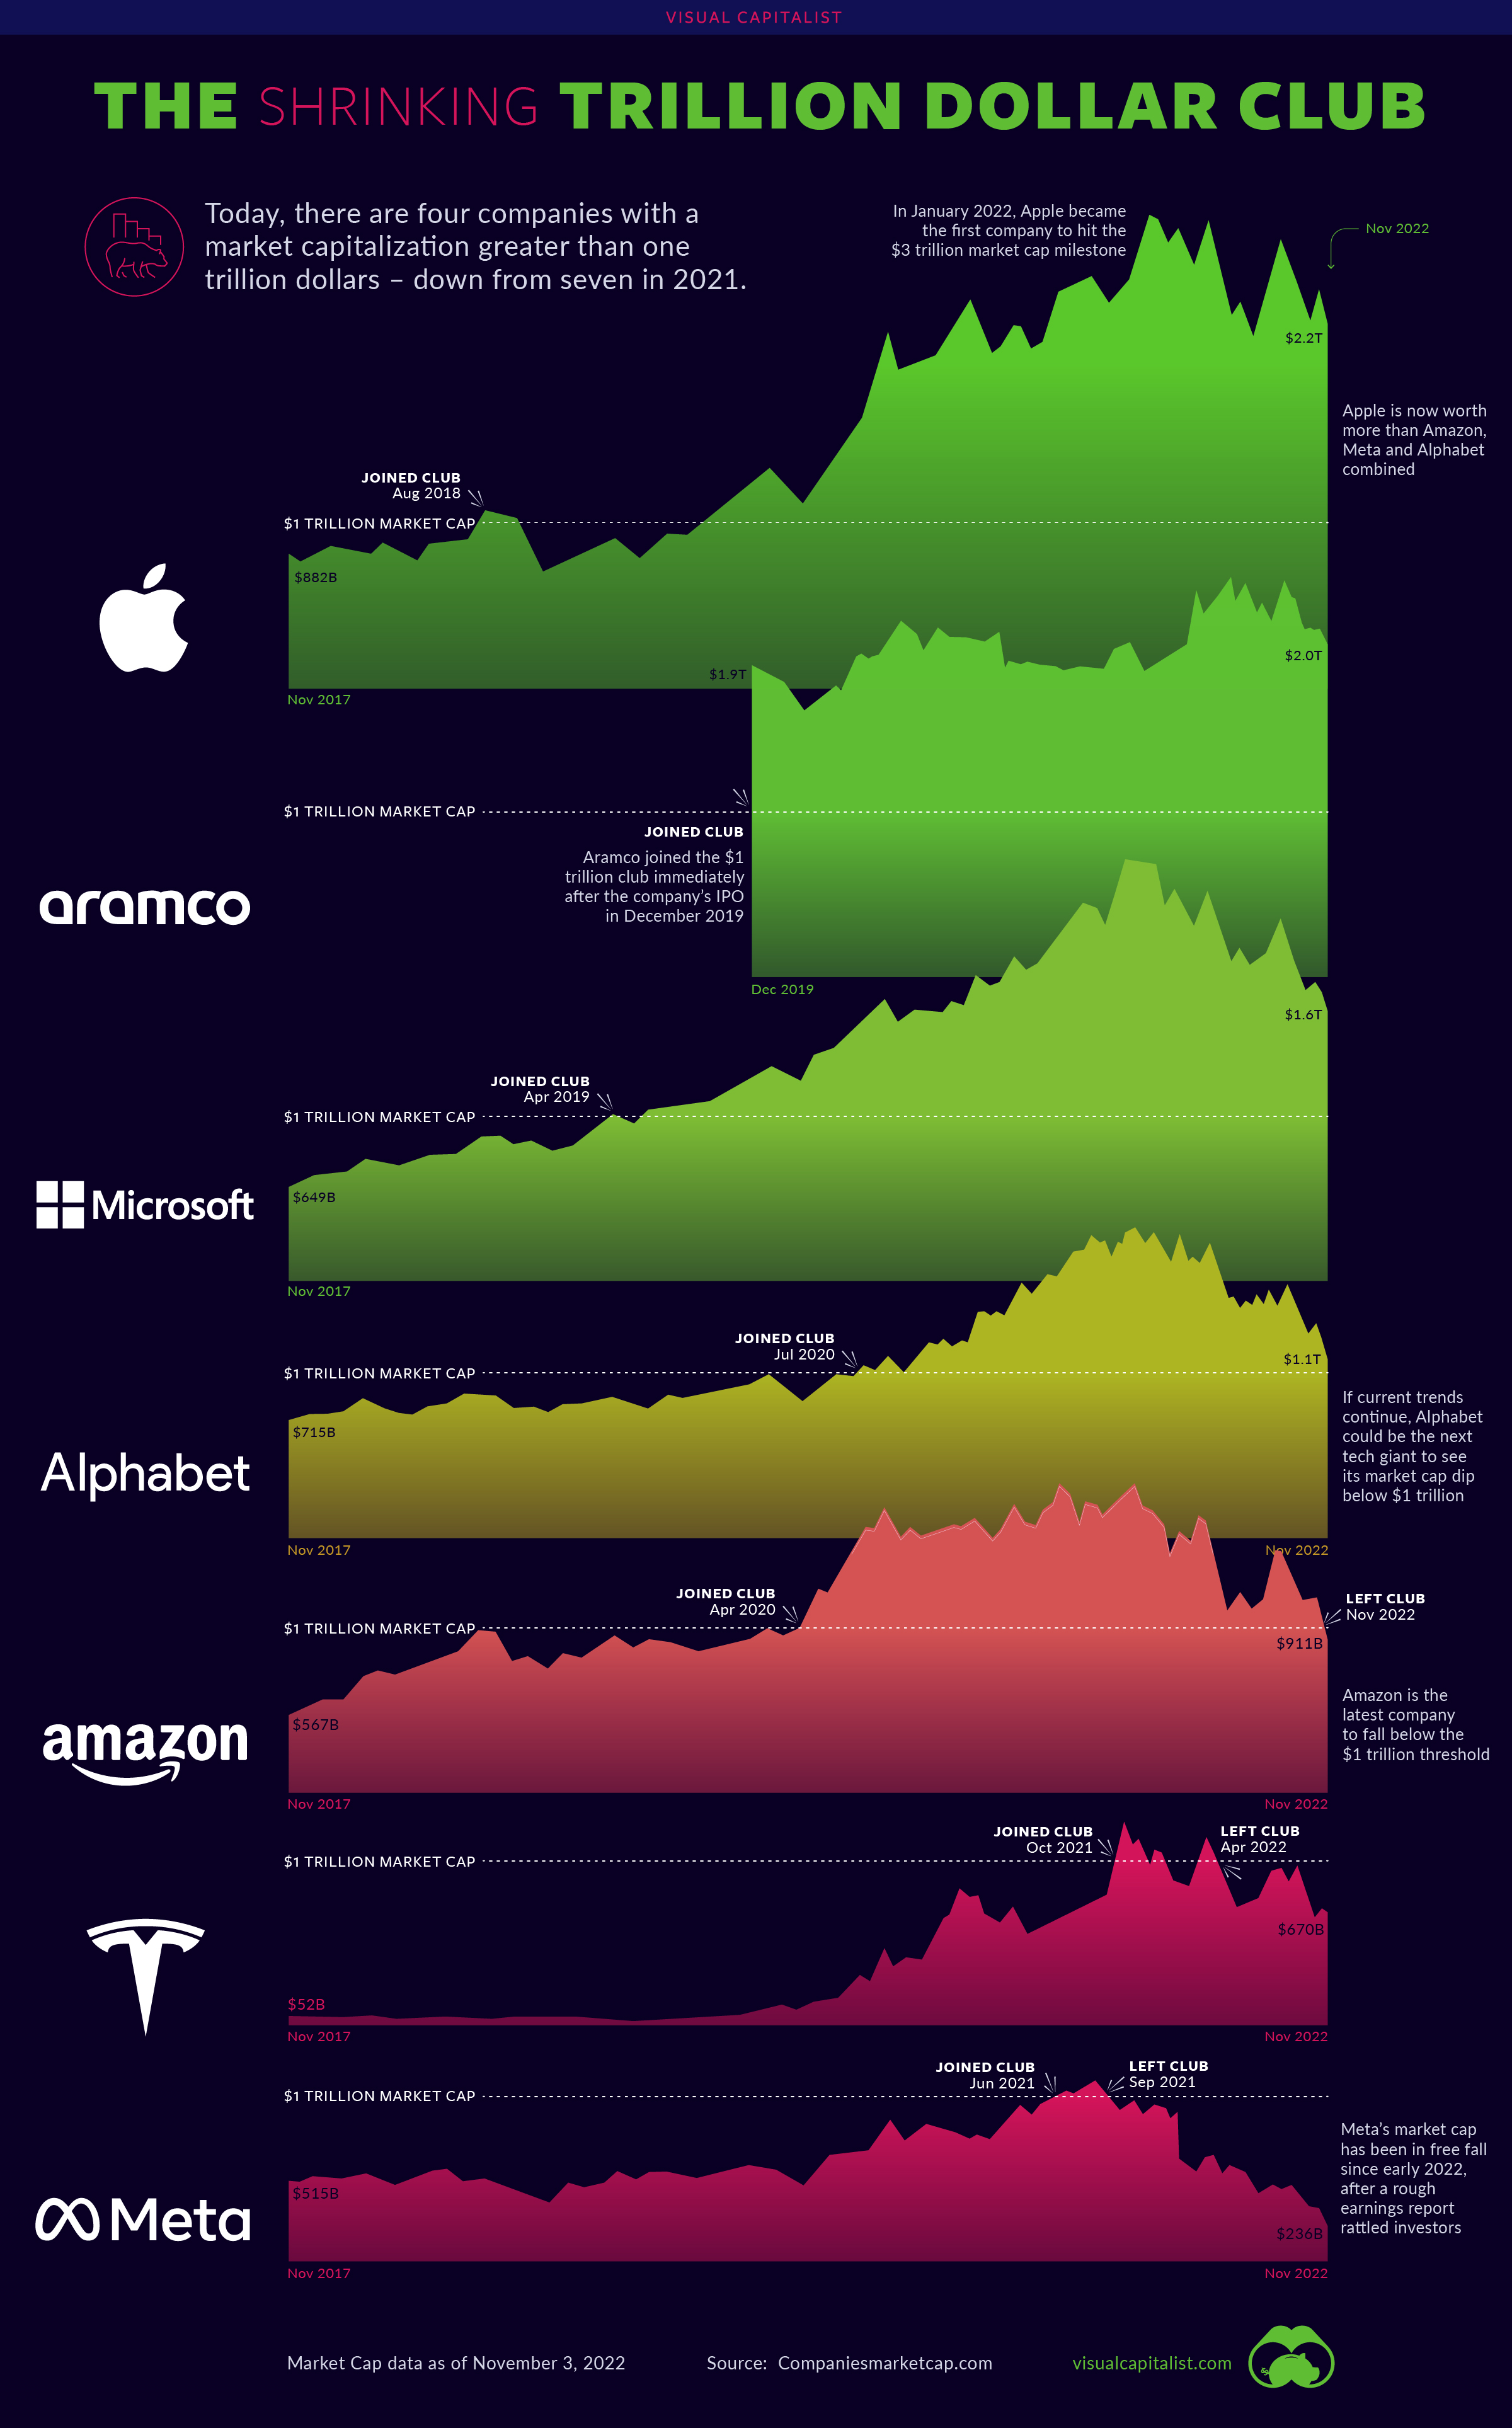
Aggressive tightening from the Federal Reserve has caused tech stocks to plummet back to Earth in 2022, and this has shaken up the membership of the trillion dollar market cap club.
Here are the four current members of this exclusive club:
| Company | Sector | Date Market Cap Hit $1T | Market Cap (Nov 3, 2022) |
|---|---|---|---|
| Apple (AAPL) | Tech | Aug 2, 2018 | $2.21 trillion |
| Aramco (2222) | Energy | Dec 11, 2019 | $2.01 trillion |
| Microsoft (MSFT) | Tech | Apr 25, 2019 | $1.60 trillion |
| Alphabet (GOOGL) | Tech | Jan 16, 2020 | $1.08 trillion |
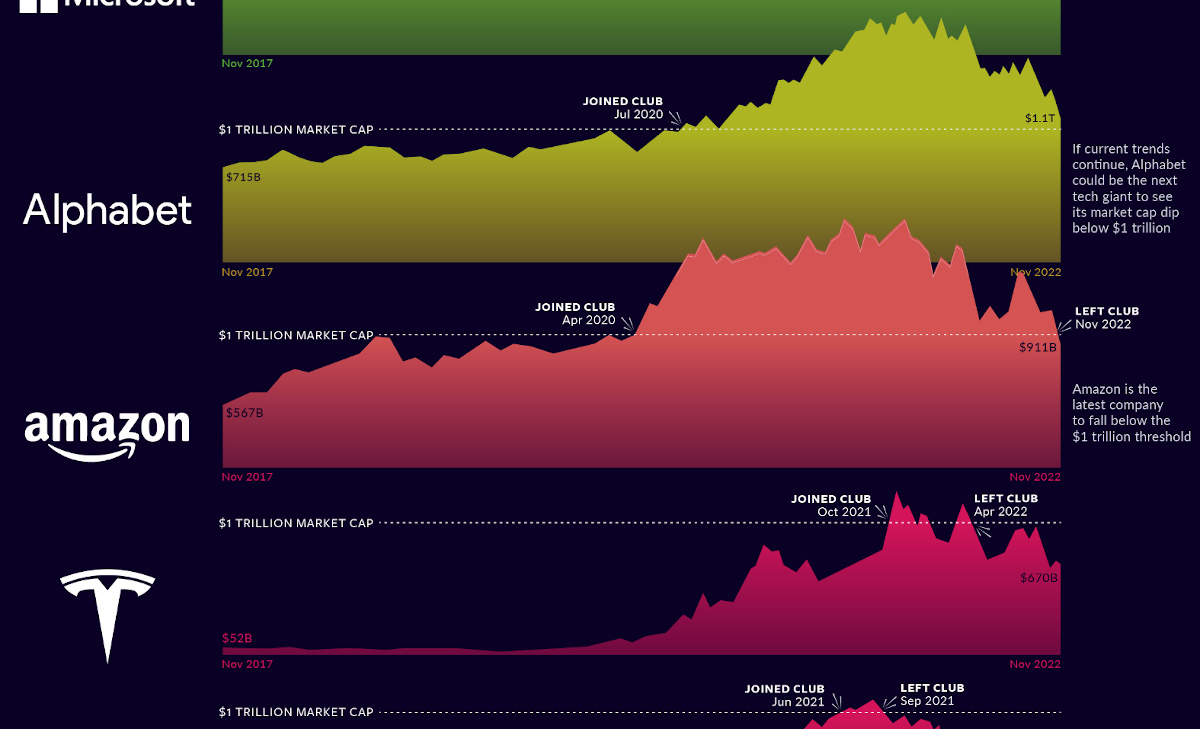
Apple, Microsoft, and Aramco are all still well above the $1 trillion mark for now, but Alphabet’s trajectory could take it out of this list if circumstances don’t change soon. Google has indicated that the decrease in crypto advertising has had a big impact on revenue, and ad budgets continue to be slashed as economic uncertainty continues.
Here are the three former members who have seen their market cap dip back below $1 trillion:
| Company | Sector | Date Market Cap Hit $1T | Market Cap (Nov 3, 2022) |
|---|---|---|---|
| Amazon (AMZN) | Tech/Retail | Sep 4, 2018 | $911 billion |
| Tesla (TSLA) | Automotive | Oct 25, 2021 | $675 billion |
| Meta (META) | Tech | Jun 28, 2021 | $236 billion |
Amazon recently became the latest company to fall below the 10-digit threshold. In response to a poorly received earnings report and forecasts for lighter spending this upcoming holiday season, the ecommerce giant has paused corporate hiring for the foreseeable future.
Though Tesla’s valuation has dipped in recent months, Elon Musk remains bullish on Tesla’s prospects, stating the company could eventually be “worth more than Apple and Saudi Aramco combined”. To his credit, Tesla reported record revenues last month.
Diverging Fortunes
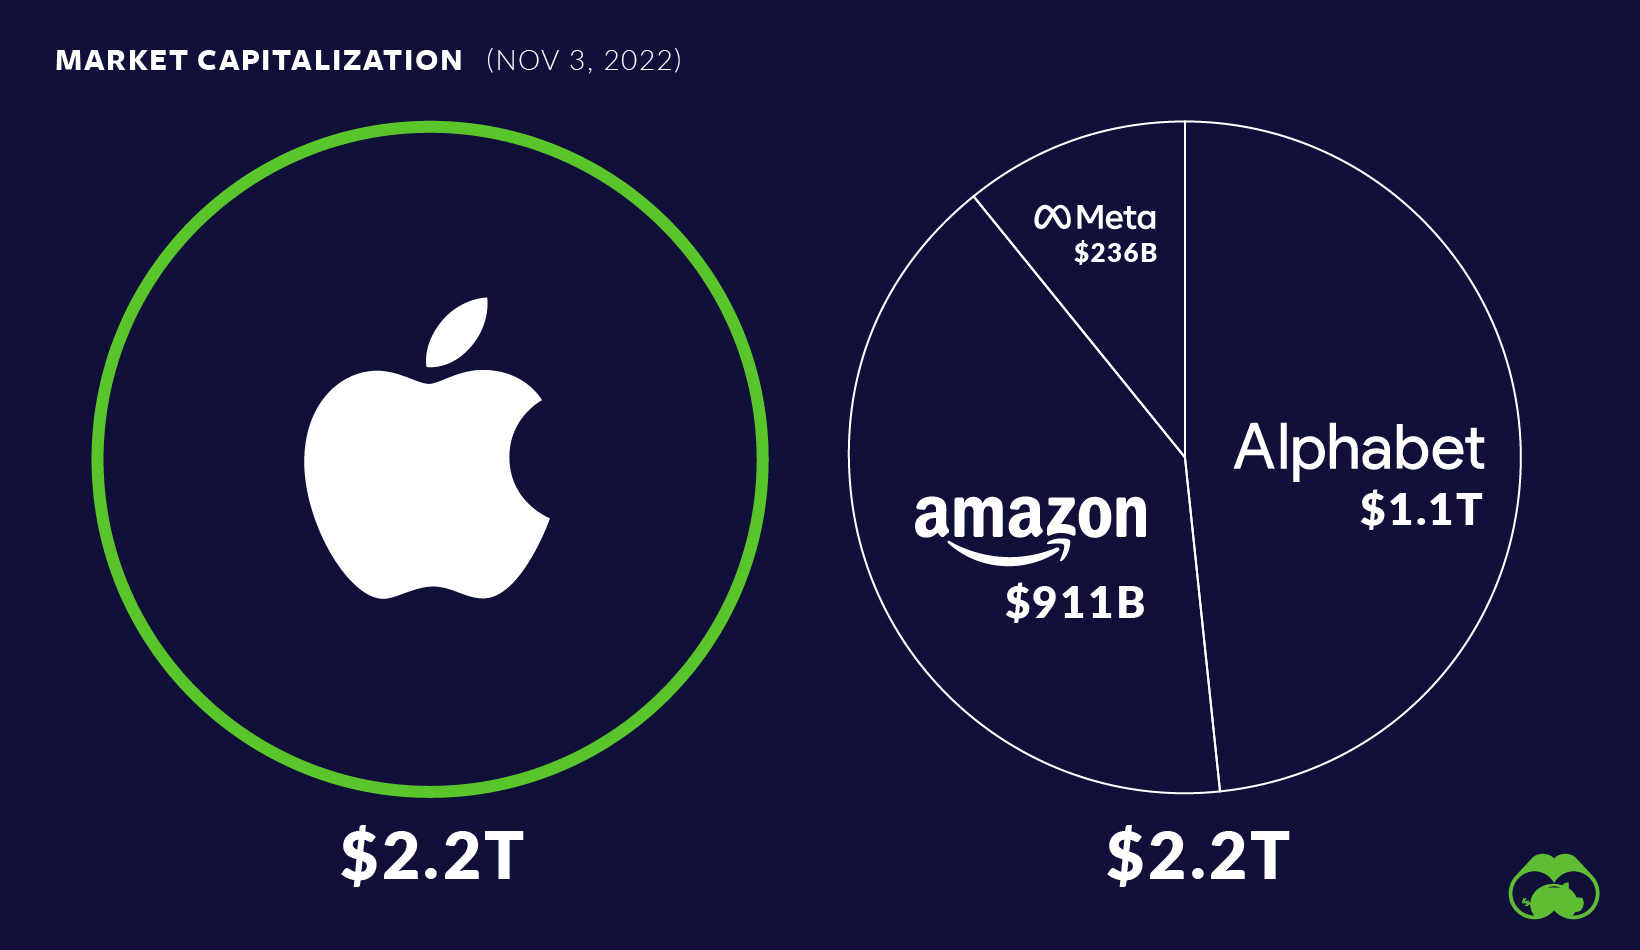
Though Apple is down nearly 20% from its peak, the company has faired better than its tech giant peers. In fact, Apple is now worth as much as Amazon, Meta, and Alphabet combined.
Meta, on the other hand, isn’t just going through tough times, it’s the worst performer in the entire S&P 500 this year so far.
Investors are bearish on Mark Zuckerberg’s expensive leap of faith that is the “metaverse” – a virtual reality world that people access via headsets (e.g. Meta Quest). It’s too early to tell whether Meta is on the forefront of the next digital revolution, or embarking on one of the most expensive tech flops in history.


Technology
All of the Grants Given by the U.S. CHIPS Act
Intel, TSMC, and more have received billions in subsidies from the U.S. CHIPS Act in 2024.


All of the Grants Given by the U.S. CHIPS Act
This was originally posted on our Voronoi app. Download the app for free on iOS or Android and discover incredible data-driven charts from a variety of trusted sources.
This visualization shows which companies are receiving grants from the U.S. CHIPS Act, as of April 25, 2024. The CHIPS Act is a federal statute signed into law by President Joe Biden that authorizes $280 billion in new funding to boost domestic research and manufacturing of semiconductors.
The grant amounts visualized in this graphic are intended to accelerate the production of semiconductor fabrication plants (fabs) across the United States.
Data and Company Highlights
The figures we used to create this graphic were collected from a variety of public news sources. The Semiconductor Industry Association (SIA) also maintains a tracker for CHIPS Act recipients, though at the time of writing it does not have the latest details for Micron.
| Company | Federal Grant Amount | Anticipated Investment From Company |
|---|---|---|
| 🇺🇸 Intel | $8,500,000,000 | $100,000,000,000 |
| 🇹🇼 TSMC | $6,600,000,000 | $65,000,000,000 |
| 🇰🇷 Samsung | $6,400,000,000 | $45,000,000,000 |
| 🇺🇸 Micron | $6,100,000,000 | $50,000,000,000 |
| 🇺🇸 GlobalFoundries | $1,500,000,000 | $12,000,000,000 |
| 🇺🇸 Microchip | $162,000,000 | N/A |
| 🇬🇧 BAE Systems | $35,000,000 | N/A |
BAE Systems was not included in the graphic due to size limitations
Intel’s Massive Plans
Intel is receiving the largest share of the pie, with $8.5 billion in grants (plus an additional $11 billion in government loans). This grant accounts for 22% of the CHIPS Act’s total subsidies for chip production.
From Intel’s side, the company is expected to invest $100 billion to construct new fabs in Arizona and Ohio, while modernizing and/or expanding existing fabs in Oregon and New Mexico. Intel could also claim another $25 billion in credits through the U.S. Treasury Department’s Investment Tax Credit.
TSMC Expands its U.S. Presence
TSMC, the world’s largest semiconductor foundry company, is receiving a hefty $6.6 billion to construct a new chip plant with three fabs in Arizona. The Taiwanese chipmaker is expected to invest $65 billion into the project.
The plant’s first fab will be up and running in the first half of 2025, leveraging 4 nm (nanometer) technology. According to TrendForce, the other fabs will produce chips on more advanced 3 nm and 2 nm processes.
The Latest Grant Goes to Micron
Micron, the only U.S.-based manufacturer of memory chips, is set to receive $6.1 billion in grants to support its plans of investing $50 billion through 2030. This investment will be used to construct new fabs in Idaho and New York.

-

 Education1 week ago
How Hard Is It to Get Into an Ivy League School?
-

 Technology2 weeks ago
Ranked: Semiconductor Companies by Industry Revenue Share
-

 Markets2 weeks ago
Ranked: The World’s Top Flight Routes, by Revenue
-

 Demographics2 weeks ago
Population Projections: The World’s 6 Largest Countries in 2075
-

 Markets2 weeks ago
The Top 10 States by Real GDP Growth in 2023
-

 Demographics2 weeks ago
The Smallest Gender Wage Gaps in OECD Countries
-

 Economy2 weeks ago
Where U.S. Inflation Hit the Hardest in March 2024
-

 Green2 weeks ago
Top Countries By Forest Growth Since 2001