Markets
Shifting Perspectives: The Top Financial Centers in the World
 Can I share this graphic?
 When do I need a license?
 Interested in this piece?
Shifting Perspectives: The World’s Top Financial Centers
Financial centers are catalysts for global growth, with tremendous economic influence.
Historically, the rise of nations has coincided with the emergence of robust financial hubs. From London towering in the 19th century, to New York City gaining dominance in the 20th century, broader economic shifts are at play.
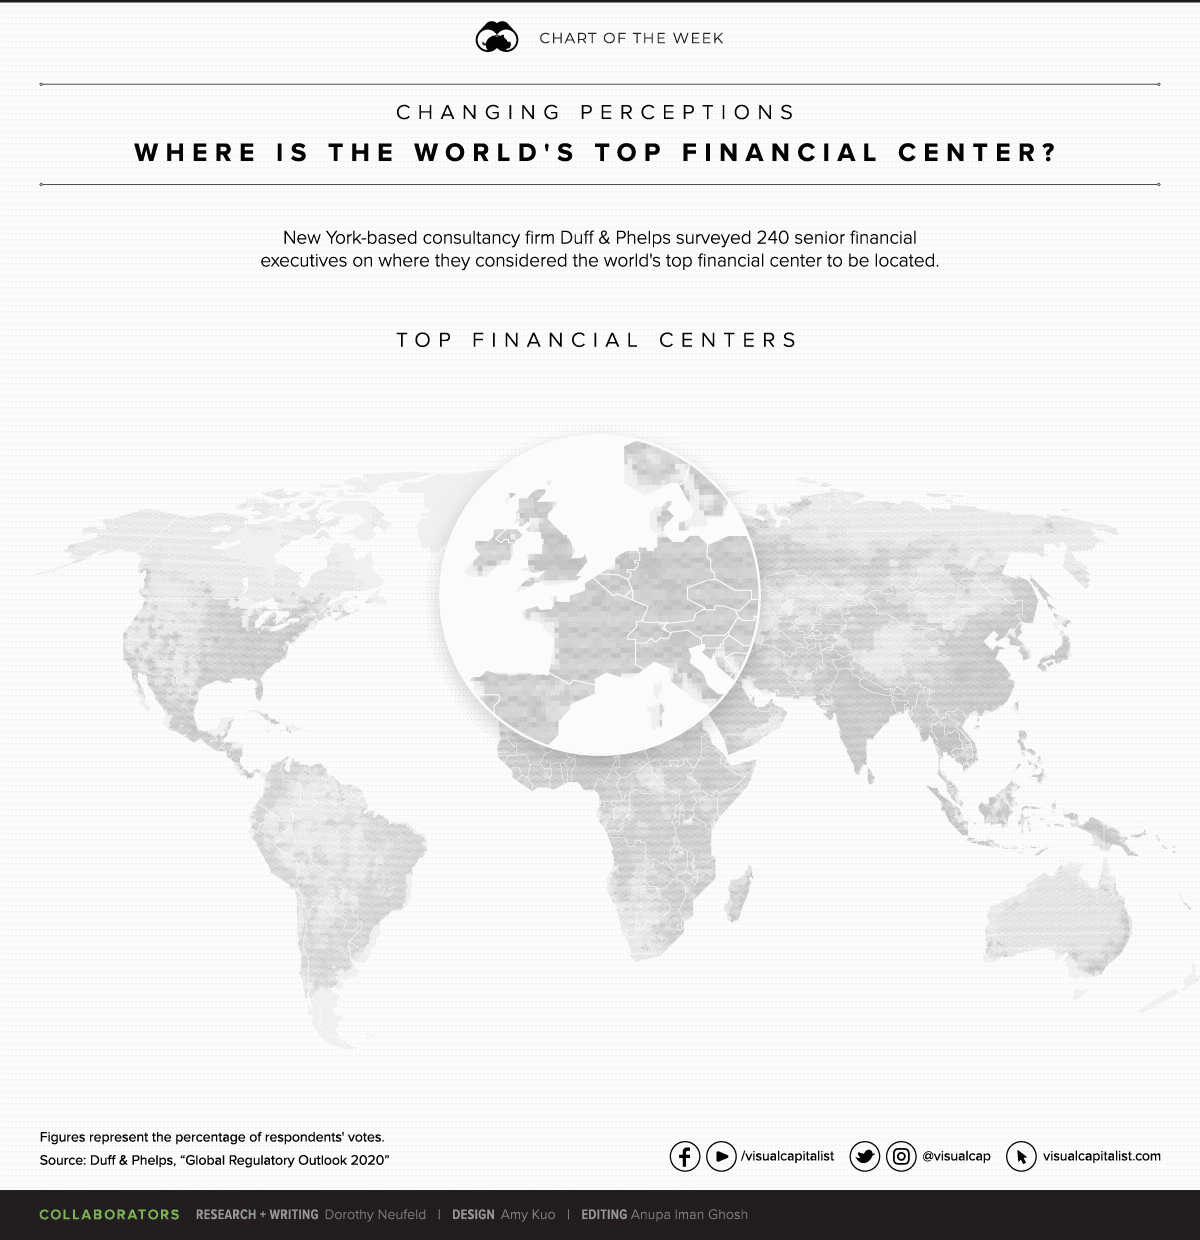
Today’s chart uses data from the Duff & Phelps Global Regulatory Outlook 2020, and it highlights changing perceptions on the world’s financial centers.
In total, 240 senior financial executives were surveyed—we take a look at their responses, as well as key factors that could impact perspectives across the wider financial landscape.
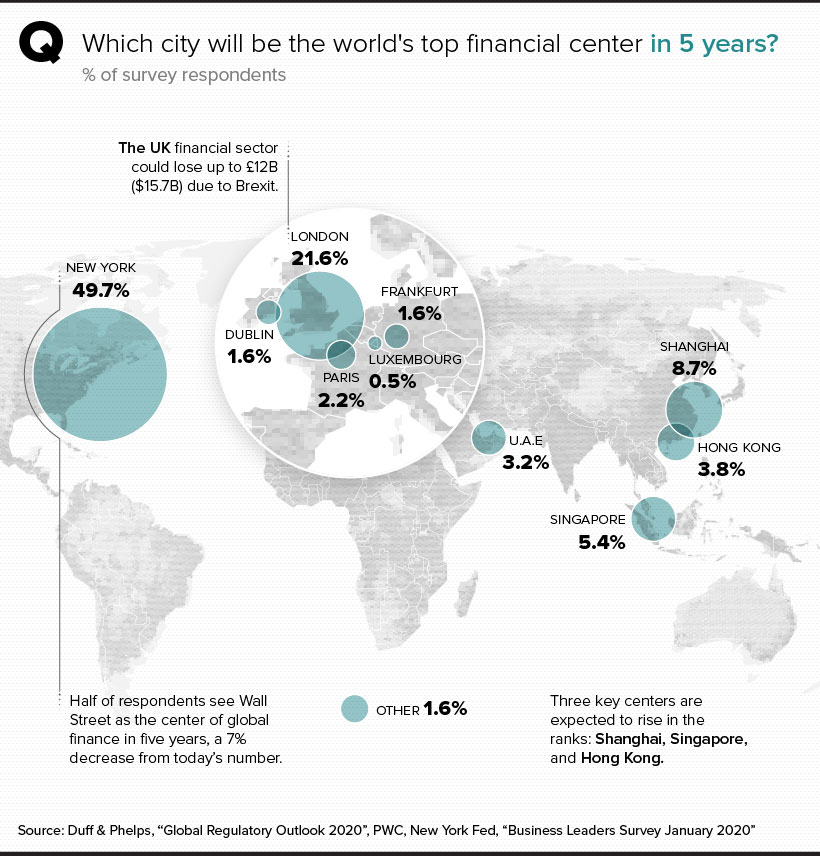
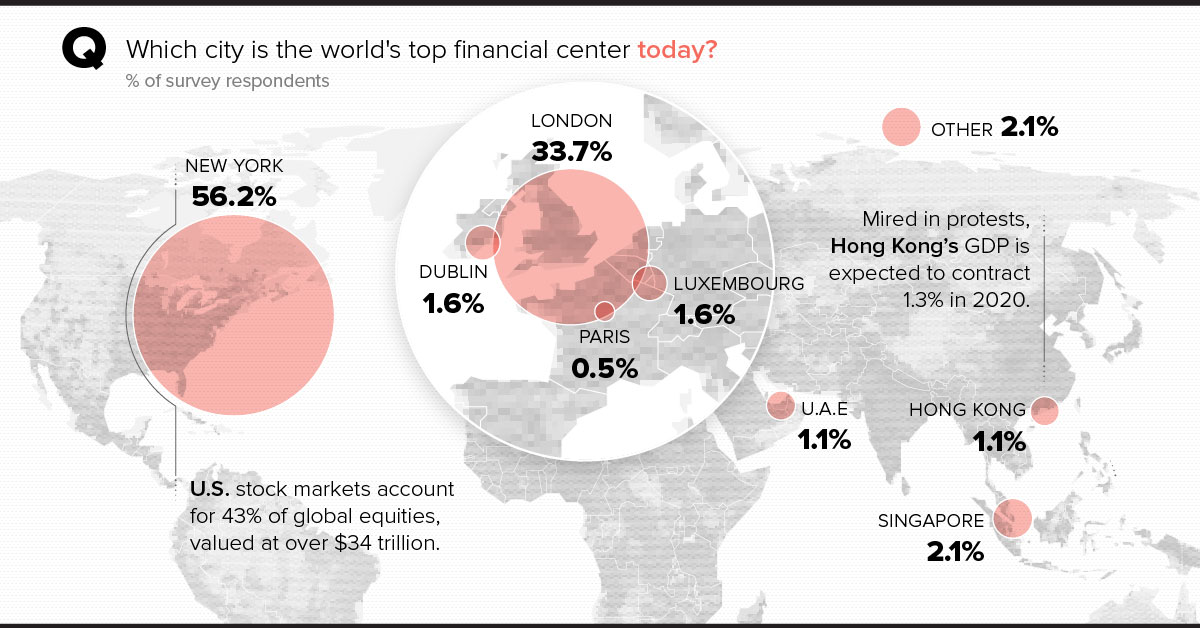
Financial Hubs Today
In the below graphic, you can see the percentage of respondents that voted for each city as the world’s preeminent financial center:
The Status Quo
New York and London are perceived to be at the helm of the financial world today.
New York City is home to the two largest stock exchanges in the world—and altogether, U.S. stock markets account for an impressive 43% of global equities, valued at over $34 trillion. Of course, New York is also home to many of the world’s investment banks, hedge funds, private equity firms, and global credit rating agencies.
Across the pond, the London Stock Exchange has surpassed $5 trillion in market capitalization, and the city has been a global financial hub since the LSE was founded more than 200 years ago.
Together, the United States and the United Kingdom account for 40% of the world’s financial exports. But while New York City and London have a foothold on international finance, other key financial centers have also established themselves.
Rising in the East
Singapore, accounting for 2.1% of the respondents’ vote, is considered the best place to conduct business in the world.
Meanwhile, seventh-ranked Hong Kong is regarded highly for its separation of executive, judiciary, and legislative powers.
Despite ongoing protests—which have resulted in an estimated $4 billion outflow of funds to Singapore—it maintains its status as a vital financial hub globally.
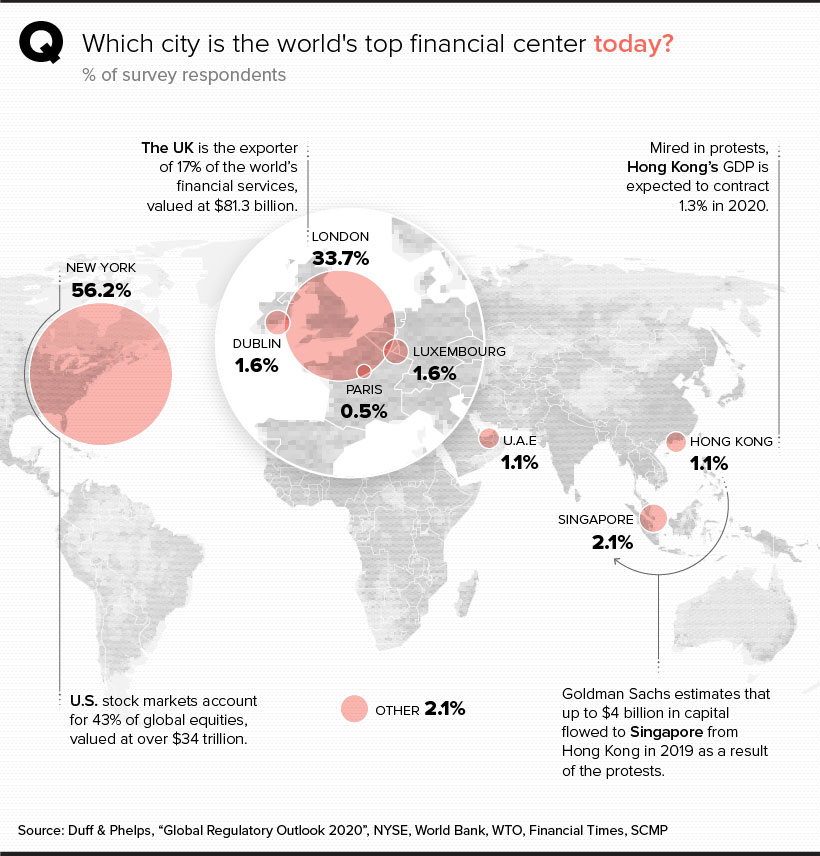
Where are Financial Centers Heading?
A number of core financial hubs are anticipated to underpin the future of finance.
Although New York maintains the top spot, some executives surveyed believe that the top financial center could shift to Shanghai, Singapore, or Hong Kong.
Growth in Asian Hubs
According to survey results, 8.7% of respondents said Shanghai is predicted to be the next global financial hub by 2025. Shanghai houses the largest stock exchange in China, the Shanghai Stock Exchange (SSE), and the SSE Composite tracks the performance of over 1,600 listings with $4.9 trillion in combined market capitalization.
Meanwhile, Singapore accounted for 5.4% of the respondents’ vote. Exporting $27.2 billion in financial services annually, Singapore’s economy has grown at an average clip of 7.7.% per year since the country’s independence, one of the highest growth rates in the world.
The Impending Impact of Brexit
After four tumultuous years, Britain’s departure from Europe took place on January 31, 2020.
Despite a long-awaited victory for the Conservative government, many experts are saying that economic prospects for the region look dim.
We now know that the economy will be between 2—6% smaller in 10 years than it would otherwise have been.
– Ray Burrell, Professor at Brunel University
The UK financial sector could lose over $15 billion (£12B) due to Brexit, and falling investment in the private sector may lead to wage pressure and layoffs.
On the flip side, 51% of UK businesses said that Brexit will be beneficial to business conditions.
A New Paradigm
Although the global financial sector is primarily influenced today by New York City and London, it seems that perceptions are shifting.
While both of these cities will maintain their reputations as massive financial capitals going forward, it’s also clear that hubs such as Singapore, Hong Kong, and Shanghai will be providing some stiff competition for capital.


Markets
The European Stock Market: Attractive Valuations Offer Opportunities
On average, the European stock market has valuations that are nearly 50% lower than U.S. valuations. But how can you access the market?


European Stock Market: Attractive Valuations Offer Opportunities
Europe is known for some established brands, from L’Oréal to Louis Vuitton. However, the European stock market offers additional opportunities that may be lesser known.
The above infographic, sponsored by STOXX, outlines why investors may want to consider European stocks.
Attractive Valuations
Compared to most North American and Asian markets, European stocks offer lower or comparable valuations.
| Index | Price-to-Earnings Ratio | Price-to-Book Ratio |
|---|---|---|
| EURO STOXX 50 | 14.9 | 2.2 |
| STOXX Europe 600 | 14.4 | 2 |
| U.S. | 25.9 | 4.7 |
| Canada | 16.1 | 1.8 |
| Japan | 15.4 | 1.6 |
| Asia Pacific ex. China | 17.1 | 1.8 |
Data as of February 29, 2024. See graphic for full index names. Ratios based on trailing 12 month financials. The price to earnings ratio excludes companies with negative earnings.
On average, European valuations are nearly 50% lower than U.S. valuations, potentially offering an affordable entry point for investors.
Research also shows that lower price ratios have historically led to higher long-term returns.
Market Movements Not Closely Connected
Over the last decade, the European stock market had low-to-moderate correlation with North American and Asian equities.
The below chart shows correlations from February 2014 to February 2024. A value closer to zero indicates low correlation, while a value of one would indicate that two regions are moving in perfect unison.
| EURO STOXX 50 | STOXX EUROPE 600 | U.S. | Canada | Japan | Asia Pacific ex. China |
|
|---|---|---|---|---|---|---|
| EURO STOXX 50 | 1.00 | 0.97 | 0.55 | 0.67 | 0.24 | 0.43 |
| STOXX EUROPE 600 | 1.00 | 0.56 | 0.71 | 0.28 | 0.48 | |
| U.S. | 1.00 | 0.73 | 0.12 | 0.25 | ||
| Canada | 1.00 | 0.22 | 0.40 | |||
| Japan | 1.00 | 0.88 | ||||
| Asia Pacific ex. China | 1.00 |
Data is based on daily USD returns.
European equities had relatively independent market movements from North American and Asian markets. One contributing factor could be the differing sector weights in each market. For instance, technology makes up a quarter of the U.S. market, but health care and industrials dominate the broader European market.
Ultimately, European equities can enhance portfolio diversification and have the potential to mitigate risk for investors.
Tracking the Market
For investors interested in European equities, STOXX offers a variety of flagship indices:
| Index | Description | Market Cap |
|---|---|---|
| STOXX Europe 600 | Pan-regional, broad market | €10.5T |
| STOXX Developed Europe | Pan-regional, broad-market | €9.9T |
| STOXX Europe 600 ESG-X | Pan-regional, broad market, sustainability focus | €9.7T |
| STOXX Europe 50 | Pan-regional, blue-chip | €5.1T |
| EURO STOXX 50 | Eurozone, blue-chip | €3.5T |
Data is as of February 29, 2024. Market cap is free float, which represents the shares that are readily available for public trading on stock exchanges.
The EURO STOXX 50 tracks the Eurozone’s biggest and most traded companies. It also underlies one of the world’s largest ranges of ETFs and mutual funds. As of November 2023, there were €27.3 billion in ETFs and €23.5B in mutual fund assets under management tracking the index.
“For the past 25 years, the EURO STOXX 50 has served as an accurate, reliable and tradable representation of the Eurozone equity market.”
— Axel Lomholt, General Manager at STOXX
Partnering with STOXX to Track the European Stock Market
Are you interested in European equities? STOXX can be a valuable partner:
- Comprehensive, liquid and investable ecosystem
- European heritage, global reach
- Highly sophisticated customization capabilities
- Open architecture approach to using data
- Close partnerships with clients
- Part of ISS STOXX and Deutsche Börse Group
With a full suite of indices, STOXX can help you benchmark against the European stock market.
Learn how STOXX’s European indices offer liquid and effective market access.

-

 Economy3 days ago
Economic Growth Forecasts for G7 and BRICS Countries in 2024
The IMF has released its economic growth forecasts for 2024. How do the G7 and BRICS countries compare?
-

 Markets2 weeks ago
U.S. Debt Interest Payments Reach $1 Trillion
U.S. debt interest payments have surged past the $1 trillion dollar mark, amid high interest rates and an ever-expanding debt burden.
-

 United States2 weeks ago
Ranked: The Largest U.S. Corporations by Number of Employees
We visualized the top U.S. companies by employees, revealing the massive scale of retailers like Walmart, Target, and Home Depot.
-

 Markets2 weeks ago
The Top 10 States by Real GDP Growth in 2023
This graphic shows the states with the highest real GDP growth rate in 2023, largely propelled by the oil and gas boom.
-

 Markets3 weeks ago
Ranked: The World’s Top Flight Routes, by Revenue
In this graphic, we show the highest earning flight routes globally as air travel continued to rebound in 2023.
-

 Markets3 weeks ago
Ranked: The Most Valuable Housing Markets in America
The U.S. residential real estate market is worth a staggering $47.5 trillion. Here are the most valuable housing markets in the country.


-

 Debt1 week ago
How Debt-to-GDP Ratios Have Changed Since 2000
-

 Countries2 weeks ago
Population Projections: The World’s 6 Largest Countries in 2075
-
Markets2 weeks ago
The Top 10 States by Real GDP Growth in 2023
-

 Demographics2 weeks ago
The Smallest Gender Wage Gaps in OECD Countries
-

 United States2 weeks ago
Where U.S. Inflation Hit the Hardest in March 2024
-

 Green2 weeks ago
Top Countries By Forest Growth Since 2001
-
United States2 weeks ago
Ranked: The Largest U.S. Corporations by Number of Employees
-

 Maps2 weeks ago
The Largest Earthquakes in the New York Area (1970-2024)