Markets
Visualizing the Coming Shift in Global Economic Power (2006-2036p)
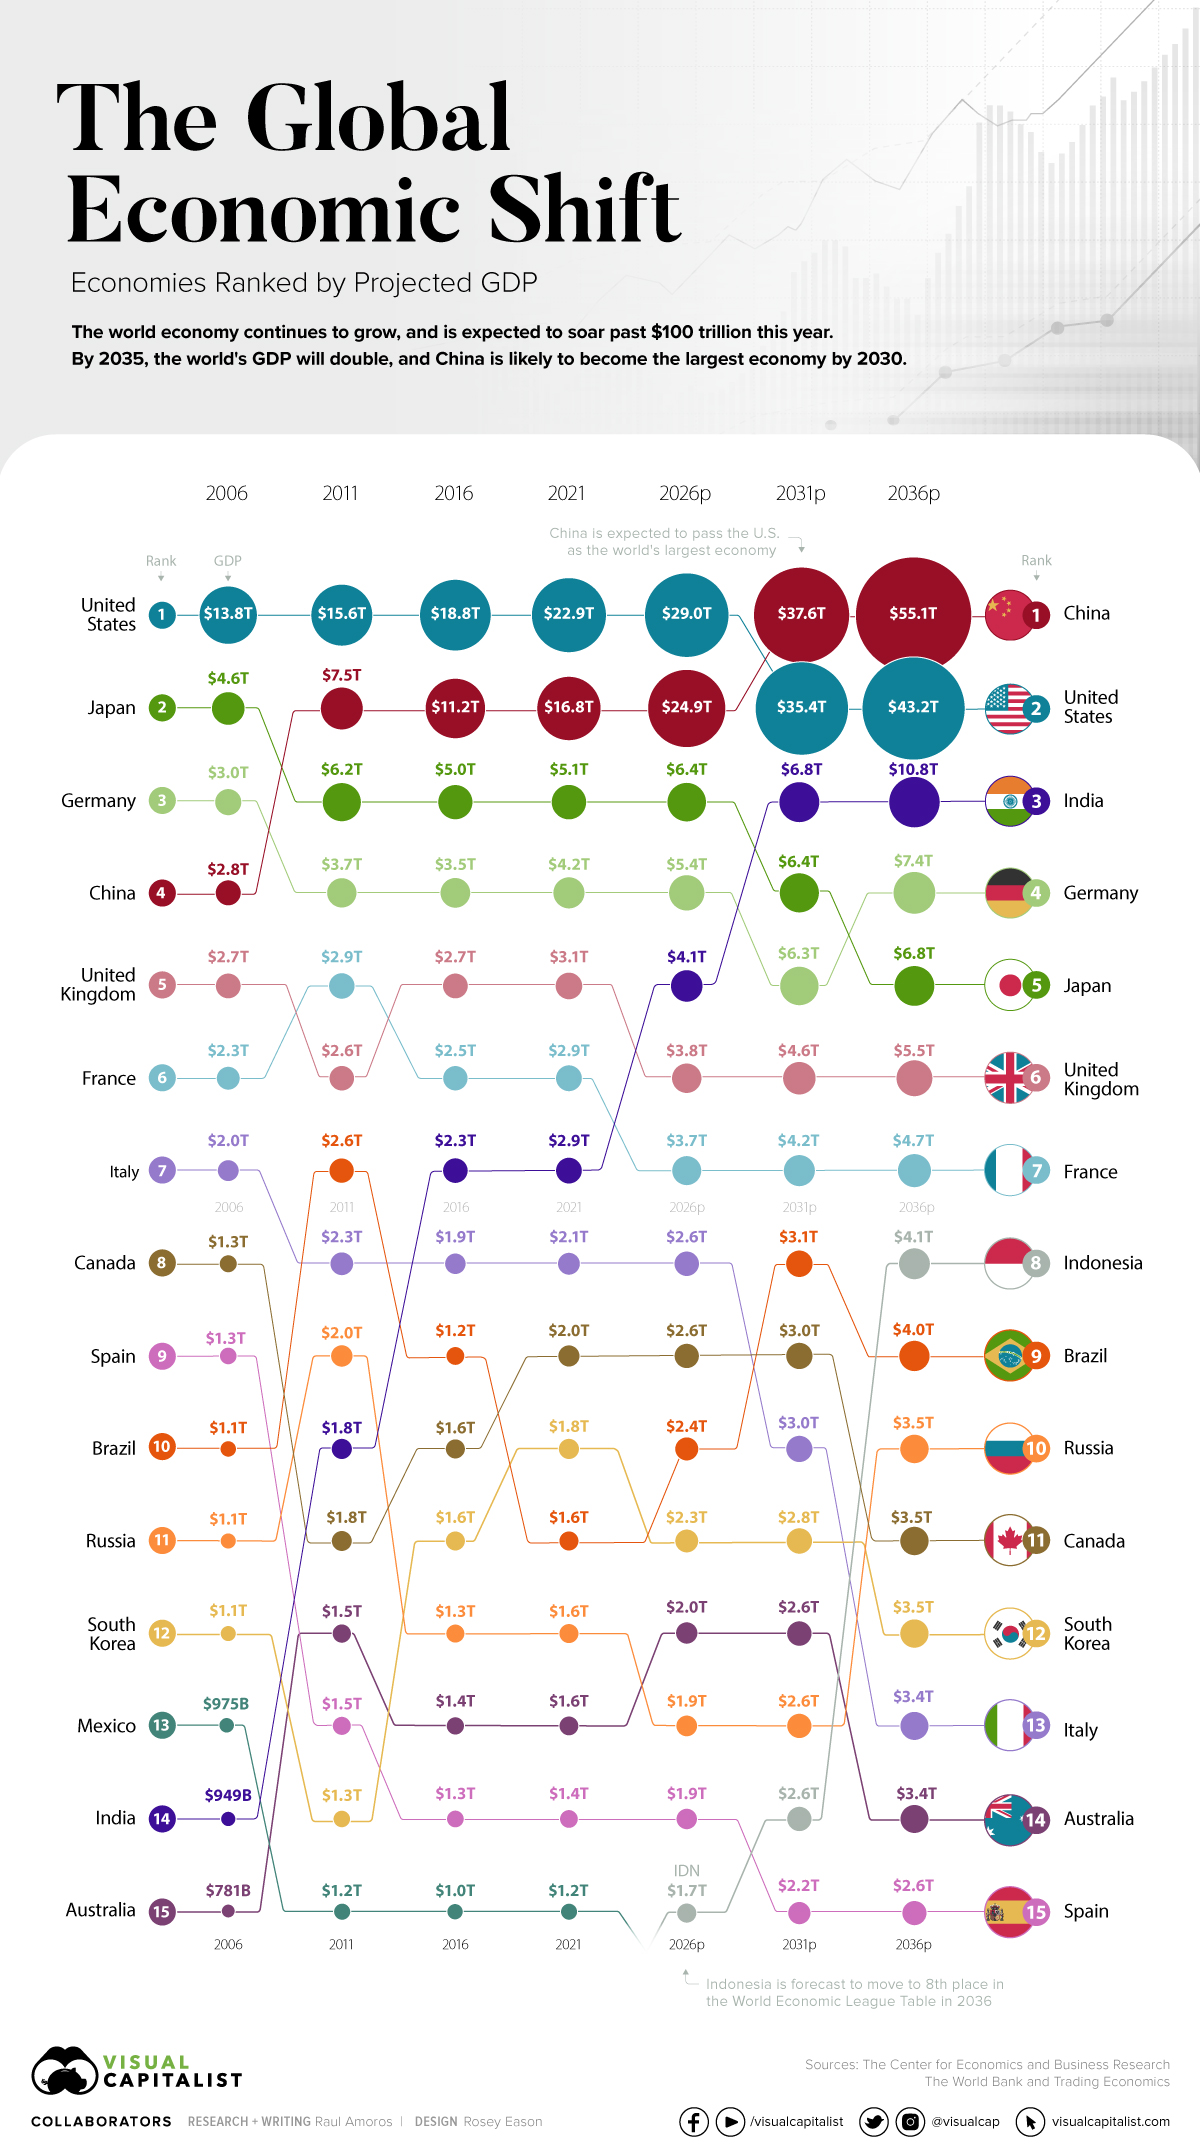


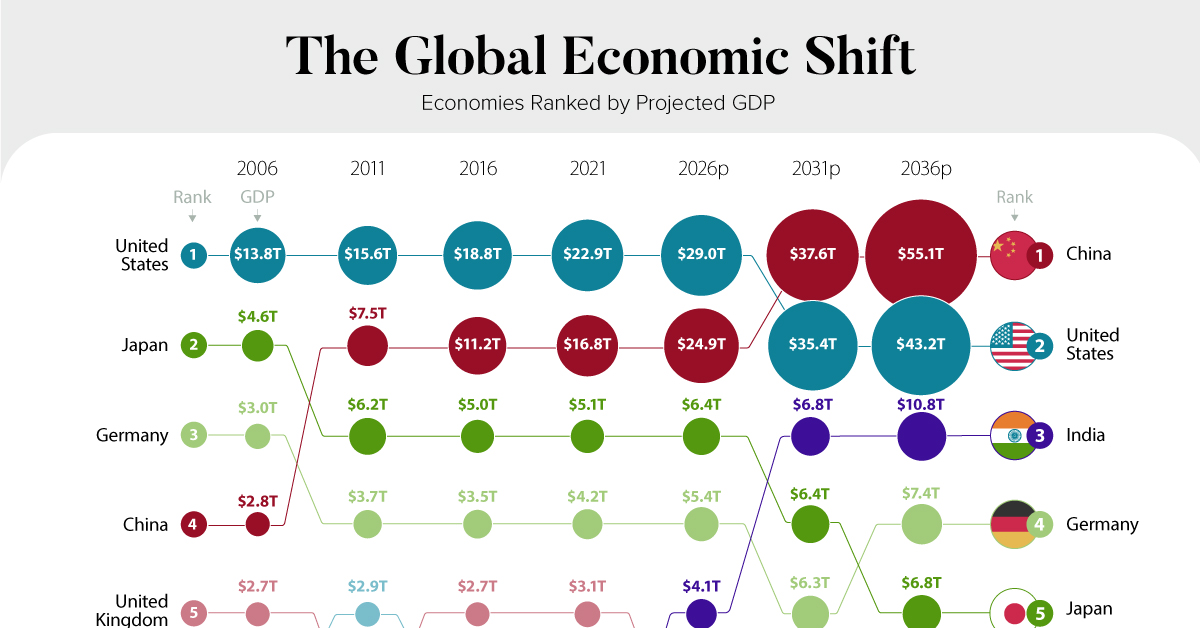
Visualizing the Shift in Global Economic Power
As the post-pandemic recovery chugs along, the global economy is set to see major changes in the coming decades. Most significantly, China is forecast to pass the United States to become the largest economy globally.
The world’s economic center has long been drifting from Europe and North America over to Asia. This global shift was kickstarted by lowered trade barriers and greater economic freedom, which attracted foreign direct investment (FDI). Another major driving factor was the improvements in infrastructure and communications, and a general increase in economic complexity in the region.
Our visualization uses data from the 13th edition of World Economic League Table 2022, a forecast published by the Center for Economics and Business Research (CEBR).
When Will China Become the Largest Economic Power?
China is expected to surpass the U.S. by the year 2030. A faster than expected recovery in the U.S. in 2021, and China’s struggles under the “Zero-COVID” policies have delayed the country taking the top spot by about two years.
China has maintained its positive GDP growth due to the stability provided by domestic demand. This has proven crucial in sustaining the country’s economic growth. China’s fiscal and economic policy had focused on this prior to the pandemic over fears of growing Western trade restrictions.
India is Primed for the #3 Spot
India is expected to become the third largest country in terms of GDP with $10.8 trillion projected in 2031.
Looking back, India had a GDP of just $949 billion in 2006. Fast forward to today and India’s GDP has more than tripled, reaching $3.1 trillion in 2022. Over the next 15 years, it’s expected to triple yet again. What is behind this impressive growth?
For starters, the country’s economy had a lot more room to improve than other nations. Demographics are also working in the country’s favor. While the median age in many mature economies is shooting up, India has a youthful workforce. In fact, India’s median age is a full 20 years lower than Japan, which is currently the third largest economy.
Over the last 60 years, the service industry has boomed to around 55% of India’s GDP. Telecommunications, software, and IT generate most of the revenue in this sector. IT alone produces 10% of the country’s GDP. India’s large tech-savvy, English-speaking workforce has proved attractive for international companies like Intel, Google, Meta, Microsoft, IBM, and many others, while the domestic startup scene continues to boom.
The Indian government is also pursuing “production-linked incentives” (i.e. subsidies) for multinational companies looking to diversify their production away from China. If these incentives prove successful, more of the world’s solar panels and smartphones will be produced within India’s borders.
How Will the Global Economy Look in 2031?
By the year 2031, there will be major changes in the global economic power rankings.
As we said before: China will have become the world’s largest economy in terms of GDP and India will be the world’s third largest economy. Let’s also take a look at the top 10 economies by 2031.
| Rank | Country | Region | Projected GDP in 2031 (in Trillions of USD) |
|---|---|---|---|
| 1 | 🇨🇳 China | Asia | $37.6 |
| 2 | 🇺🇸 United States | North America | $35.4 |
| 3 | 🇮🇳 India | Asia | $6.8 |
| 4 | 🇯🇵 Japan | Asia | $6.4 |
| 5 | 🇩🇪 Germany | Europe | $6.3 |
| 6 | 🇬🇧 United Kingdom | Europe | $4.6 |
| 7 | 🇫🇷 France | Europe | $4.2 |
| 8 | 🇧🇷 Brazil | South America | $3.1 |
| 9 | 🇨🇦 Canada | North America | $3.0 |
| 10 | 🇮🇹 Italy | Europe | $3.0 |
Out of the top five economies, three are located in Asia: China, India, and Japan—a clear demonstration of how economic power is shifting towards large population centers in Asia.
Europe will have four countries in the top 10: Germany, the United Kingdom, France, and Italy. From South America, only Brazil appears in the top 10.
Under these projections, Russia sits outside the top 10 in 2031. Of course, it remains to be seen how crushing sanctions and global isolation will affect the economic trajectory of the country.
Now, the big question. Is it inevitable that China takes the top spot in the global economy as predicted by this forecast? The truth is that nothing is guaranteed. Other projections have modeled reasonable alternative scenarios for China’s economy. A debt crisis, international isolation, or a shrinking population could keep China’s economy in second place for longer than expected.


Markets
Visualizing Global Inflation Forecasts (2024-2026)
Here are IMF forecasts for global inflation rates up to 2026, highlighting a slow descent of price pressures amid resilient global growth.


Visualizing Global Inflation Forecasts (2024-2026)
Global inflation rates are gradually descending, but progress has been slow.
Today, the big question is if inflation will decline far enough to trigger easing monetary policy. So far, the Federal Reserve has held rates for nine months amid stronger than expected core inflation, which excludes volatile energy and food prices.
Yet looking further ahead, inflation forecasts from the International Monetary Fund (IMF) suggest that inflation will decline as price pressures ease, but the path of disinflation is not without its unknown risks.
This graphic shows global inflation forecasts, based on data from the April 2024 IMF World Economic Outlook.
Get the Key Insights of the IMF’s World Economic Outlook
Want a visual breakdown of the insights from the IMF’s 2024 World Economic Outlook report?
This visual is part of a special dispatch of the key takeaways exclusively for VC+ members.
Get the full dispatch of charts by signing up to VC+.
The IMF’s Inflation Outlook
Below, we show the IMF’s latest projections for global inflation rates through to 2026:
| Year | Global Inflation Rate (%) | Advanced Economies Inflation Rate (%) | Emerging Market and Developing Economies Inflation Rate (%) |
|---|---|---|---|
| 2019 | 3.5 | 1.4 | 5.1 |
| 2020 | 3.2 | 0.7 | 5.2 |
| 2021 | 4.7 | 3.1 | 5.9 |
| 2022 | 8.7 | 7.3 | 9.8 |
| 2023 | 6.8 | 4.6 | 8.3 |
| 2024 | 5.9 | 2.6 | 8.3 |
| 2025 | 4.5 | 2.0 | 6.2 |
| 2026 | 3.7 | 2.0 | 4.9 |
After hitting a peak of 8.7% in 2022, global inflation is projected to fall to 5.9% in 2024, reflecting promising inflation trends amid resilient global growth.
While inflation has largely declined due to falling energy and goods prices, persistently high services inflation poses challenges to mitigating price pressures. In addition, the IMF highlights the potential risk of an escalating conflict in the Middle East, which could lead to energy price shocks and higher shipping costs.
These developments could negatively affect inflation scenarios and prompt central banks to adopt tighter monetary policies. Overall, by 2026, global inflation is anticipated to decline to 3.7%—still notably above the 2% target set by several major economies.
Adding to this, we can see divergences in the path of inflation between advanced and emerging economies. While affluent nations are forecast to see inflation edge closer to the 2% target by 2026, emerging economies are projected to have inflation rates reach 4.9%—falling closer to their pre-pandemic averages.
Get the Full Analysis of the IMF’s Outlook on VC+
This visual is part of an exclusive special dispatch for VC+ members which breaks down the key takeaways from the IMF’s 2024 World Economic Outlook.
For the full set of charts and analysis, sign up for VC+.

-

 Culture7 days ago
The World’s Top Media Franchises by All-Time Revenue
-

 Science2 weeks ago
Visualizing the Average Lifespans of Mammals
-

 Brands2 weeks ago
How Tech Logos Have Evolved Over Time
-

 Energy2 weeks ago
Ranked: The Top 10 EV Battery Manufacturers in 2023
-

 Demographics2 weeks ago
Countries With the Largest Happiness Gains Since 2010
-

 Economy2 weeks ago
VC+: Get Our Key Takeaways From the IMF’s World Economic Outlook
-

 Demographics2 weeks ago
The Countries That Have Become Sadder Since 2010
-

 Money1 week ago
Charted: Who Has Savings in This Economy?