Datastream
Visualizing Gold ETFs’ Record Inflows of 2020


The Briefing
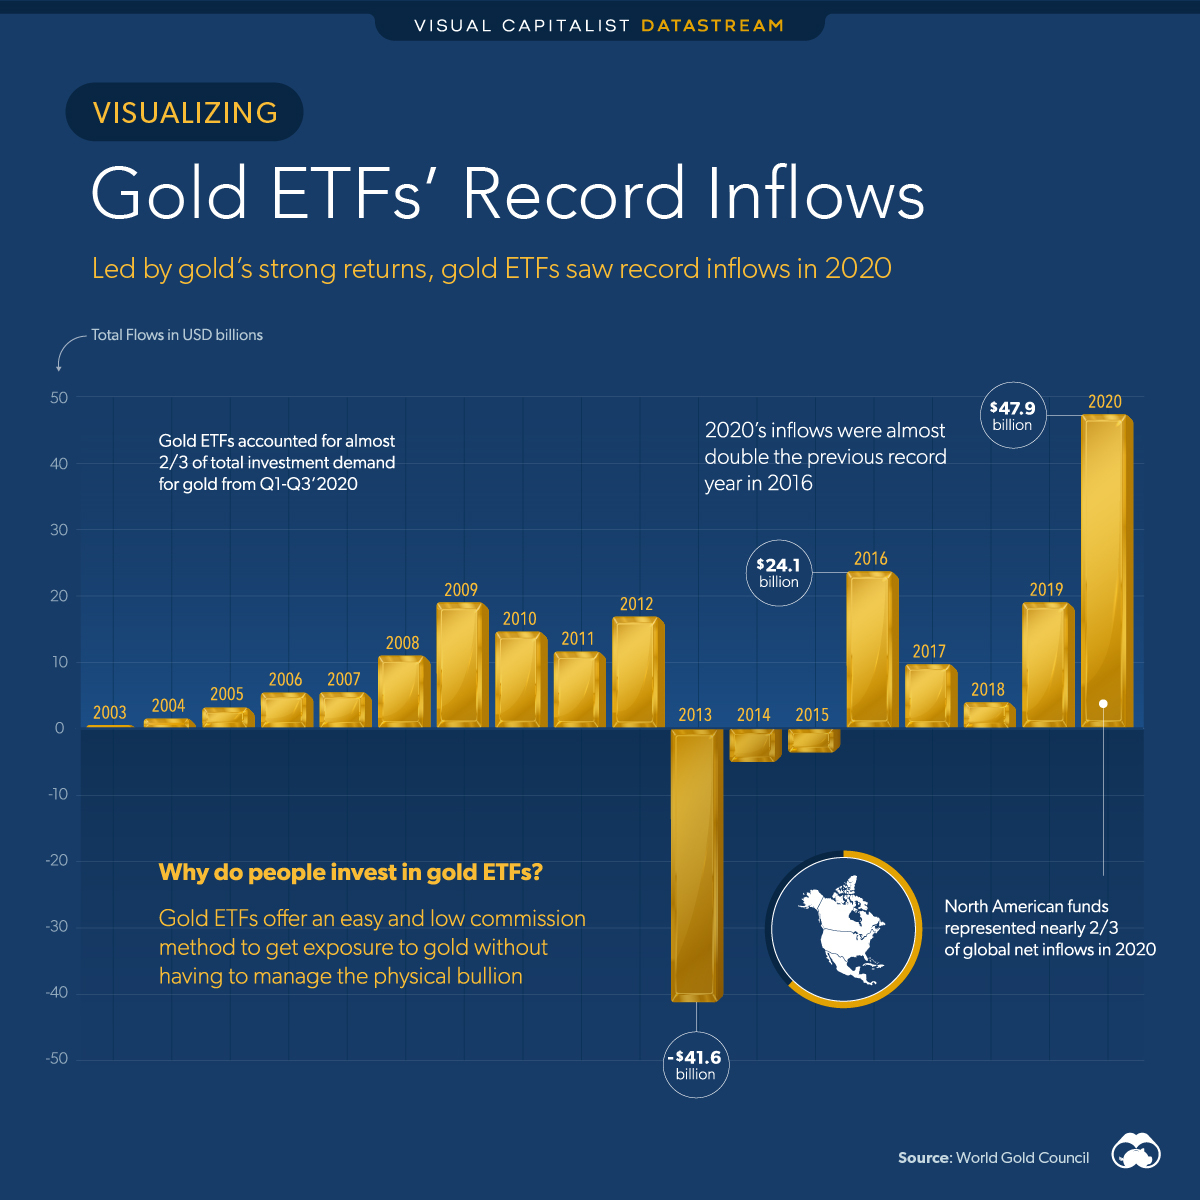
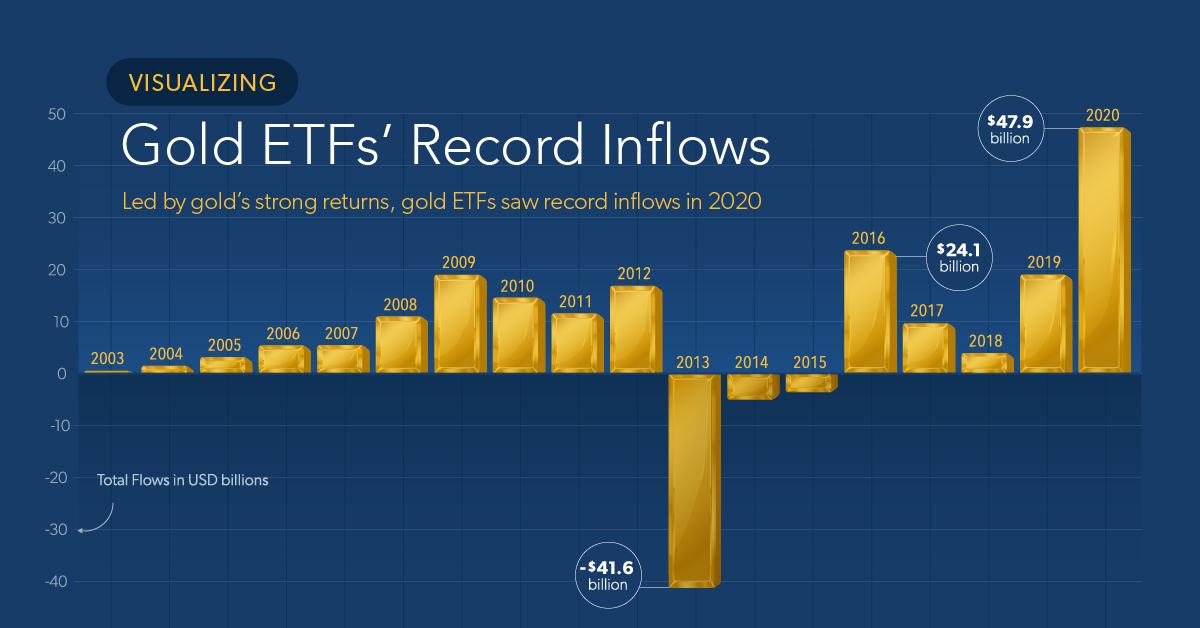
- Gold ETF inflows in 2020 amounted to $47.9B (877.1t), more than doubling 2019’s inflows
- This marks the fifth straight year of inflows into gold ETFs, almost doubling the previous record inflows in 2016 of $24.1B (541.1t)
Gold ETFs See Record Inflows in 2020
Gold had a strong year with 25% returns, and gold ETF inflows followed, reaching a new record high of $47.9 billion in 2020.
Gold-backed and gold ETFs have increasingly become a vital part of the gold investment market, making up around two-thirds of global net inflows for investment demand in the precious metal.
While gold set new all-time highs around $2,075/oz in 2020, gold ETF inflows ($47.5B) almost doubled the previous record-year of inflows (2016, $24.1B), and eclipsed 2013’s record year of outflows ($-41.6B).
| Year | Total Flows in Tonnes | Total Flows in USD |
|---|---|---|
| 2003 | 42.5t | $0.1B |
| 2004 | 125.4t | $1.5B |
| 2005 | 218.9t | $3.3B |
| 2006 | 260.2t | $4.8B |
| 2007 | 251.5t | $5.6B |
| 2008 | 311.0t | $11.2B |
| 2009 | 649.0t | $19.3B |
| 2010 | 388.6t | $14.8B |
| 2011 | 260.0t | $11.8B |
| 2012 | 251.9t | $17.1B |
| 2013 | -887.1t | $-41.6B |
| 2014 | -149.3t | $-5.0B |
| 2015 | -129.3t | $-3.5B |
| 2016 | 541.1t | $24.1B |
| 2017 | 271.6t | $9.8B |
| 2018 | 70.1t | $4.0B |
| 2019 | 398.3t | $19.1B |
| 2020 | 877.1t | $47.9B |
Gold futures also saw increased participation in 2020, with aggregate open interest reaching yearly record-highs of $120.9B as investors and traders sought gold exposure.
North American Funds Represent Most Gold ETF Inflows
In terms of regionality, North American funds accounted for almost two-thirds of global net inflows from Q1-Q3’2020, reaching a total inflow of $31.9B for the year.
SPDR Gold Shares (GLD), the first U.S. gold ETF launched in 2004, made up the majority of North American inflows at $15.4B. Interestingly, this one ETF alone eclipsed Europe’s entire inflows for 2020 ($13.3B).
While Gold ETFs in Asia only reached $1.9B last year, their holdings saw the greatest percentage increase of all regions (49%) with seven new Chinese funds listed in 2020.
Gold ETFs are Driving Gold Investment Demand
Although flows turned negative in November ($-6.8B) and December ($-2.2B) of 2020, Gold ETF flows have returned positive for the first couple of weeks of 2021, with a $2.1B inflow as of Jan 15, 2021.
This return to positive ETF flows came as gold fell more than 5% from its $1,950 highs reached in early January. This could be a sign of gold ETF investors buying the dip, as gold potentially begins to turn upwards for the final two weeks of January.
Since gold ETFs make up such a large part of gold investment demand, keeping an eye on ETF flows can offer insight into where the precious metal might be headed.
»If you found this article interesting, you might enjoy this post on the ETFs: Visualizing the Expanse of the ETF Universe
Where does this data come from?
Source: World Gold Council
Details: The World Gold Council aggregates data from Bloomberg, ICE Benchmark Administration, and company filings.


Datastream
Can You Calculate Your Daily Carbon Footprint?
Discover how the average person’s carbon footprint impacts the environment and learn how carbon credits can offset your carbon footprint.


The Briefing
- A person’s carbon footprint is substantial, with activities such as food consumption creating as much as 4,500 g of CO₂ emissions daily.
- By purchasing carbon credits from Carbon Streaming Corporation, you can offset your own emissions and fund positive climate action.
Your Everyday Carbon Footprint
While many large businesses and countries have committed to net-zero goals, it is essential to acknowledge that your everyday activities also contribute to global emissions.
In this graphic, sponsored by Carbon Streaming Corporation, we will explore how the choices we make and the products we use have a profound impact on our carbon footprint.
Carbon Emissions by Activity
Here are some of the daily activities and products of the average person and their carbon footprint, according to Clever Carbon.
| Household Activities & Products | CO2 Emissions (g) |
|---|---|
| 💡 Standard Light Bulb (100 watts, four hours) | 172 g |
| 📱 Mobile Phone Use (195 minutes per day)* | 189 g |
| 👕 Washing Machine (0.63 kWh) | 275 g |
| 🔥 Electric Oven (1.56 kWh) | 675 g |
| ♨️ Tumble Dryer (2.5 kWh) | 1,000 g |
| 🧻 Toilet Roll (2 ply) | 1,300 g |
| 🚿 Hot Shower (10 mins) | 2,000 g |
| 🚙 Daily Commute (one hour, by car) | 3,360 g |
| 🍽️ Average Daily Food Consumption (three meals of 600 calories) | 4,500 g |
| *Phone use based on yearly use of 69kg per the source, Reboxed | |
Your choice of transportation plays a crucial role in determining your carbon footprint. For instance, a 15 km daily commute to work on public transport generates an average of 1,464 g of CO₂ emissions. Compared to 3,360 g—twice the volume for a journey the same length by car.
By opting for more sustainable modes of transport, such as cycling, walking, or public transportation, you can significantly reduce your carbon footprint.
Addressing Your Carbon Footprint
One way to compensate for your emissions is by purchasing high-quality carbon credits.
Carbon credits are used to help fund projects that avoid, reduce or remove CO₂ emissions. This includes nature-based solutions such as reforestation and improved forest management, or technology-based solutions such as the production of biochar and carbon capture and storage (CCS).
While carbon credits offer a potential solution for individuals to help reduce global emissions, public awareness remains a significant challenge. A BCG-Patch survey revealed that only 34% of U.S. consumers are familiar with carbon credits, and only 3% have purchased them in the past.
About Carbon Streaming
By financing the creation or expansion of carbon projects, Carbon Streaming Corporation secures the rights to future carbon credits generated by these sustainable projects. You can then purchase these carbon credits to help fund climate solutions around the world and compensate for your own emissions.
Ready to get involved?
>> Learn more about purchasing carbon credits at Carbon Streaming

-

 Mining1 week ago
Gold vs. S&P 500: Which Has Grown More Over Five Years?
-

 Markets2 weeks ago
Ranked: The Most Valuable Housing Markets in America
-

 Money2 weeks ago
Which States Have the Highest Minimum Wage in America?
-

 AI2 weeks ago
Ranked: Semiconductor Companies by Industry Revenue Share
-

 Markets2 weeks ago
Ranked: The World’s Top Flight Routes, by Revenue
-

 Countries2 weeks ago
Population Projections: The World’s 6 Largest Countries in 2075
-

 Markets2 weeks ago
The Top 10 States by Real GDP Growth in 2023
-

 Demographics2 weeks ago
The Smallest Gender Wage Gaps in OECD Countries