Energy
Which Countries Have the World’s Largest Proven Oil Reserves?
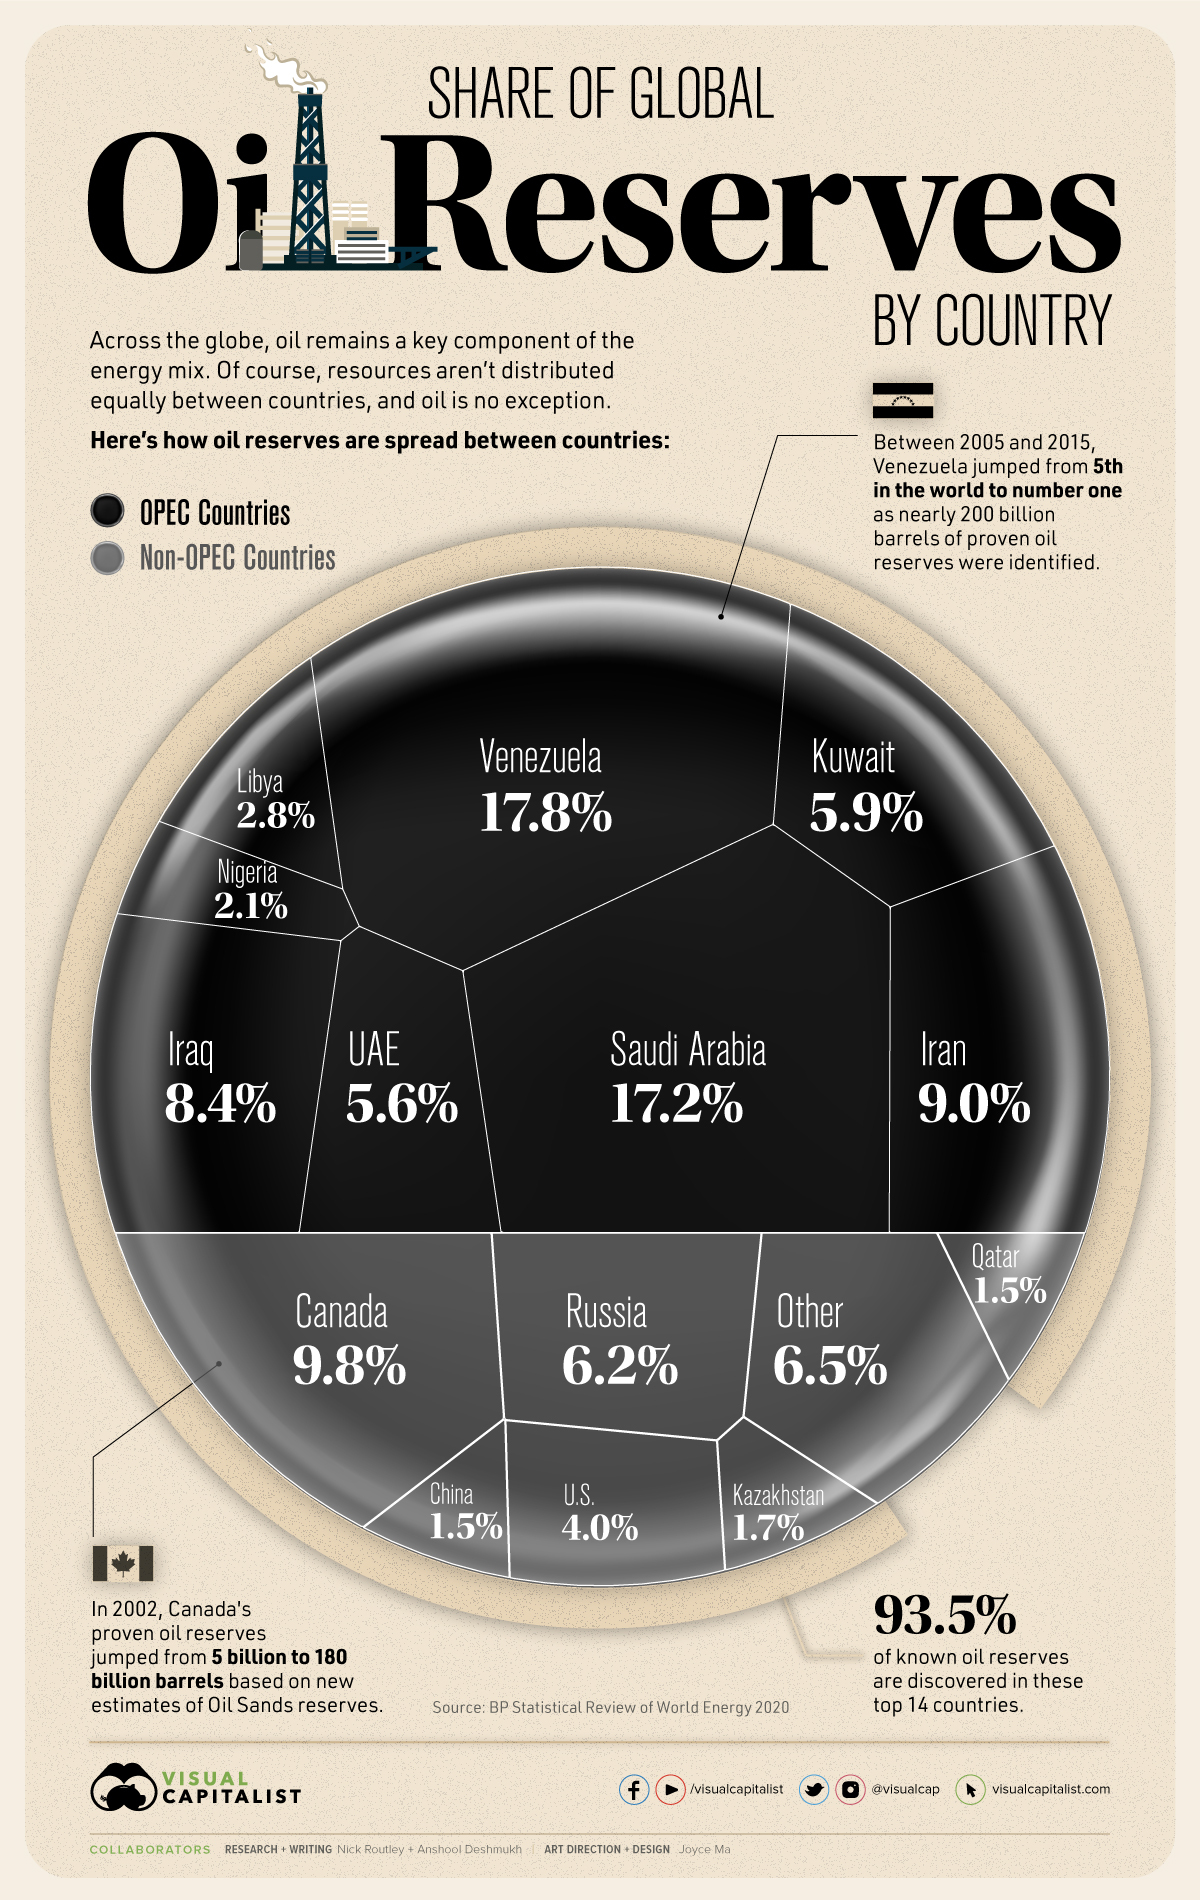


The Countries With the Largest Proven Oil Reserves
Oil is a natural resource formed by the decay of organic matter over millions of years, and like many other natural resources, it can only be extracted from reserves where it already exists. The only difference between oil and every other natural resource is that oil is well and truly the lifeblood of the global economy.
The world derives over a third of its total energy production from oil, more than any other source by far. As a result, the countries that control the world’s oil reserves often have disproportionate geopolitical and economic power.
According to the BP Statistical Review of World Energy 2020, 14 countries make up 93.5% of the proven oil reserves globally. The countries on this list span five continents and control anywhere from 25.2 billion barrels of oil to 304 billion barrels of oil.
Proven Oil Reserves, by Country
At the end of 2019, the world had 1.73 trillion barrels of oil reserves. Here are the 14 countries with at least a 1% share of global proven oil reserves:
| Rank | Country | Oil Reserves (billion barrels) | Share of Global Reserves |
|---|---|---|---|
| #1 | 🇻🇪 Venezuela | 304 | 17.8% |
| #2 | 🇸🇦 Saudi Arabia | 298 | 17.2% |
| #3 | 🇨🇦 Canada | 170 | 9.8% |
| #4 | 🇮🇷 Iran | 156 | 9.0% |
| #5 | 🇮🇶 Iraq | 145 | 8.4% |
| #6 | 🇷🇺 Russia | 107 | 6.2% |
| #7 | 🇰🇼 Kuwait | 102 | 5.9% |
| #8 | 🇦🇪 UAE | 98 | 5.6% |
| #9 | 🇺🇸 United States | 69 | 4.0% |
| #10 | 🇱🇾 Libya | 48 | 2.8% |
| #11 | 🇳🇬 Nigeria | 37 | 2.1% |
| #12 | 🇰🇿 Kazakhstan | 30 | 1.7% |
| #13 | 🇨🇳 China | 26.2 | 1.5% |
| #14 | 🇶🇦 Qatar | 25.2 | 1.5% |
While these countries are found all over the globe, a few countries have much larger amounts than others. Venezuela is the leading country in terms of oil reserves, with over 304 billion barrels of oil beneath its surface. Saudi Arabia is a close second with 298 billion, and Canada is third with 170 billion barrels of oil reserves.
Oil Reserves vs. Oil Production
A country with large amounts of reserves does not always translate to strong production numbers for petroleum, oil, and by-products. Oil reserves simply serve as an estimate of the amount of economically recoverable crude oil in a particular region. To qualify, these reserves must have the potential of being extracted under current technological constraints.
While countries like the U.S. and Russia are low on the list of oil reserves, they rank highly in terms of oil production. More than 95 million barrels of oil were produced globally every day in 2019, and the U.S., Saudi Arabia, and Russia are among the world’s top oil-producing countries, respectively.
Oil Sands Contributing to Growing Reserves
Venezuela has long been an oil-producing country with heavy economic reliance on oil exports. However, in 2011, Venezuela’s energy and oil ministry announced an unprecedented increase in proven oil reserves as oil sands in the Orinoco Belt territory were certified.
The nearly 200 billion barrels of proven oil reserves identified between 2005 and 2015, pushed Venezuela from fifth in the world to number one. As a result, South and Central America’s proven oil reserves more than doubled between 2008 and 2011.
In 2002, Canada’s proven oil reserves jumped from 5 billion to 180 billion barrels based on new oil sands estimates.
Canada accounts for almost 10% of the world’s proven oil reserves at 170 billion barrels, with an estimated 166.3 billion located in Alberta’s oil sands, and the rest found in conventional, offshore, and tight oil formations.
Large Reserves in OPEC Nations
The Organization of the Petroleum Exporting Countries (OPEC) is an intergovernmental global petroleum and oil distribution agency headquartered in Vienna, Austria.
The majority of countries with the largest oil reserves in the world are members of OPEC. Now composed of 14 member states, OPEC holds nearly 70% of crude oil reserves worldwide.
Most OPEC countries are in the Middle East, the region with the largest oil reserves, holding nearly half of the global share.
Regional Shifts
Though most of the proven oil reserves in the world were historically considered to be centered in the Middle East, in the past three decades their share of global oil reserves has dropped, from over 60% in 1992 to about 48% in 2019.
One of the main reasons for this drop was constant oil production and greater reserves discovered in the Americas. By 2012, Central and South America’s share had more than doubled and has remained just under 20% in the years since.
While oil sands ushered in a new era of global oil reserve domination, as the world shifts away from oil consumption and towards green energy and electrification, these reserves might not matter as much in the future as they once did.


Energy
Mapped: The Age of Energy Projects in Interconnection Queues, by State
This map shows how many energy projects are in interconnection queues by state and how long these projects have been queued up, on average.


Age of Energy Projects in Interconnection Queues, by State
This was originally posted on our Voronoi app. Download the app for free on iOS or Android and discover incredible data-driven charts from a variety of trusted sources.
By the end of 2023, more than 11,000 energy projects were in interconnection queues in the United States, waiting for a green-light from regional grid operators to proceed with construction.
This map, created in partnership with the National Public Utilities Council, maps out the average age of active energy projects in interconnection queues by state, using data from Berkeley Lab.
Interconnection Queues, Explained
Interconnection queues are lists of energy projects that have made interconnection requests to their regional grid operators. Once submitted, these requests formally initiate the impact study process that each project goes through before grid connection, forming waiting lists for approval known as interconnection queues.
In recent years, both the number and generation capacity of queued projects have surged in the United States, along with the length of time spent in queue.
According to Berkeley Lab, the amount of generation capacity entering queues each year has risen by more than 550% from 2015 to 2023, with average queue duration rising from 3 years to 5 years the same period.
As a result of the growing backlog, a large proportion of projects ultimately withdraw from queues, leading to only 19% of applications reaching commercial operations.
The Backlog: Number of Projects and Average Wait Times
Of the 11,000 active projects in U.S. queues at the end of 2023, Texas, California, and Virginia had the most in queue; 1,208, 947, and 743, respectively.
When looking at the average ages of these projects, all three states hovered around the national average of 34 months (2.83 years), with Texas sporting 28 months, California 33, and Virginia 34.
Vermont, Minnesota, Wisconsin, and Florida, on the other hand, had the highest average queue durations; 54, 49, 47, and 46 months, respectively.
Average Queue Duration by Project Type
At the end of 2023, more than 95% of the generation capacity in active interconnection queues was for emission-free resources. The table below provides a breakdown.
| Project Type | Average Queue Duration (As of 12/31/2023) | Number of Projects in Queue |
|---|---|---|
| Wind | 40 months | 841 |
| Solar | 34 months | 4,506 |
| Wind+Battery | 34 months | 76 |
| Solar+Battery | 27 months | 2,377 |
| Battery | 24 months | 2,818 |
Wind projects had the highest wait times at the end of 2023 with an average age of 40 months (3.33 years). Solar projects, on the other hand, made up more than 40% of projects in queue.
Overall, reducing the time that these renewable energy projects spend in queues can accelerate the transition to a low-carbon energy future.
According to the U.S. Department of Energy, enhancing data transparency, streamlining approval processes, promoting economic efficiency, and maintaining a reliable grid are some of the ways this growing backlog can be mitigated.

-

 Wealth6 days ago
Charted: Which City Has the Most Billionaires in 2024?
-

 Mining2 weeks ago
Gold vs. S&P 500: Which Has Grown More Over Five Years?
-

 Uranium2 weeks ago
The World’s Biggest Nuclear Energy Producers
-

 Education2 weeks ago
How Hard Is It to Get Into an Ivy League School?
-

 Debt2 weeks ago
How Debt-to-GDP Ratios Have Changed Since 2000
-

 Sports2 weeks ago
The Highest Earning Athletes in Seven Professional Sports
-

 Science2 weeks ago
Visualizing the Average Lifespans of Mammals
-

 Brands1 week ago
How Tech Logos Have Evolved Over Time