Markets
Ranked: The Most Valuable Brands in the World
Ranking The World’s Most Valuable Brands
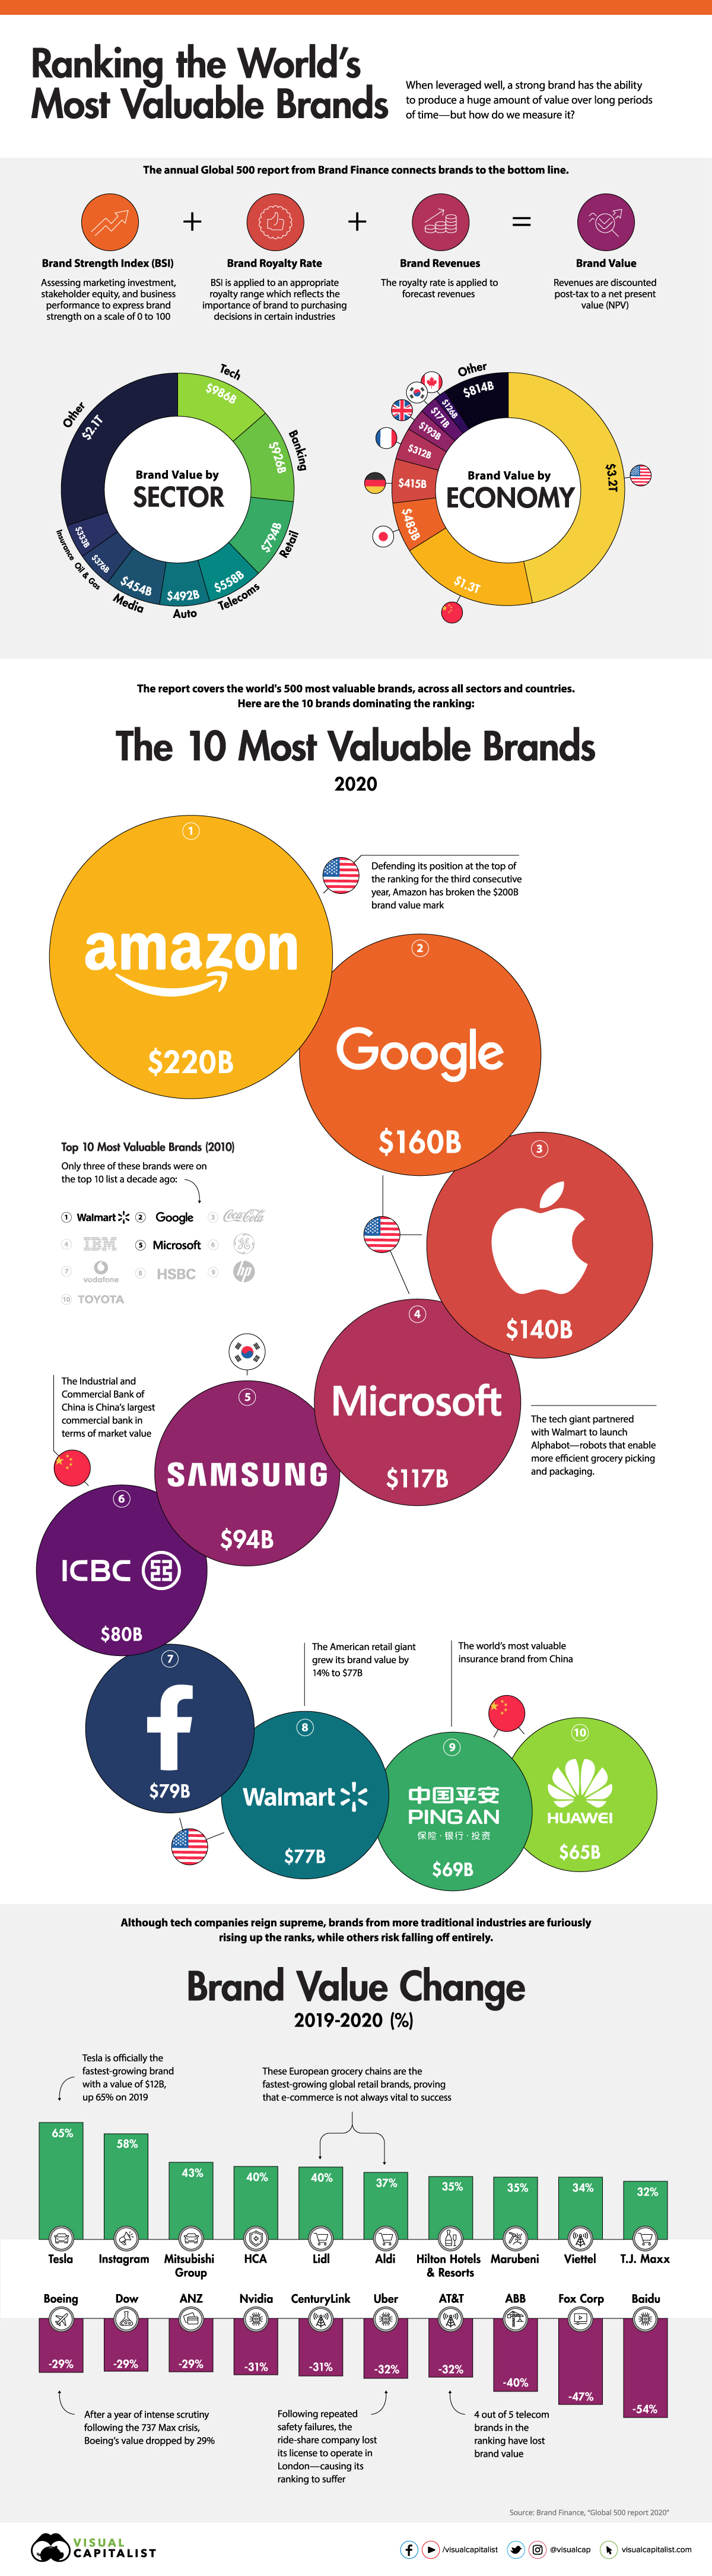
Due to its intangible nature, the power of a brand can be difficult to translate to a balance sheet. That said, a brand that truly connects with consumers and stands the test of time can deliver immense financial value.
Today’s graphic pulls data from the 2020 edition of Brand Finance’s annual Global 500 report, which ranks the world’s top brands by value using a multi-dimensional formula.
By quantifying the true value of a brand, investors and key decision makers can identify value that extends beyond quarterly earnings reports.
How much are brands really worth?
A Closer Look at the Leaderboard
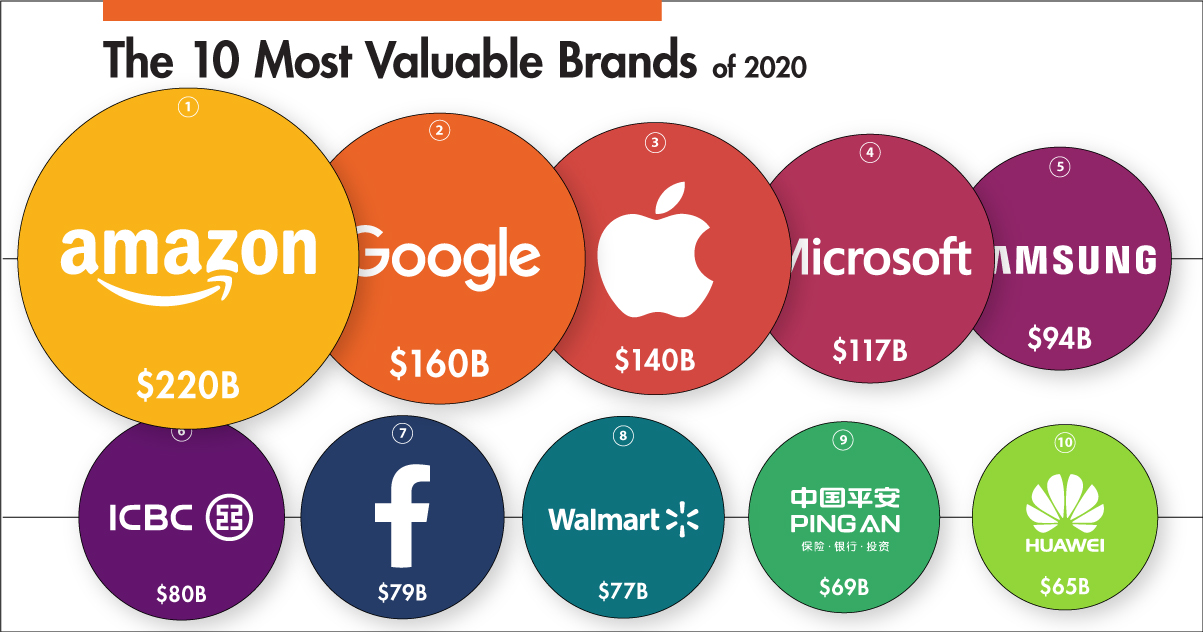
With 18% growth in the last year resulting in an eye-watering brand value of $220 billion, Amazon is a clear winner as the world’s most valuable brand—towering over Google and Apple’s brand valuations. As the largest online marketplace on the planet, Amazon relies on innovative technologies and investments in fast-growing sectors, such as healthcare, to create a diverse retail ecosystem.
Although tech companies command five of the top 10 spots in the ranking, brands from more traditional industries are hot on their tails.
Here are the top 100 most valuable brands according to the report:
| Ranking | Brand | 2020 Brand Value | YoY % Change | Country | Sector |
|---|---|---|---|---|---|
| #1 | Amazon | $220B | 17.5% | United States | Retail |
| #2 | $160B | 11.9% | United States | Tech | |
| #3 | Apple | $140B | -8.5% | United States | Tech |
| #4 | Microsoft | $117B | -2.1% | United States | Tech |
| #5 | Samsung | $94B | 3.5% | South Korea | Tech |
| #6 | ICBC | $80B | 1.2% | China | Banking |
| #7 | $79B | -4.1% | United States | Media | |
| #8 | Walmart | $77B | 14.2% | United States | Retail |
| #9 | Ping An | $69B | 19.8% | China | Insurance |
| #10 | Huawei | $65B | 4.5% | China | Tech |
| #11 | Mercedes-Benz | $65B | 7.8% | Germany | Automobiles |
| #12 | Verizon | $63B | -10.5% | United States | Telecoms |
| #13 | China Construction Bank | $62B | -10.2% | China | Banking |
| #14 | AT&T | $59B | -32% | United States | Telecoms |
| #15 | Toyota | $58B | 11.1% | Japan | Automobiles |
| #16 | State Grid | $57B | 11.1% | China | Utilities |
| #17 | Disney | $56B | 22.7% | United States | Media |
| #18 | Agricultural Bank of China | $55B | -0.7% | China | Banking |
| #19 | $54B | 6.8% | China | Media | |
| #20 | Bank of China | $51B | -0.7% | China | Banking |
| #21 | The Home Depot | $50B | 7.3% | United States | Retail |
| #22 | China Mobile | $49B | -11.9% | China | Telecoms |
| #23 | Shell | $47B | 12.4% | Netherlands | Oil & Gas |
| #24 | Saudi Aramco | $47B | N/A | Saudi Arabia | Oil & Gas |
| #25 | Volkswagen | $45B | 7.6% | Germany | Automobiles |
| #26 | YouTube | $44B | 17.5% | United States | Media |
| #27 | Tencent QQ | $44B | -11.3% | China | Media |
| #28 | Starbucks | $41B | 4.5% | United States | Restaurants |
| #29 | Wells Fargo | $41B | 2.3% | United States | Banking |
| #30 | BMW | $40B | 0.0% | Germany | Automobiles |
| #31 | Deutsche Telekom | $40B | -13.6% | Germany | Telecoms |
| #32 | Moutai | $39B | 29.1% | Germany | Spirits |
| #33 | PetroChina | $38B | 3.3% | China | Oil & Gas |
| #34 | Coca-Cola | $38B | 4.8% | United States | Soft Drinks |
| #35 | Mitsubishi Group | $38B | 42.8% | Japan | Automobiles |
| #36 | McDonald’s | $37B | 18.9% | United States | Restaurants |
| #37 | Taobao | $37B | -20.7 | China | Retail |
| #38 | NTT Group | $36B | -12.8% | Japan | Telecoms |
| #39 | Bank of America | $35B | -3.6% | United States | Banking |
| #40 | Nike | $35B | 7.3% | United States | Apparel |
| #41 | Porsche | $33B | 15.6% | Germany | Automobiles |
| #42 | Sinopec | $33B | 14.7% | China | Oil & Gas |
| #43 | IBM | $33B | 1.5% | United States | Tech |
| #44 | CITI | $33B | -9% | United States | Banking |
| #45 | Honda | $33B | 28.6% | Japan | Automobiles |
| #46 | Marlboro | $33B | -2.7% | United States | Tobacco |
| #47 | Deloitte | $32B | 9.6% | United States | Commercial Services |
| #48 | Chase | $31B | -13.8% | United States | Banking |
| #49 | Tmall | $31B | -15.9% | China | Retail |
| #50 | UPS | $29B | 0.6% | United States | Logistics |
| #51 | American Express | $29B | 6.2% | United States | Commercial Services |
| #52 | Xfinity | $29B | 6.4% | United States | Telecoms |
| #53 | United Healthcare | $28B | -7.4% | United States | Healthcare |
| #54 | Sumitomo Group | $28B | 4.5% | Japan | Mining, Iron & Steel |
| #55 | Intel | $27B | -5.5% | United States | Tech |
| #56 | VISA | $27B | -3% | United States | Commercial Services |
| #57 | $27B | 58% | United States | Media | |
| #58 | China Life | $25B | -4.4% | China | Insurance |
| #59 | Accenture | $25B | -3.8% | United States | IT Services |
| #60 | Allianz | $25B | 7.5% | Germany | Insurance |
| #61 | CSCEC | $25B | -3.3% | China | Engineering & Construction |
| #62 | PWC | $25B | -0.3% | United States | Commercial Services |
| #63 | Lowe’s | $25B | 3.4% | United States | Retail |
| #64 | Mitsui | $24B | 15.8% | Japan | Mining, Iron & Steel |
| #65 | General Electric | $24B | -14.4% | United States | Engineering & Construction |
| #66 | EY | $24B | 2.1% | United Kingdom | Commercial Services |
| #67 | Oracle | $24B | -6.7% | United States | Tech |
| #68 | Cisco | $24B | 7.1% | United States | Tech |
| #69 | BP | $23B | 2.6% | United Kingdom | Oil & Gas |
| #70 | CVS | $23B | 9.1% | United Kingdom | Retail |
| #71 | Total | $23B | 8.1% | France | Oil & Gas |
| #72 | FedEx | $23B | -5.1% | United States | Logistics |
| #73 | Netflix | $23B | 8.4% | United States | Media |
| #74 | China Merchants Bank | $23B | 1.8% | China | Banking |
| #75 | JP Morgan | $23B | 15.3% | United States | Banking |
| #76 | Boeing | $23B | -29% | United States | Aerospace & Defence |
| #77 | Costco | $23B | 32.1% | United States | Retail |
| #78 | SK Group | $22B | -17.5% | South Korea | Telecoms |
| #79 | Wuliangye | $21B | 30.1% | China | Spirits |
| #80 | Evergrande | $21B | 0.5% | China | Real Estate |
| #81 | Nestle | $21B | 3.4% | Switzerland | Food |
| #82 | Hyundai Group | $21B | -2.8% | South Korea | Automobiles |
| #83 | China Telecom | $21B | -2.8% | China | Telecoms |
| #84 | Siemens | $21B | -7.2% | Germany | Engineering & Construction |
| #85 | TATA Group | $21B | 2.3% | India | Engineering & Construction |
| #86 | Mastercard | $21B | 8.4% | United States | Commercial Services |
| #87 | Bosch | $20B | -14.6% | Germany | Engineering & Construction |
| #88 | IKEA | $19B | -9.4% | Sweden | Retail |
| #89 | HSBC | $19B | -3.6% | United Kingdom | Banking |
| #90 | Spectrum | $19B | 25% | United States | Telecoms |
| #91 | Vodafone | $19B | -10.3% | United Kingdom | Telecoms |
| #92 | Pepsi | $19B | 2.2% | United States | Soft Drinks |
| #93 | Alibaba | $19B | 28.8% | China | Retail |
| #94 | Ford | $18B | -1.4% | United States | Automobiles |
| #95 | AIA | $18B | 17.3% | China | Insurance |
| #96 | Orange | $18B | -13.7% | France | Telecoms |
| #97 | Nissan | $18B | -4.5% | Japan | Automobiles |
| #98 | Chevron | $18B | 4.7% | United States | Oil & Gas |
| #99 | GUCCI | $18B | 20.2% | Italy | Apparel |
| #100 | Dell Technologies | $18B | -22.9% | United States | Tech |
American retail giant Walmart enters 2020’s top 10 ranking with an impressive brand value increase of 14% to $77.5 billion. The retailer’s recent success could be partially attributed to its growing strategic partnership with Microsoft—which currently sits in sixth place. By tapping into Microsoft’s cloud services, Walmart can now provide a digital first retail experience for its customers.
Another brand that has experienced remarkable growth is China’s leading insurance company, Ping An. With 19.8% growth, resulting in a brand value of $69 billion, the financial conglomerate’s aggressive focus on fintech R&D has garnered the company 200 million retail customers and 500 million internet users—making it one of the largest financial services companies in the world.
While the majority of the world’s most valuable brands hail from the U.S. or China, which brands lead by region?
Most Valuable Brands by Region
Not surprisingly, Amazon leads as the most valuable B2C brand across the Americas, with the exception of Latin America. Beer brand Corona, was crowned as the leader in this region, boasting a brand value of $8.1 billion.
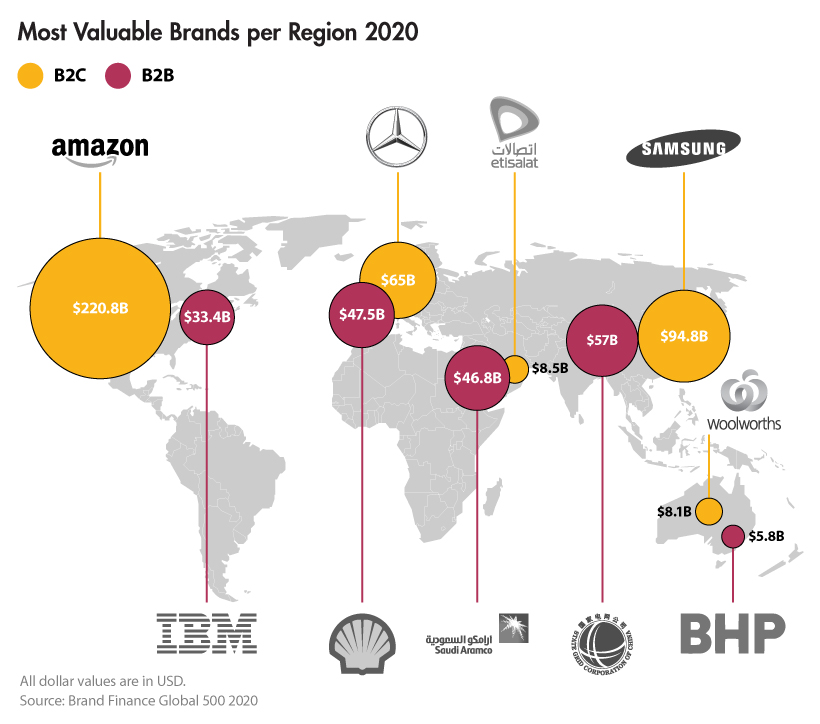
In Europe, German companies outperformed other countries, with automotive brand Mercedes-Benz holding the title for the most valuable B2C brand for that continent—despite China being its biggest market.
On the other side of the world, Samsung reigns as Asia’s most valuable B2C brand. The company owns 54% of the nascent 5G market globally, having shipped 6.7 million 5G phones in the last year alone.
A Brand Eat Brand World
Whether brands are regional or global leaders, they still face the threat of being knocked of their perch by brands experiencing significant growth.
Climbing to the Top
With an increase of 65% to $12.4 billion, Tesla is officially the fastest-growing brand in the world. Despite concerns over not being able to keep up with demand, the electric car company is expected to exceed 500,000 vehicle deliveries in 2020. Having recently posted over $7 billion of revenue in the fourth quarter of 2019, the success of Tesla’s innovative models is sure to rattle the automotive brands in the ranking.
However, not everything comes down to innovation. European retailers Lidl and Aldi have seen growth of 40% and 37% respectively, and are only getting started.
After disrupting Europe’s entire supermarket industry by offering quality products at significantly lower prices, the chains now have their sights set on the U.S. market, with Aldi expected to surpass Kroger in sales.
Despite the unprecedented disruption caused by e-commerce, the popular assertion that entering digital operations brings instant success while bricks and mortar stores are doomed for extinction is being proved wrong
—David Haigh, CEO Brand Finance
In contrast, there are also well established brands that have struggled to retain brand value.
Racing to the Bottom
Chinese search engine Baidu—also known as the Google of China—recorded the largest drop in brand value, decreasing by 54% to $8.9 billion. The brand has struggled with a poor reputation and intensifying market competition. As a result, the brand’s revenues and subsequently its brand value were heavily impacted.
Boeing is a prime example of the unpredictability of brand value. As a company that once imbued trust and excellent safety standards, the brand’s value has dropped by 29% due to the recent reports of accidents that have tarnished its reputation.
The True Power of Brand
Boeing’s recent hardships reflect the volatile nature of brand value. While 244 brands in the entire ranking have increased their brand value year-over-year, another 212 have taken a hit.
Part of a brand’s purpose is to manage reputation, retain loyal customers, and generate awareness. Given that a brand is the sum of its parts, the ranking proves that an issue with any of these things could trigger a chain reaction, negatively impacting a brand’s bottom line.
So is it worth companies investing in their brand? All signs point to yes, for now.


Markets
Visualizing Global Inflation Forecasts (2024-2026)
Here are IMF forecasts for global inflation rates up to 2026, highlighting a slow descent of price pressures amid resilient global growth.


Visualizing Global Inflation Forecasts (2024-2026)
Global inflation rates are gradually descending, but progress has been slow.
Today, the big question is if inflation will decline far enough to trigger easing monetary policy. So far, the Federal Reserve has held rates for nine months amid stronger than expected core inflation, which excludes volatile energy and food prices.
Yet looking further ahead, inflation forecasts from the International Monetary Fund (IMF) suggest that inflation will decline as price pressures ease, but the path of disinflation is not without its unknown risks.
This graphic shows global inflation forecasts, based on data from the April 2024 IMF World Economic Outlook.
Get the Key Insights of the IMF’s World Economic Outlook
Want a visual breakdown of the insights from the IMF’s 2024 World Economic Outlook report?
This visual is part of a special dispatch of the key takeaways exclusively for VC+ members.
Get the full dispatch of charts by signing up to VC+.
The IMF’s Inflation Outlook
Below, we show the IMF’s latest projections for global inflation rates through to 2026:
| Year | Global Inflation Rate (%) | Advanced Economies Inflation Rate (%) | Emerging Market and Developing Economies Inflation Rate (%) |
|---|---|---|---|
| 2019 | 3.5 | 1.4 | 5.1 |
| 2020 | 3.2 | 0.7 | 5.2 |
| 2021 | 4.7 | 3.1 | 5.9 |
| 2022 | 8.7 | 7.3 | 9.8 |
| 2023 | 6.8 | 4.6 | 8.3 |
| 2024 | 5.9 | 2.6 | 8.3 |
| 2025 | 4.5 | 2.0 | 6.2 |
| 2026 | 3.7 | 2.0 | 4.9 |
After hitting a peak of 8.7% in 2022, global inflation is projected to fall to 5.9% in 2024, reflecting promising inflation trends amid resilient global growth.
While inflation has largely declined due to falling energy and goods prices, persistently high services inflation poses challenges to mitigating price pressures. In addition, the IMF highlights the potential risk of an escalating conflict in the Middle East, which could lead to energy price shocks and higher shipping costs.
These developments could negatively affect inflation scenarios and prompt central banks to adopt tighter monetary policies. Overall, by 2026, global inflation is anticipated to decline to 3.7%—still notably above the 2% target set by several major economies.
Adding to this, we can see divergences in the path of inflation between advanced and emerging economies. While affluent nations are forecast to see inflation edge closer to the 2% target by 2026, emerging economies are projected to have inflation rates reach 4.9%—falling closer to their pre-pandemic averages.
Get the Full Analysis of the IMF’s Outlook on VC+
This visual is part of an exclusive special dispatch for VC+ members which breaks down the key takeaways from the IMF’s 2024 World Economic Outlook.
For the full set of charts and analysis, sign up for VC+.

-

 United States6 days ago
Visualizing the Most Common Pets in the U.S.
-

 Culture2 weeks ago
The Highest Earning Athletes in Seven Professional Sports
-

 Science2 weeks ago
Visualizing the Average Lifespans of Mammals
-

 Brands2 weeks ago
How Tech Logos Have Evolved Over Time
-

 Energy2 weeks ago
Ranked: The Top 10 EV Battery Manufacturers in 2023
-

 Countries2 weeks ago
Countries With the Largest Happiness Gains Since 2010
-

 Economy2 weeks ago
VC+: Get Our Key Takeaways From the IMF’s World Economic Outlook
-

 Demographics1 week ago
The Countries That Have Become Sadder Since 2010