Misc
Ranked: Which Cars Have the Best Resale Value?
Ranked: Which Cars Have the Best Resale Value?
For three years now, the used-car market has been booming, after the pandemic disrupted new car supply chains, sending secondhand vehicle prices skyrocketing.
But which cars have the best resale value?
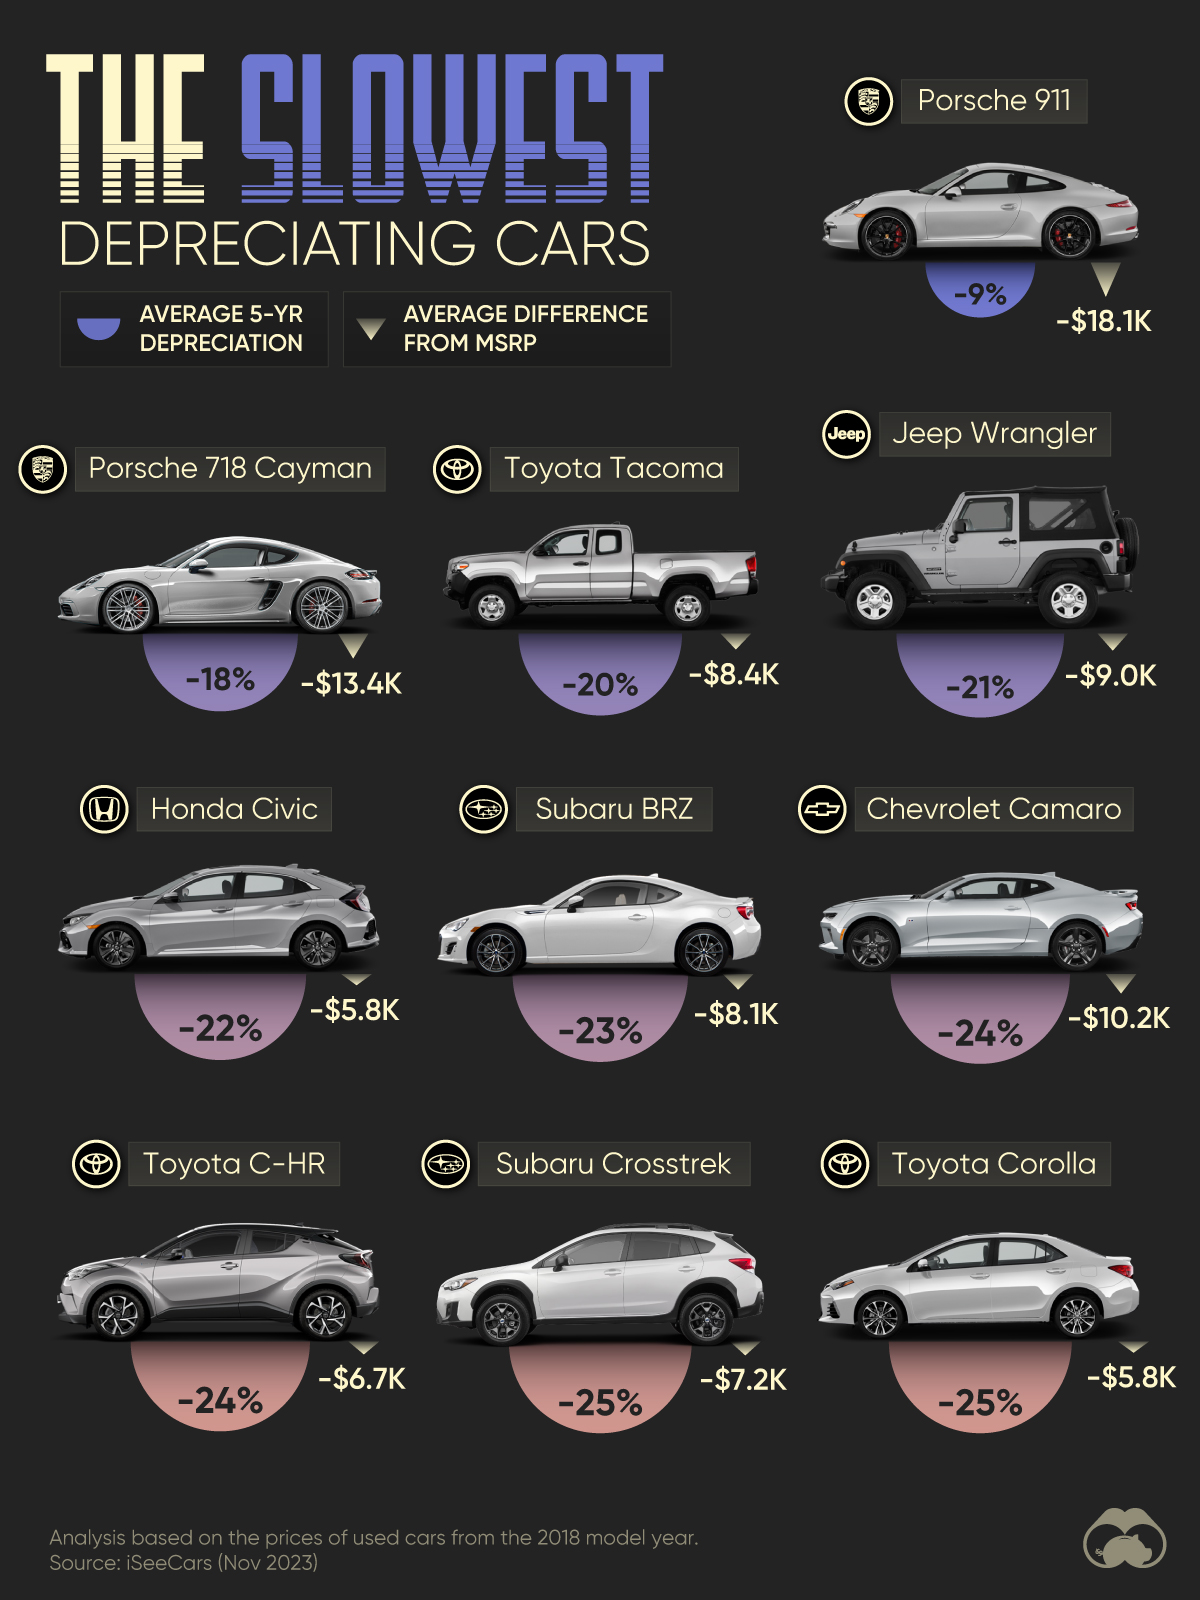
We visualize the top 10 vehicles with the lowest depreciation rates over five years, based on data from iSeeCars.
They analyzed over 1.1 million used cars from model year 2018, sold between November 2022 to October 2023. Models no longer in production as of the 2022 model year were excluded.
Porsche is Still (Almost) Perfect After Five Years
Heading the list, Porsche has two models with the best resale value after half a decade.
After five years, the 911 (Coupe) only loses 9% of its retail value in the used-car market on average. Porsche’s flagship costs anywhere between $90,000–$294,000 based on the horsepower (ranging from 200–700), along with other model specifications.
At second place, the Porsche 718 Cayman loses about one-fifth of its value. Two other Porsches—the Boxster, and the 911 convertible—also feature in ranks, at 12th and 15th respectively, both losing around 25% of their retail price tag.
Here’s a look at the full list of slowest depreciating cars in the United States:
| Rank | Model | Average 5-Yr Depreciation | Average Difference from MSRP |
|---|---|---|---|
| 1 | Porsche 911 (Coupe) | 9% | $18,094 |
| 2 | Porsche 718 Cayman | 18% | $13,372 |
| 3 | Toyota Tacoma | 20% | $8,359 |
| 4 | Jeep Wrangler | 21% | $8,951 |
| 5 | Honda Civic | 22% | $5,817 |
| 6 | Subaru BRZ | 23% | $8,114 |
| 7 | Chevrolet Camaro | 24% | $10,161 |
| 8 | Toyota C-HR | 24% | $6,692 |
| 9 | Subaru Crosstrek | 25% | $7,214 |
| 10 | Toyota Corolla | 25% | $5,800 |
| 11 | Ford Mustang | 25% | $10,035 |
| 12 | Porsche 718 Boxster | 25% | $20,216 |
| 13 | Toyota Tundra | 25% | $12,588 |
| 14 | Kia Rio 5-Door | 26% | $5,006 |
| 15 | Porsche 911 (Convertible) | 26% | $42,227 |
| 16 | Honda HR-V | 26% | $7,318 |
| 17 | Subaru Impreza (Wagon) | 26% | $6,927 |
| 18 | Kia Rio | 26% | $4,959 |
| 19 | Chevrolet Spark | 27% | $4,784 |
| 20 | Toyota RAV4 | 27% | $8,858 |
| 21 | Hyundai Accent | 27% | $5,353 |
| 22 | Toyota 4Runner | 27% | $13,147 |
| 23 | Chevrolet Corvette | 28% | $22,712 |
| 24 | Nissan Kicks | 28% | $6,560 |
| 25 | Subaru Impreza (Sedan) | 28% | $7,158 |
Note: MSRP stands for Manufacturer Suggested Retail Price, the price recommended by a product’s producer to retailers. Furthermore, MSRPs from 2018 were inflation-adjusted to 2023 dollars.
The Toyota Tacoma, America’s fifth best-selling truck, comes in third, losing 20%.
The Jeep Wrangler (-21%) and the Honda Civic (-22%) round out the top five cars with the best resale value.
Two more sports cars (the Subaru BRZ and Chevrolet Camaro) feature in the top 10, indicating that these “fun” designer cars are valued for their status as well as functionality.
Aside from the sports category, Americans seem to rate Japanese automakers highly. Put together, Toyota, Subaru, Honda, and Nissan account for half of the cars with the best resale value.


Public Opinion
Charted: How Americans Feel About Federal Government Agencies
Fourteen of 16 federal government agencies garnered more favorable responses than unfavorable ones. But what were the outliers?
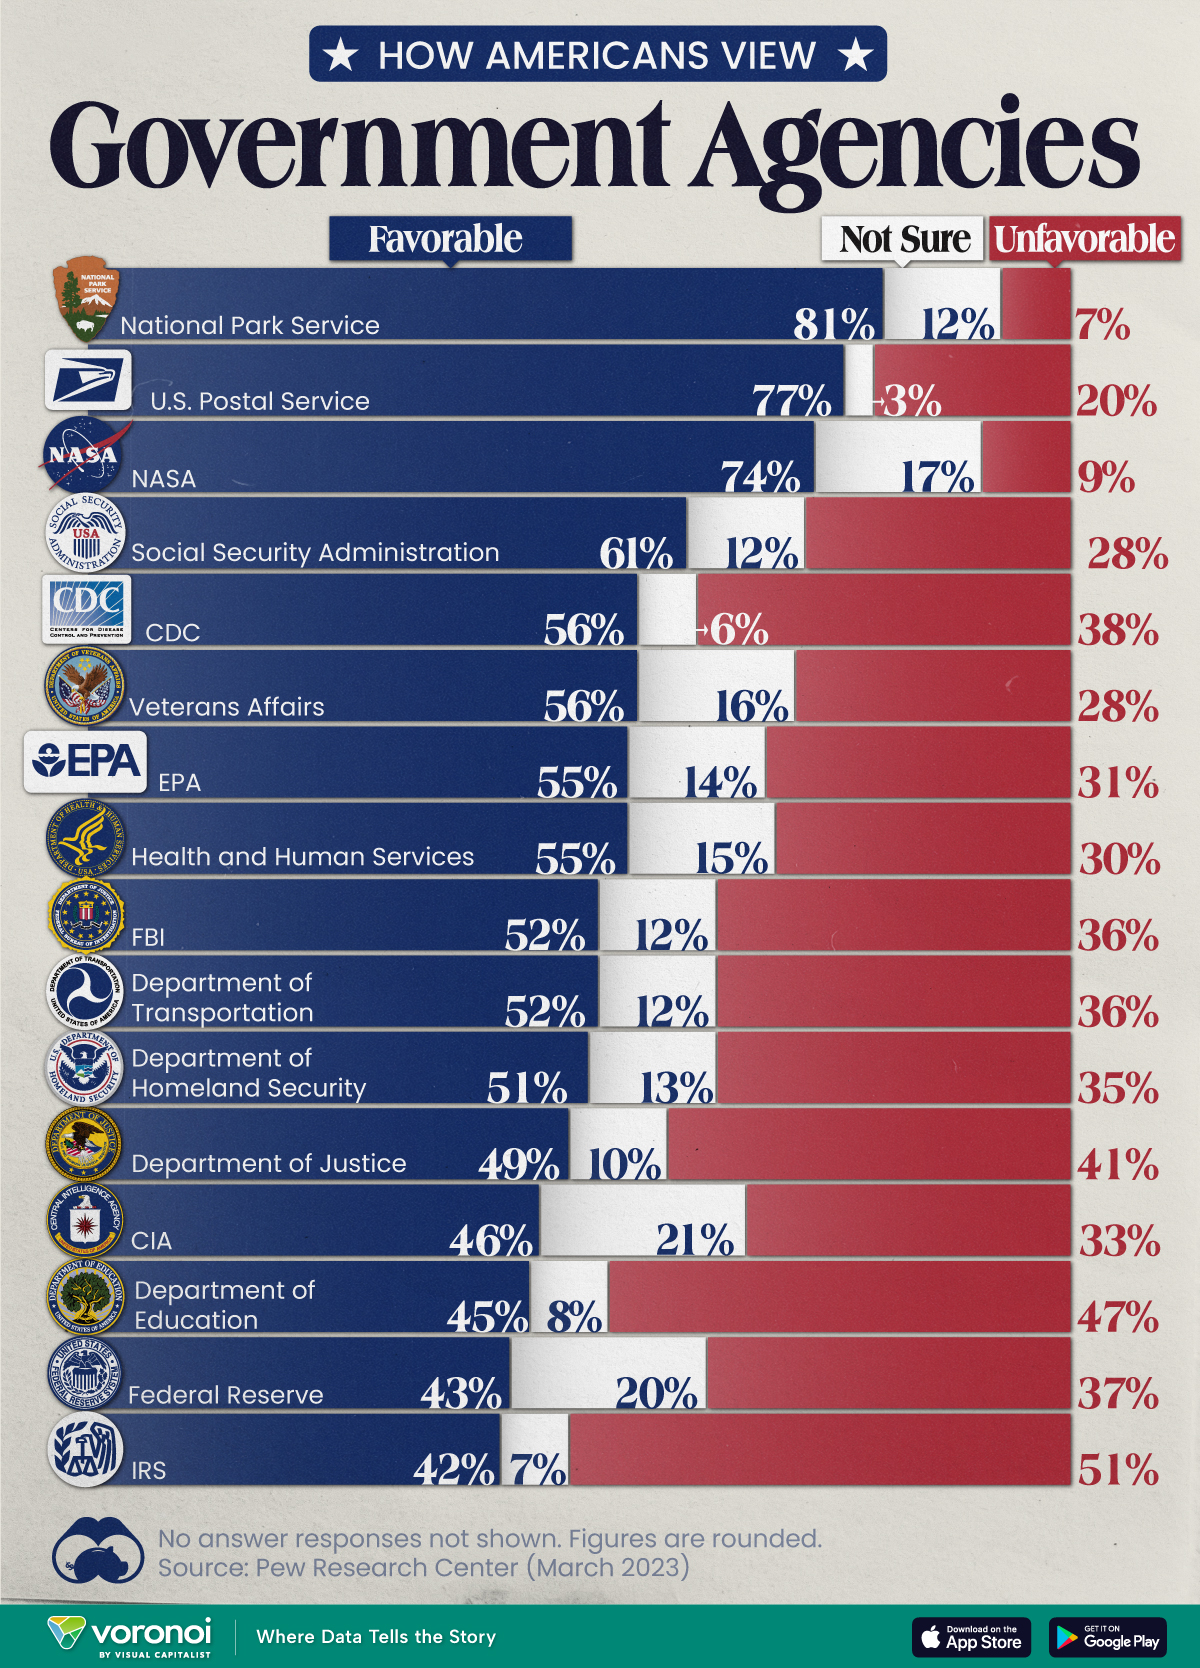
Chart: How Americans Rate 16 Federal Government Agencies
This was originally posted on our Voronoi app. Download the app for free on iOS or Android and discover incredible data-driven charts from a variety of trusted sources.
Come election time, America won’t hesitate to show its approval or disapproval of the country’s elected political representatives. That said, feelings about the federal bureaucracy and its associated agencies are a little harder to gauge.
We chart the results from an opinion poll conducted by Pew Research Center between March 13-19, 2023. In it, 10,701 adults—a representative of the U.S. adult population—were asked whether they felt favorably or unfavorably towards 16 different federal government agencies.
Americans Love the Park Service, Are Divided Over the IRS
Broadly speaking, 14 of the 16 federal government agencies garnered more favorable responses than unfavorable ones.
Of them, the Parks Service, Postal Service, and NASA all had the approval of more than 70% of the respondents.
| Agency | Favorable | Unfavorable | Not sure |
|---|---|---|---|
| 🏞️ National Park Service | 81% | 7% | 12% |
| 📮 U.S. Postal Service | 77% | 20% | 3% |
| 🚀 NASA | 74% | 9% | 17% |
| 💼 Social Security Administration | 61% | 28% | 12% |
| 🔬 CDC | 56% | 38% | 6% |
| 🎖️ Veterans Affairs | 56% | 28% | 16% |
| 🌿 EPA | 55% | 31% | 14% |
| 💉 Health & Human Services | 55% | 30% | 15% |
| 🕵️ FBI | 52% | 36% | 12% |
| 🚗 Department of Transportation | 52% | 36% | 12% |
| 🛡️ Department of Homeland Security | 51% | 35% | 13% |
| ⚖️ Department of Justice | 49% | 41% | 10% |
| 🕵️♂️ CIA | 46% | 33% | 21% |
| 📚 Department of Education | 45% | 47% | 8% |
| 💰 Federal Reserve | 43% | 37% | 20% |
| 💼 IRS | 42% | 51% | 7% |
Note: Figures are rounded. No answer responses are not shown.
Only the Department of Education and the IRS earned more unfavorable responses, and between them, only the IRS had a majority (51%) of unfavorable responses.
There are some caveats to remember with this data. Firstly, tax collection is a less-friendly activity than say, maintaining picturesque parks. Secondly, the survey was conducted a month before taxes were typically due, a peak time for experiencing filing woes.
Nevertheless, the IRS has come under fire in recent years. As per a New York Times article in 2019, eight years of budget cuts have stymied the agency’s ability to scrutinize tax filings from wealthier and more sophisticated filers.
At the same time poorer Americans are facing increasing audits on wage subsidies available to low income workers. According to a Transactional Records Access Clearinghouse report, this subset of filers was audited five-and-a-half more times the average American.

-

 Markets5 days ago
Mapped: The Most Valuable Company in Each Southeast Asian Country
-

 Markets2 weeks ago
The Top Private Equity Firms by Country
-

 Jobs2 weeks ago
The Best U.S. Companies to Work for According to LinkedIn
-

 Economy2 weeks ago
Ranked: The Top 20 Countries in Debt to China
-

 Politics1 week ago
Charted: Trust in Government Institutions by G7 Countries
-

 Energy1 week ago
Mapped: The Age of Energy Projects in Interconnection Queues, by State
-

 Mining1 week ago
Visualizing Global Gold Production in 2023
-

 Markets1 week ago
Visualized: Interest Rate Forecasts for Advanced Economies