Business
Pandemic Recovery: Have North American Downtowns Bounced Back?


Pandemic Recovery: Have Downtowns Bounced Back?
As we continue on our journey towards recovery from the impacts of the pandemic, North American offices that sat empty for months have started to welcome back in-person workers.
This small step towards normalcy has sparked questions around the future of office life—will office culture eventually bounce back to pre-pandemic levels, or is remote work here to stay?
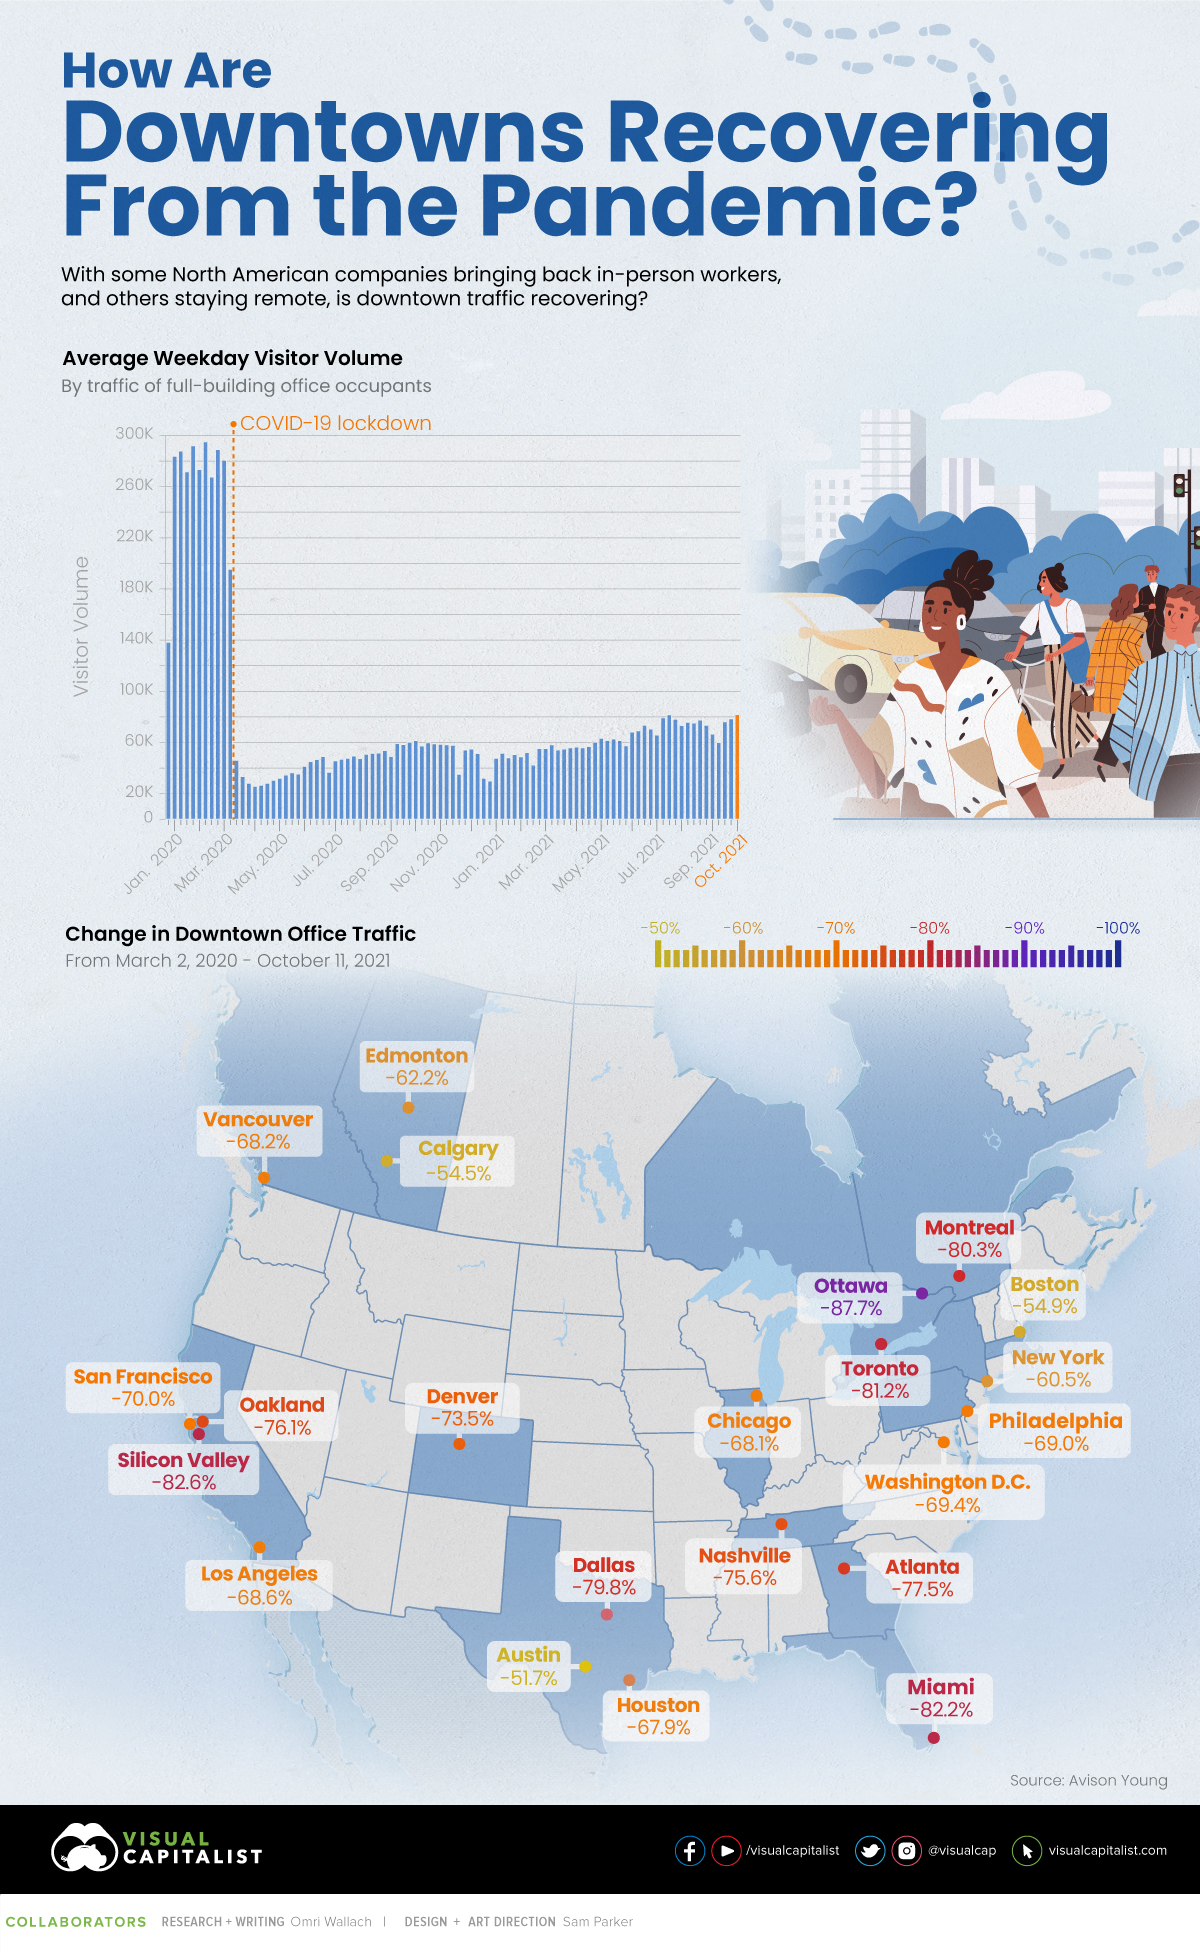
It’s impossible to predict the future, but one way to gauge the current state of office life is by looking at foot traffic across city centers in North America. This graphic measures just that, using data from Avison Young.
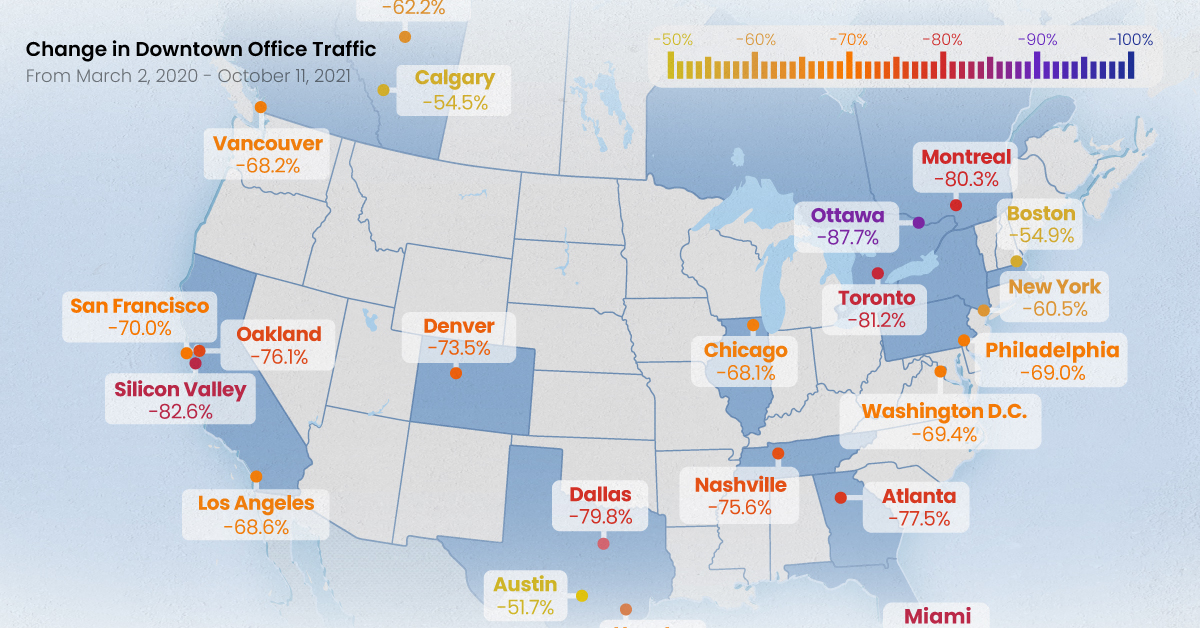
Change in Downtown Office Traffic
According to the data, which measures foot traffic in major office buildings in 23 different metropolitan hubs across North America, remains drastically below pre-pandemic levels.
Across all major cities included in the index, average weekday visitor volume has fallen by 73.7% since the early months of 2020. Here’s a look at each individual city’s change in foot traffic, from March 2, 2020 to Oct 11, 2021:
| City | Country | Change in Foot Traffic |
|---|---|---|
| Austin | 🇺🇸 | -51.70% |
| Calgary | 🇨🇦 | -54.50% |
| Boston | 🇺🇸 | -54.90% |
| New York | 🇺🇸 | -60.50% |
| San Francisco | 🇺🇸 | -60.80% |
| Edmonton | 🇨🇦 | -62.20% |
| Houston | 🇺🇸 | -67.90% |
| Chicago | 🇺🇸 | -68.10% |
| Vancouver | 🇨🇦 | -68.20% |
| Los Angeles | 🇺🇸 | -68.60% |
| Philadelphia | 🇺🇸 | -69.00% |
| Washington, DC | 🇺🇸 | -69.40% |
| San Francisco Peninsula | 🇺🇸 | -70.00% |
| Denver | 🇺🇸 | -73.50% |
| Nashville | 🇺🇸 | -75.60% |
| East Bay/Oakland | 🇺🇸 | -76.10% |
| Atlanta | 🇺🇸 | -77.50% |
| Dallas | 🇺🇸 | -79.80% |
| Montreal | 🇨🇦 | -80.30% |
| Toronto | 🇨🇦 | -81.20% |
| Miami | 🇺🇸 | -82.20% |
| Silicon Valley | 🇺🇸 | -82.60% |
| Ottawa | 🇨🇦 | -87.70% |
The Canadian city of Calgary is a somewhat unique case. On one hand, foot traffic has bounced back stronger than many other downtowns across North America. On the other hand, the city has one of the highest commercial vacancy rates in North America, and there are existential questions about what comes next for the city.
Interestingly, a number of cities with a high proportion of tech jobs, such as Austin, Boston, and San Francisco bounced back the strongest post-pandemic. Of course, there is one noteworthy exception to that rule.
A Tale of Two Cities
Silicon Valley has experienced one of the most significant drops in foot traffic, at -82.6%. Tech as an industry has seen one of the largest increases in remote work, as Bay Area workers look to escape high commuter traffic and high living expenses. A recent survey found that 53% of tech workers in the region said they are considering moving, with housing costs being the primary reason most respondents cited.
Meanwhile, in a very different part of North America, another city is experienced a sluggish rebound in foot traffic, but for very different reasons. Ottawa, Canada’s capital, is facing empty streets and struggling small businesses that rely on the droves of government workers that used to commute to downtown offices. Unlike Silicon Valley, where tech workers are taking advantage of flexible work options, many federal workers in Ottawa are still working from home without a clear plan on returning to the workplace.
It’s also worth noting that these two cities are home to a lot of single-occupant office buildings, which is a focus of this data set.
Some Businesses Remain Hopeful
Despite a slow return to office life, some employers are snapping up commercial office space in preparation for a potential mass return to the office.
Back in March 2021, Google announced it was planning to spend over $7 billion on U.S. office space and data centers. The tech giant held true to its promise—in September, Google purchased a Manhattan commercial building for $2.1 billion.
Other tech companies like Alphabet and Facebook have also been growing their office spaces throughout the pandemic. In August 2021, Amazon leased new office space in six major U.S. cities, and in September 2020, Facebook bought a 400,000 square foot complex in Bellevue, Washington.
Will More Employees Return or Stay Remote?
It’s important to note that we’re still in the midst of pandemic recovery, which means the jury’s still out on what our post-pandemic world will look like.
Will different cities and industries eventually recover in different ways, or are we approaching the realities of “new normal” foot traffic in North American city centers?


Culture
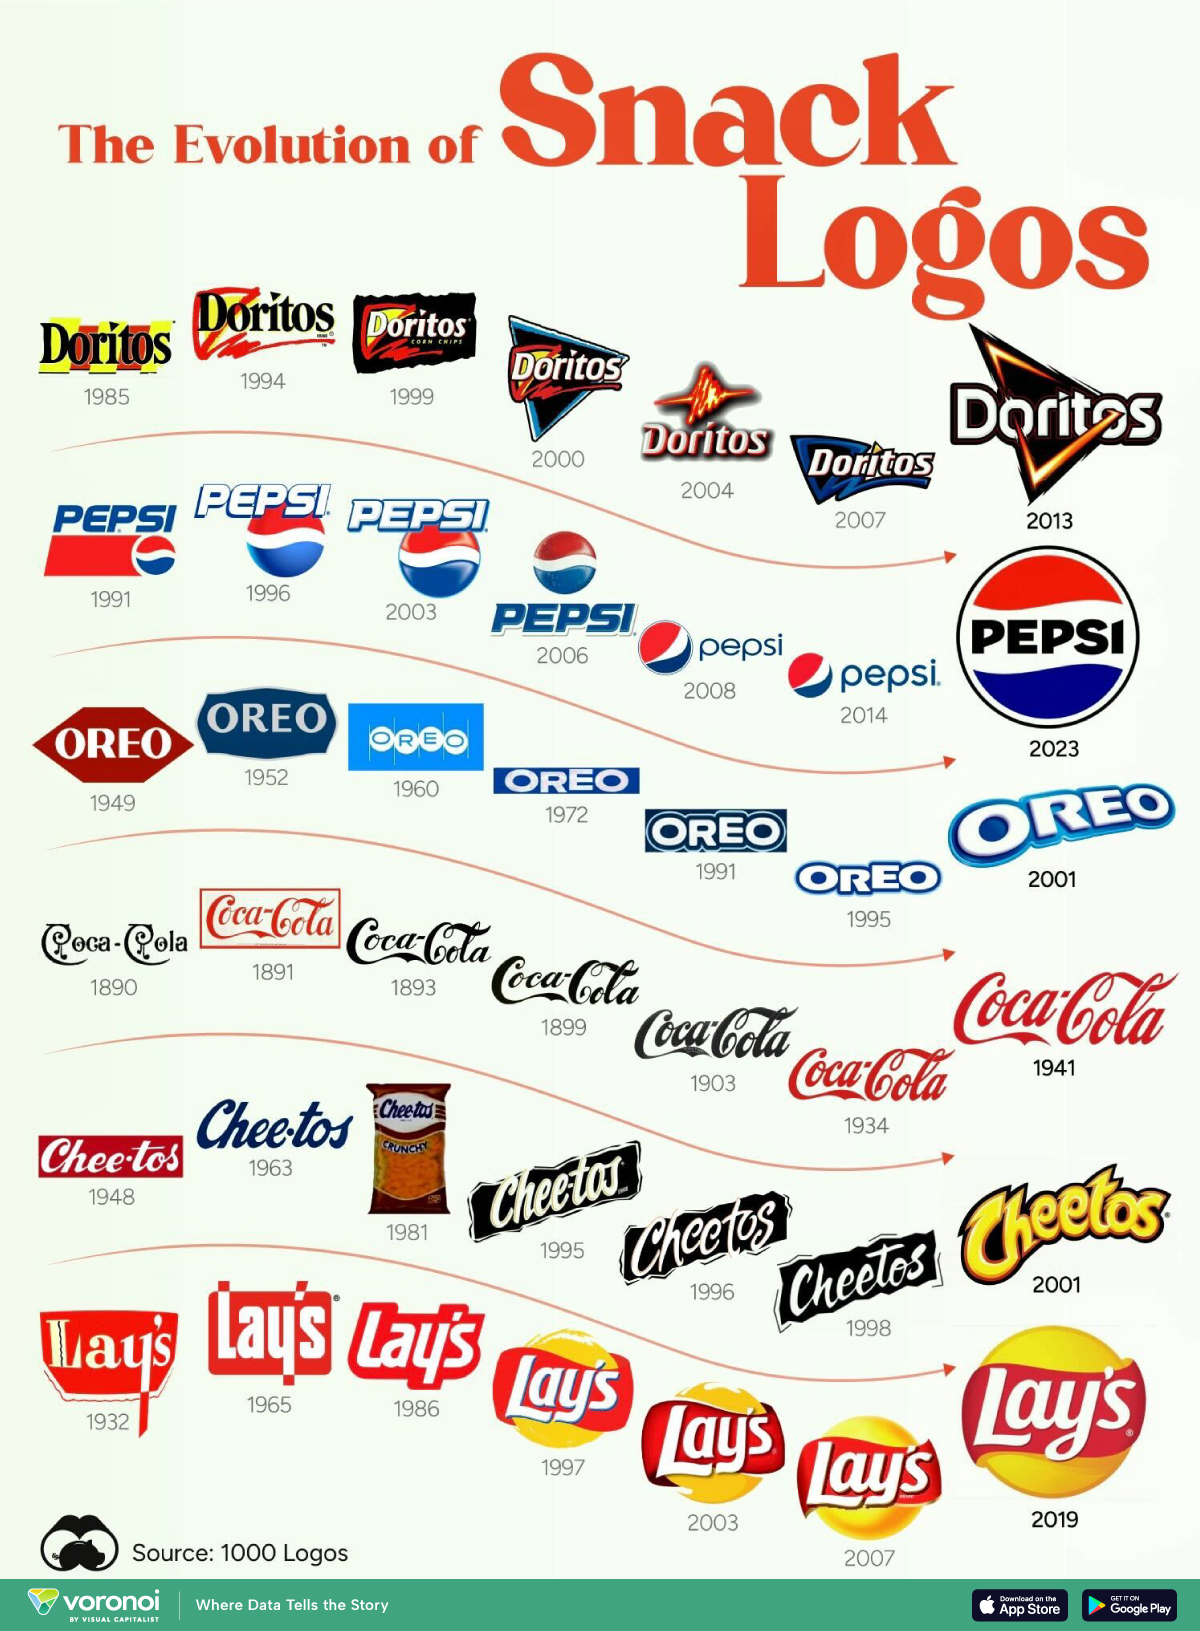
How Popular Snack Brand Logos Have Changed
From Coca-Cola’s evolution since 1890, to Pepsi’s recent nostalgia rebranding, this graphic illustrates the development of logos for popular snack brands.
How Popular Snack Brand Logos Have Changed
This was originally posted on our Voronoi app. Download the app for free on iOS or Android and discover incredible data-driven charts from a variety of trusted sources.
Branding and logos are vital elements of a successful snack product, shaping consumer perceptions, purchasing choices, and fostering long-term brand loyalty.
From Coca-Cola’s evolution since 1890, to Pepsi’s recent nostalgia rebranding, this graphic illustrates the development of logos for popular snack brands. The data is from 1000 Logos.
Pepsi vs. Coke
Pepsi’s latest logo released in 2023 delivered a hit of nostalgia, reverting to the “globe” design of previous decades.
The wordmark is also much bolder, reminiscent of the company’s logo from the early 1900s. Due to the brand’s many logo changes, we weren’t able to fit logos further back than 1991.
In contrast, Coca-Cola, its rival, has kept its iconic script logotype, which first emerged at the end of the 1880s, pretty much untouched since the early 1900s. The current rendition of the symbol was unveiled in 1903, featuring an intensified shade of red by 1934. Since then, the logotype has been refined, but always keeping the same style and mood.
Famous Cookie, Many Logos
Oreo is perhaps the iconic snack brand with the most logo redesigns in history. There have been more than ten different versions of the emblem for the famous cookies.
The very first logo for Oreo was introduced in 1912 and stayed with the brand for almost a decade. It was an elegant and ornate black inscription in all capitals with the first “O” enlarged. Over time, the logo changed to the three-dimensional badge that has identified the cookies since 2001.

-

 Healthcare6 days ago
Life Expectancy by Region (1950-2050F)
-

 Economy2 weeks ago
Ranked: The Top 20 Countries in Debt to China
-

 Politics2 weeks ago
Charted: Trust in Government Institutions by G7 Countries
-

 Energy2 weeks ago
Mapped: The Age of Energy Projects in Interconnection Queues, by State
-

 Mining2 weeks ago
Visualizing Global Gold Production in 2023
-

 Markets2 weeks ago
Visualized: Interest Rate Forecasts for Advanced Economies
-

 Economy1 week ago
The Most Valuable Companies in Major EU Economies
-

 Markets1 week ago
The World’s Fastest Growing Emerging Markets (2024-2029 Forecast)