Mapped: Europe’s GDP Per Capita, by Country
The Growth of a $1,000 Equity Investment, by Stock Market
Mapped: The Most Valuable Company in Each Southeast Asian Country
Visualizing Global Inflation Forecasts (2024-2026)
The World’s Fastest Growing Emerging Markets (2024-2029 Forecast)
Countries With the Highest Rates of Crypto Ownership
Mapped: The Number of AI Startups By Country
All of the Grants Given by the U.S. CHIPS Act
Visualizing AI Patents by Country
How Tech Logos Have Evolved Over Time
Visualizing the Tax Burden of Every U.S. State
Charted: What Frustrates Americans About the Tax System
Ranked: The Top 20 Countries in Debt to China
Charted: Which Country Has the Most Billionaires in 2024?
Charted: Which City Has the Most Billionaires in 2024?
Which Countries Have the Highest Infant Mortality Rates?
Life Expectancy by Region (1950-2050F)
What Causes Preventable Child Deaths?
The Cost of an EpiPen in Major Markets
Charted: Global Tobacco Use by Country and Sex
Who’s Building the Most Solar Energy?
Mapped: The Age of Energy Projects in Interconnection Queues, by State
Ranked: The Top 10 EV Battery Manufacturers in 2023
The World’s Biggest Nuclear Energy Producers
The World’s Biggest Oil Producers in 2023
Mapped: U.S. Immigrants by Region
Mapped: Southeast Asia’s GDP Per Capita, by Country
The Largest Earthquakes in the New York Area (1970-2024)
Mapped: Average Wages Across Europe
Mapped: Asia’s Population Patterns by Density
Visualizing Copper Production by Country in 2023
Where the World’s Aluminum is Smelted, by Country
Visualizing Global Gold Production in 2023
Gold vs. S&P 500: Which Has Grown More Over Five Years?
How People Get Around in America, Europe, and Asia
The Carbon Footprint of Major Travel Methods
Ranking the Top 15 Countries by Carbon Tax Revenue
Ranked: The Countries With the Most Air Pollution in 2023
Top Countries By Forest Growth Since 2001
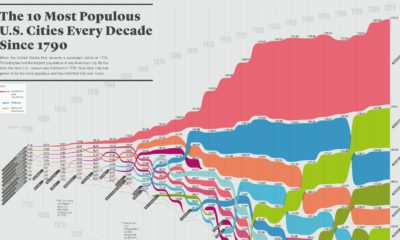
How has the list of the most populous U.S. cities changed over time? This infographic shows the top 10 cities of every decade since the year...
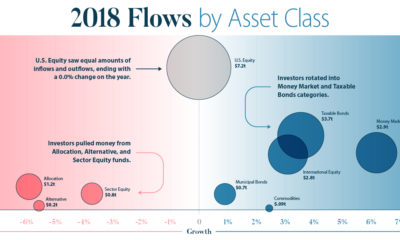
This infographic breaks down investment flows into funds (mutual funds, ETFs, etc.) over the course of 2018 to show how and when investors changed strategies.
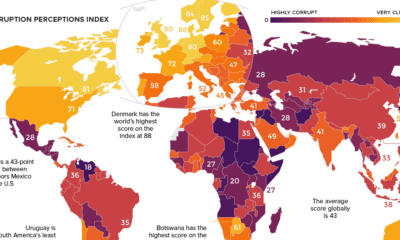
Which countries are the most (and least) corrupt? This world map shows the figures for the Corruption Perceptions Index (CPI) for 2018.
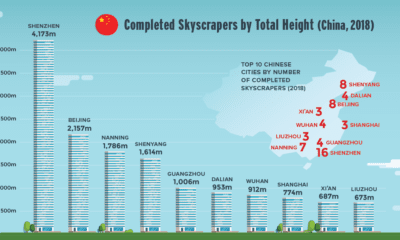
Nearly 150 skyscrapers were completed around the world last year. Find out which cities and regions are growing skyward the fastest.
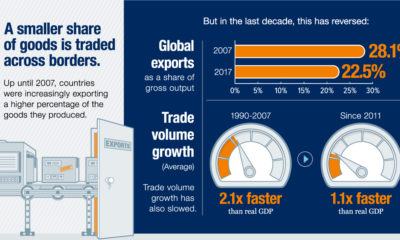
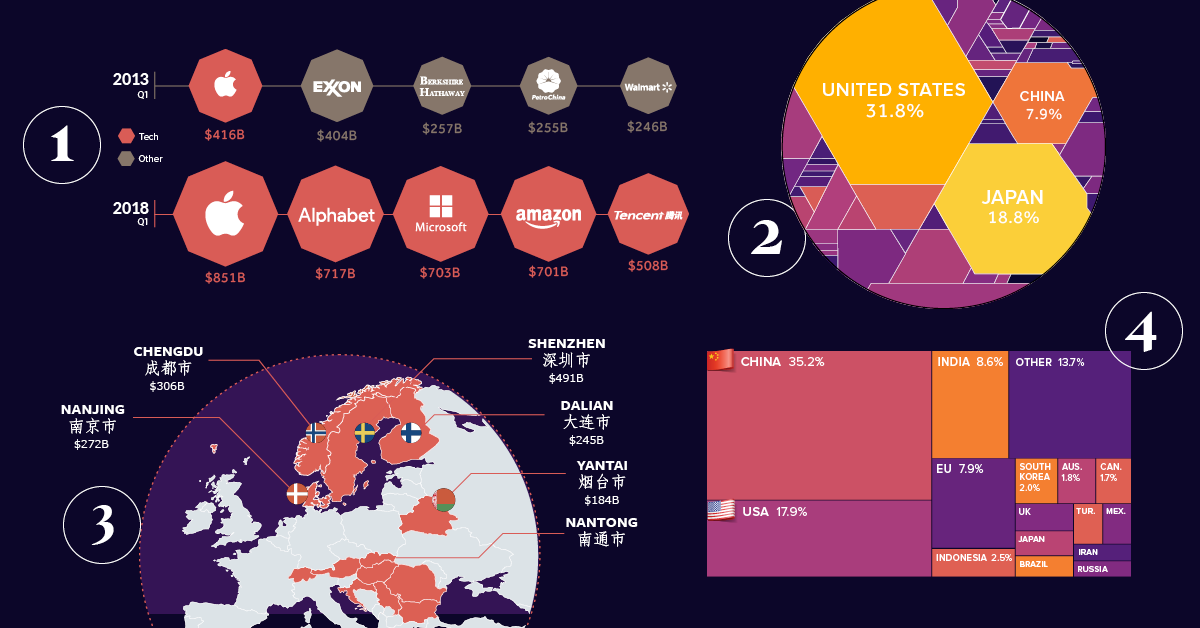
Evidence is growing that the nature of globalization is changing dramatically - and the countries, companies, and workers that benefit are changing as well.
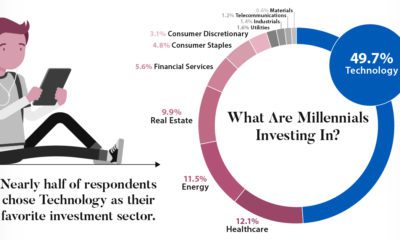
A survey of 9,800 millennials reveals what investing habits will define a generation set to receive a $30 trillion wealth transfer in the coming years.
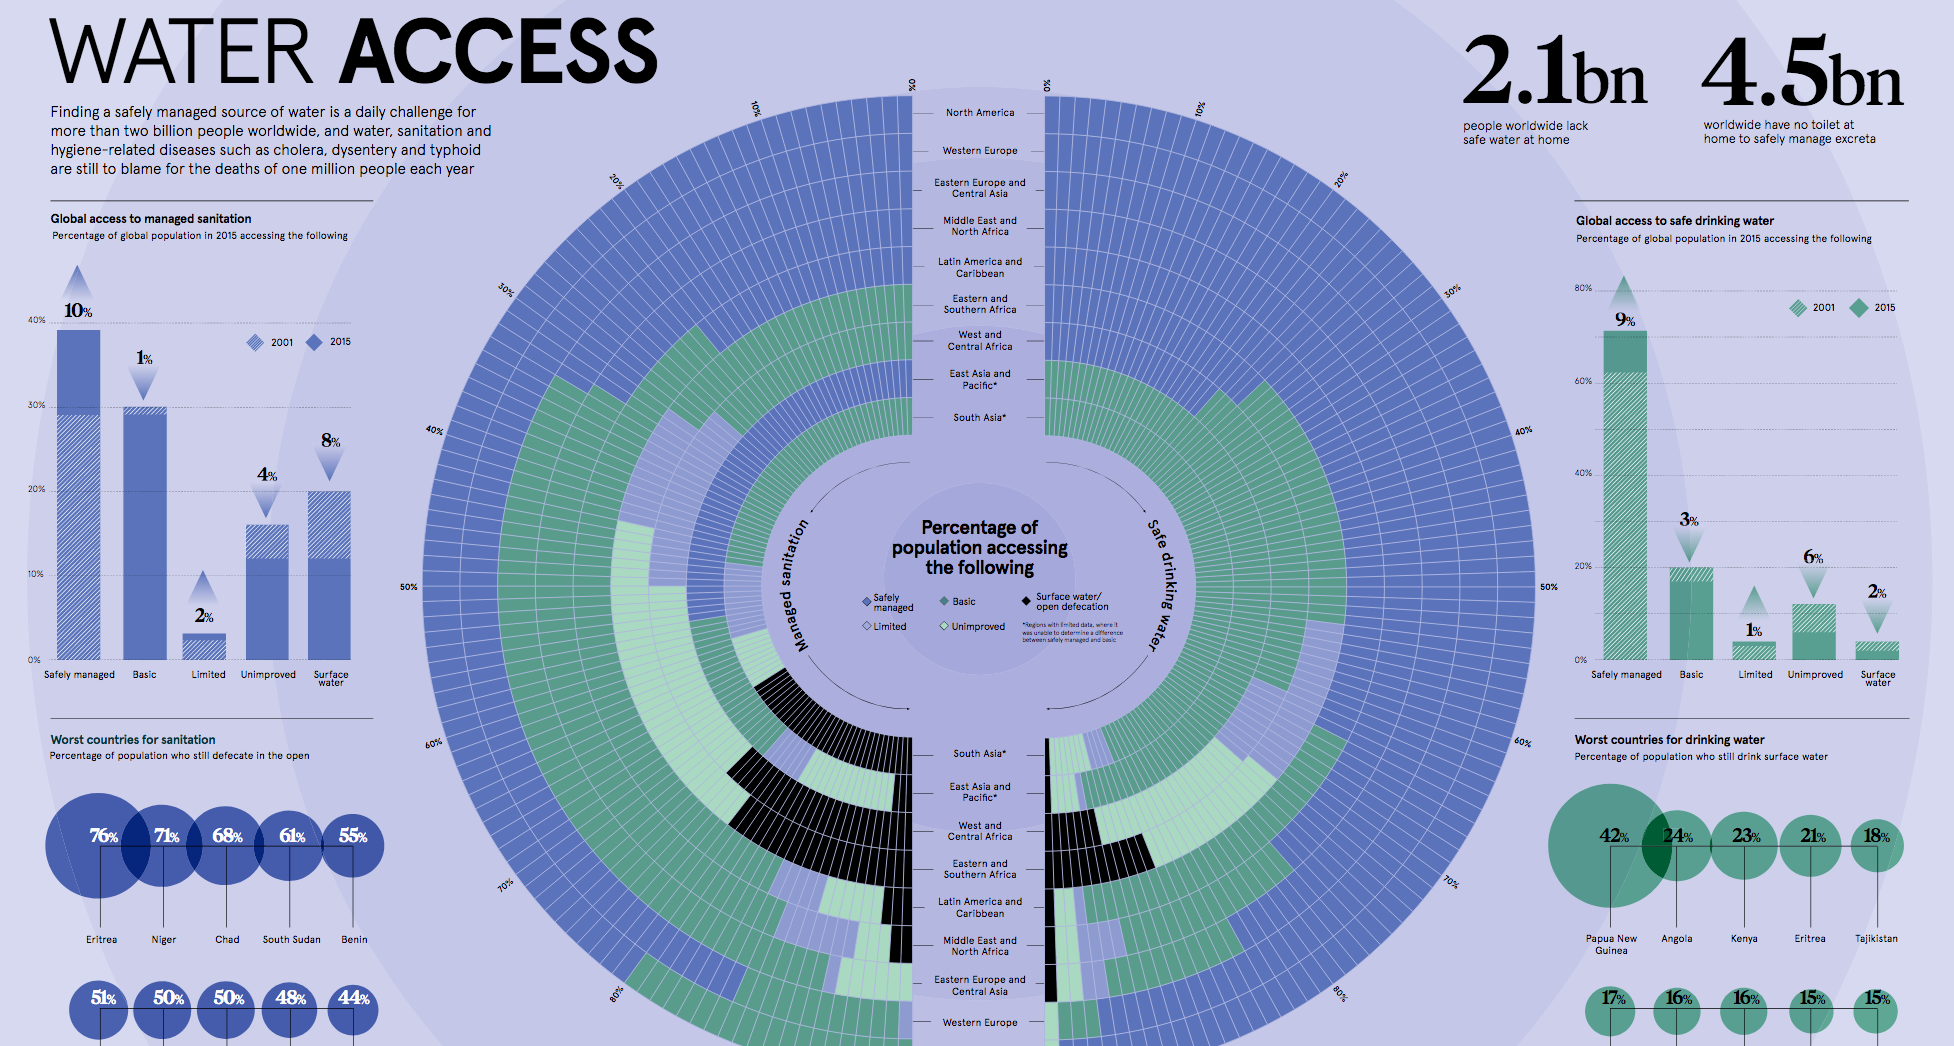
Water is the world’s most precious commodity. Yet, an estimated $260 billion is lost globally each year from the lack of basic water access and sanitation.
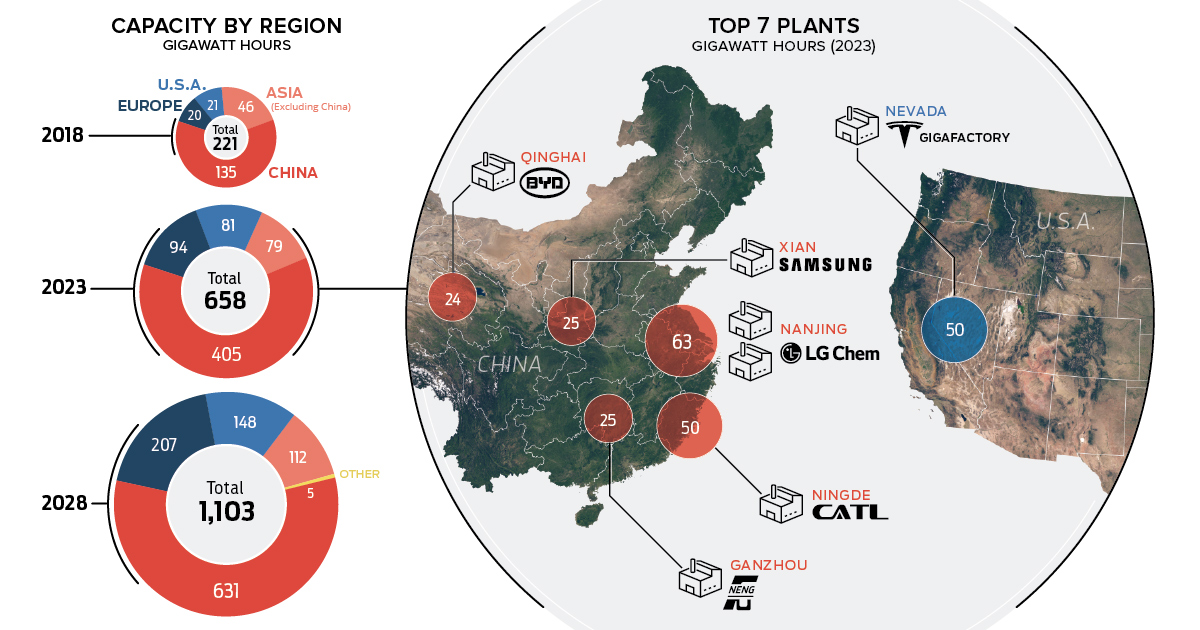
In just a decade, there will be the equivalent lithium-ion battery production capacity of 22 Tesla Gigafactories, with most of that being in China.
This special feature uses powerful charts and infographics to visualize the eight major forces that are shaping our global economy and the business landscape.
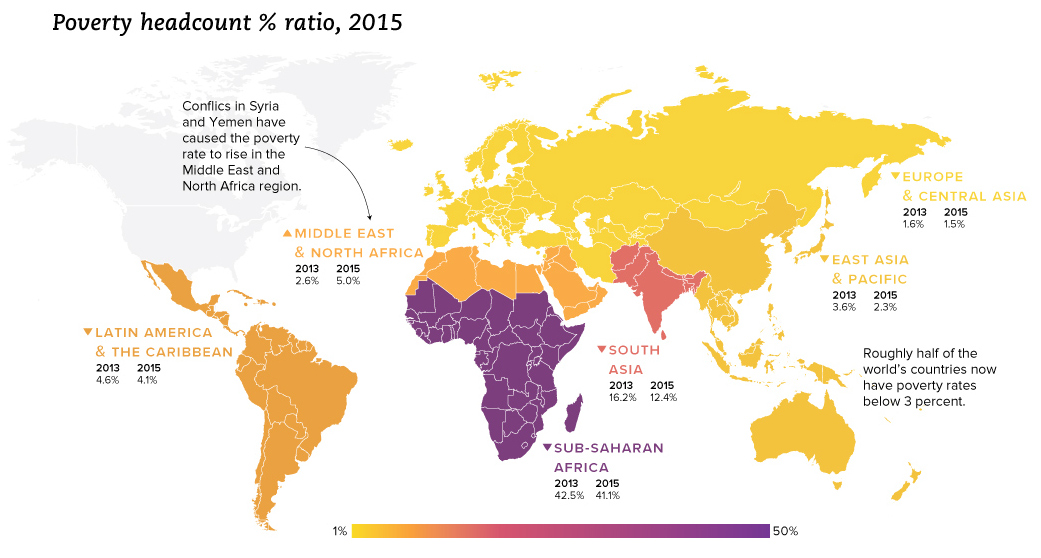
We look at the latest data from the World Bank, which reveals a drop in extreme poverty of 1 billion people globally since the year 1990.