Business
Visualizing the Number of Costco Stores, by Country
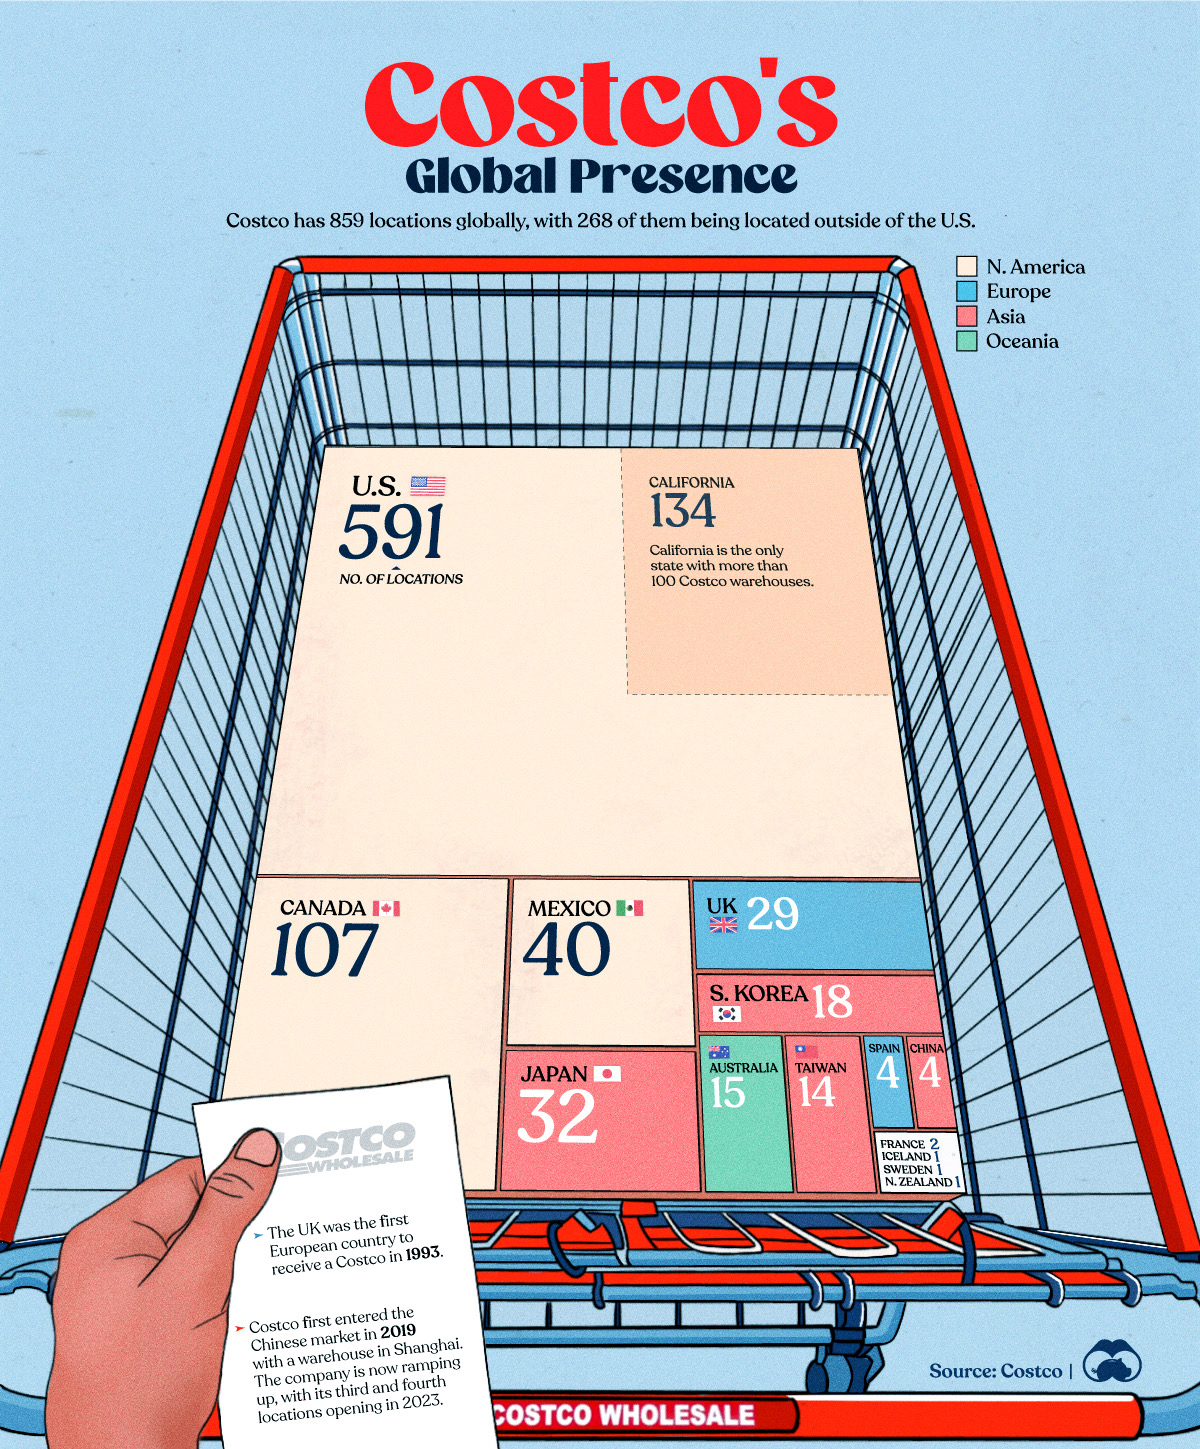


Visualizing Costco’s Global Presence
Costco is a membership-based retail chain founded in 1983 in Seattle, Washington. Best known for its unique warehouse stores and high-quality products, Costco offers everything from electronics to groceries.
Since its founding, Costco has become a major retailer in the U.S., while also greatly expanding its international presence. As of August 2023, the company has 859 locations globally, with a split of 69% domestic (591 stores) and 31% international (268 stores).
In this graphic, we’ve visualized Costco’s global presence with a treemap diagram.
Number of Costco Stores Worldwide
The following table lists the number of Costco stores by country, as of Aug. 17, 2023.
| Country | Number of locations |
|---|---|
| 🇺🇸 U.S. | 591 |
| 🇨🇦 Canada | 107 |
| 🇲🇽 Mexico | 40 |
| 🇯🇵 Japan | 32 |
| 🇬🇧 UK | 29 |
| 🇰🇷 Korea | 18 |
| 🇦🇺 Australia | 15 |
| 🇹🇼 Taiwan | 14 |
| 🇪🇸 Spain | 4 |
| 🇨🇳 China | 4 |
| 🇫🇷 France | 2 |
| 🇮🇸 Iceland | 1 |
| 🇳🇿 New Zealand | 1 |
| 🇸🇪 Sweden | 1 |
| Total | 859 |
From this data we can see that Costco’s biggest non-U.S. markets are Canada, Mexico, and Japan.
In fact, Costco’s first non-U.S. location was opened near Vancouver, British Columbia in 1985. The company expanded to Mexico several years later in 1992, and then Japan in 1999.
Costco has recently turned its attention to China, opening four stores in areas around Shanghai since 2019. Reception was overwhelmingly positive—as CNBC reported, massive crowds at the grand opening of Costco’s first store forced an early closure. The company is planning to grow its Chinese presence even further, with new locations planned for Hangzhou, Shenzhen, and Nanjing.
For context, Costco is hardly the first U.S. retail chain to break into the Chinese market. Walmart first expanded to China in 1996 with a store in Shenzhen, and as of January 2023, operates 365 stores in the country.
The Sweden and New Zealand locations both opened in 2022, showing that Costco’s international expansion is still very much underway.
Number of Costco Stores by State
Focusing on the U.S., here are the number of locations in each state.
| State | Number of Stores |
|---|---|
| California | 134 |
| Texas | 38 |
| Washington | 33 |
| Florida | 31 |
| Illinois | 23 |
| New Jersey | 21 |
| Arizona | 20 |
| New York | 19 |
| Georgia | 17 |
| Virginia | 17 |
| Michigan | 16 |
| Colorado | 16 |
| Utah | 14 |
| Oregon | 13 |
| Minnesota | 13 |
| Ohio | 13 |
| Maryland | 11 |
| Pennsylvania | 11 |
| Wisconsin | 10 |
| North Carolina | 10 |
| Missouri | 9 |
| Connecticut | 8 |
| Nevada | 8 |
| Indiana | 8 |
| Hawaii | 7 |
| Idaho | 7 |
| Massachusetts | 6 |
| South Carolina | 6 |
| Tennessee | 6 |
| Montana | 6 |
| Puerto Rico | 5 |
| Alabama | 4 |
| Oklahoma | 4 |
| Alaska | 4 |
| Iowa | 4 |
| Kentucky | 4 |
| Louisiana | 3 |
| Nebraska | 3 |
| New Mexico | 3 |
| Kansas | 3 |
| North Dakota | 2 |
| Arkansas | 1 |
| Mississippi | 1 |
| South Dakota | 1 |
| Delaware | 1 |
| District of Columbia | 1 |
| Vermont | 1 |
| New Hampshire | 1 |
| Maine | 0 |
| Rhode Island | 0 |
| West Virginia | 0 |
| Wyoming | 0 |
America’s most populous state, California, leads the nation with 134 locations (23% of total). This is likely due to Costco’s business strategy, which relies more on membership fees and sales volume rather than high markups on products. According to analysis by Forbes, the average markup at Costco is estimated to be 11%, while at Walmart it stands at 24%.
This may explain why Maine, Rhode Island, West Virginia, and Wyoming do not have any Costco locations. Most of these states are relatively low in population density, with the exception of Rhode Island which is very small geographically.
Editor’s note: According to local news sources, Maine is set to receive its first Costco location later in 2023.
Local Adaptations
While Costco locations in the U.S. often take the form of a traditional warehouse with ample surface level parking, some stores in other countries break from that formula.
In the Santa Fe neighborhood of Mexico City, the retail space and parking of the Costco lies below ground, while the roof of the building acts as an extension to the adjacent park, featuring sports fields and a green roof.
Vancouver, Canada, is home to an urban Costco, which blends into its high density surroundings and is capped by multiple condo towers.
While the price of the company’s famous hot dog and soda combo may stay the same, the company continues to adapt to changing preferences and new locales.


Brands
How Tech Logos Have Evolved Over Time
From complete overhauls to more subtle tweaks, these tech logos have had quite a journey. Featuring: Google, Apple, and more.


How Tech Logos Have Evolved Over Time
This was originally posted on our Voronoi app. Download the app for free on iOS or Android and discover incredible data-driven charts from a variety of trusted sources.
One would be hard-pressed to find a company that has never changed its logo. Granted, some brands—like Rolex, IBM, and Coca-Cola—tend to just have more minimalistic updates. But other companies undergo an entire identity change, thus necessitating a full overhaul.
In this graphic, we visualized the evolution of prominent tech companies’ logos over time. All of these brands ranked highly in a Q1 2024 YouGov study of America’s most famous tech brands. The logo changes are sourced from 1000logos.net.
How Many Times Has Google Changed Its Logo?
Google and Facebook share a 98% fame rating according to YouGov. But while Facebook’s rise was captured in The Social Network (2010), Google’s history tends to be a little less lionized in popular culture.
For example, Google was initially called “Backrub” because it analyzed “back links” to understand how important a website was. Since its founding, Google has undergone eight logo changes, finally settling on its current one in 2015.
| Company | Number of Logo Changes |
|---|---|
| 8 | |
| HP | 8 |
| Amazon | 6 |
| Microsoft | 6 |
| Samsung | 6 |
| Apple | 5* |
Note: *Includes color changes. Source: 1000Logos.net
Another fun origin story is Microsoft, which started off as Traf-O-Data, a traffic counter reading company that generated reports for traffic engineers. By 1975, the company was renamed. But it wasn’t until 2012 that Microsoft put the iconic Windows logo—still the most popular desktop operating system—alongside its name.
And then there’s Samsung, which started as a grocery trading store in 1938. Its pivot to electronics started in the 1970s with black and white television sets. For 55 years, the company kept some form of stars from its first logo, until 1993, when the iconic encircled blue Samsung logo debuted.
Finally, Apple’s first logo in 1976 featured Isaac Newton reading under a tree—moments before an apple fell on his head. Two years later, the iconic bitten apple logo would be designed at Steve Jobs’ behest, and it would take another two decades for it to go monochrome.

-

 Education1 week ago
How Hard Is It to Get Into an Ivy League School?
-

 Technology2 weeks ago
Ranked: Semiconductor Companies by Industry Revenue Share
-

 Markets2 weeks ago
Ranked: The World’s Top Flight Routes, by Revenue
-

 Demographics2 weeks ago
Population Projections: The World’s 6 Largest Countries in 2075
-

 Markets2 weeks ago
The Top 10 States by Real GDP Growth in 2023
-

 Demographics2 weeks ago
The Smallest Gender Wage Gaps in OECD Countries
-

 Economy2 weeks ago
Where U.S. Inflation Hit the Hardest in March 2024
-

 Environment2 weeks ago
Top Countries By Forest Growth Since 2001