Technology
Mapped: The Most Innovative Countries in the World in 2022
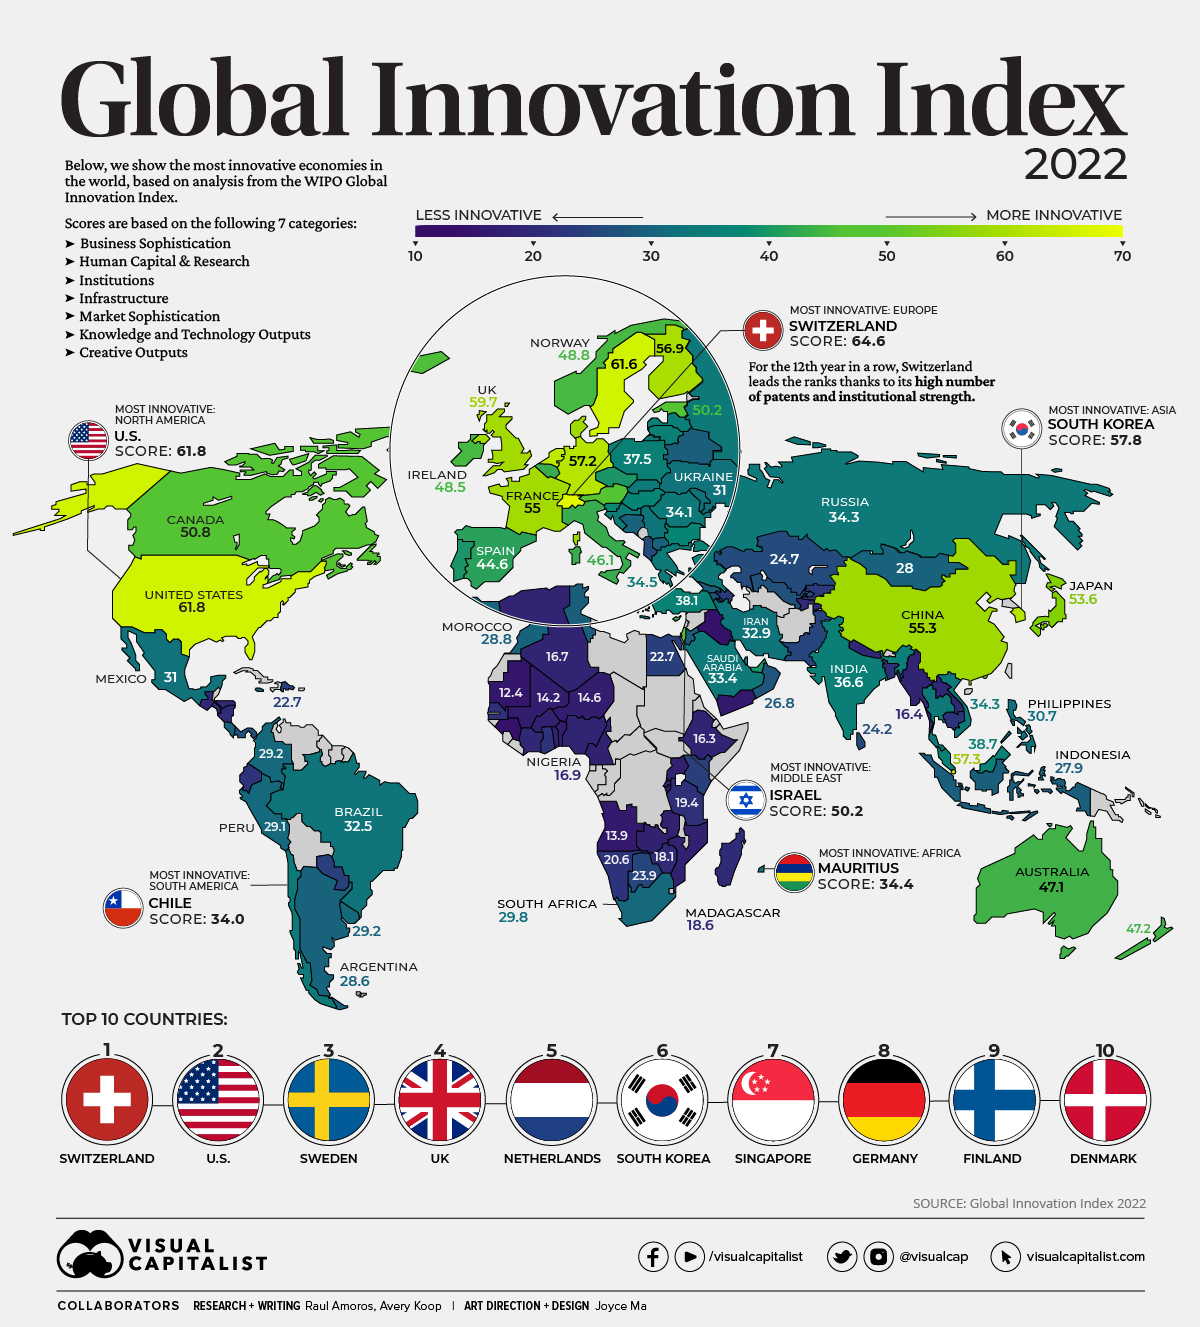


The Most Innovative Countries in the World 2022
Since 2000, global investment in research and development (R&D) has tripled to $2.4 trillion.
R&D spend is also casting a wider global net. In 1960, the U.S. made up nearly 70% of global R&D spending, and by 2020 this had fallen to 30%. From job creation and public health to national security and industrial competitiveness, R&D plays a vital role in a country’s economic growth and innovation, impacting nearly every corner of society—either directly or indirectly.
Along with R&D spend, other key ingredients play an important role in driving progress and innovation. These include technological adoption, scientific research, and venture capital activity, among others.
The above infographic ranks the world’s most innovative economies using data from the UN’s WIPO Global Innovation Index.
What Defines an Innovative Economy?
Innovation is inherently challenging to quantify, but the Global Innovation Index is a longstanding attempt to do just that.
The framework used for the index was designed to create a more complete analysis, comprising of 81 indicators across seven categories to calculate a country’s score:
| 7 Categories | Example Indicators |
|---|---|
| 🧳 Business Sophistication | Business R&D spend, net inflows of foreign direct investment |
| 📈 Market Sophistication | Size of economy’s GDP, intensity of local market competition |
| 🛣️ Infrastructure | Road, hospital, school construction, energy efficiency |
| 👩🏫 Human Capital & Research | Government funding per pupil, quality of scientific and research institutions |
| 🏛️ Institutions | Political stability and safety, ease of starting a business |
| 💡 Creative Outputs | Most valuable brands, industrial design applications, trademark applications |
| 👨💻 Knowledge and Technology Outputs | Patent applications, increase in labor productivity, spending on software |
As the above table shows, the framework aims to identify indicators that foster an innovative environment and breakthrough technologies.
It’s worth noting that each country’s overall innovation score is a mix of these categories, and countries with similar scores can be strong in different areas.
The 50 Most Innovative Countries in 2022
Switzerland ranks at the top for the 12th year in a row—above the U.S., South Korea, and Israel.
For many, this may come as a surprise. However, the country’s intellectual property rules are considered world-class, and they are complemented by strong collaboration between universities and industry. In addition, the country attracts top talent thanks to its high quality of living.
At second is the United States, which is a top spender on R&D at over $700 billion per year. Globally, four of the five top R&D spending companies are in America: Amazon ($42.7 billion), Alphabet ($27.6 billion), Microsoft ($19.3 billion), and Apple ($18.8 billion).
| Rank | Country / Region | Score |
|---|---|---|
| 1 | 🇨🇭 Switzerland | 64.6 |
| 2 | 🇺🇲 U.S. | 61.8 |
| 3 | 🇸🇪 Sweden | 61.6 |
| 4 | 🇬🇧 United Kingdom | 59.7 |
| 5 | 🇳🇱 Netherlands | 58.0 |
| 6 | 🇰🇷 South Korea | 57.8 |
| 7 | 🇸🇬 Singapore | 57.3 |
| 8 | 🇩🇪 Germany | 57.2 |
| 9 | 🇫🇮 Finland | 56.9 |
| 10 | 🇩🇰 Denmark | 55.9 |
| 11 | 🇨🇳 China | 55.3 |
| 12 | 🇫🇷 France | 55.0 |
| 13 | 🇯🇵 Japan | 53.6 |
| 14 | 🇭🇰 Hong Kong | 51.8 |
| 15 | 🇨🇦 Canada | 50.8 |
| 16 | 🇮🇱 Israel | 50.2 |
| 17 | 🇦🇹 Austria | 50.2 |
| 18 | 🇪🇪 Estonia | 50.2 |
| 19 | 🇱🇺 Luxembourg | 49.8 |
| 20 | 🇮🇸 Iceland | 49.5 |
| 21 | 🇲🇹 Malta | 49.1 |
| 22 | 🇳🇴 Norway | 48.8 |
| 23 | 🇮🇪 Ireland | 48.5 |
| 24 | 🇳🇿 New Zealand | 47.2 |
| 25 | 🇦🇺 Australia | 47.1 |
| 26 | 🇧🇪 Belgium | 46.9 |
| 27 | 🇨🇾 Cyprus | 46.2 |
| 28 | 🇮🇹 Italy | 46.1 |
| 29 | 🇪🇸 Spain | 44.6 |
| 30 | 🇨🇿 Czech Republic | 42.8 |
| 31 | 🇦🇪 United Arab Emirates | 42.1 |
| 32 | 🇵🇹 Portugal | 42.1 |
| 33 | 🇸🇮 Slovenia | 40.6 |
| 34 | 🇭🇺 Hungary | 39.8 |
| 35 | 🇧🇬 Bulgaria | 39.5 |
| 36 | 🇲🇾 Malaysia | 38.7 |
| 37 | 🇹🇷 Turkey | 38.1 |
| 38 | 🇵🇱 Poland | 37.5 |
| 39 | 🇱🇹 Lithuania | 37.4 |
| 40 | 🇮🇳 India | 36.6 |
| 41 | 🇱🇻 Latvia | 36.5 |
| 42 | 🇭🇷 Croatia | 35.6 |
| 43 | 🇹🇭 Thailand | 34.9 |
| 44 | 🇬🇷 Greece | 34.5 |
| 45 | 🇲🇺 Mauritius | 34.4 |
| 46 | 🇸🇰 Slovakia | 34.3 |
| 47 | 🇷🇺 Russia | 34.3 |
| 48 | 🇻🇳 Vietnam | 34.3 |
| 49 | 🇷🇴 Romania | 34.1 |
| 50 | 🇨🇱 Chile | 34.0 |
Countries across Europe also feature prominently in the top 10, including Sweden (#3), the United Kingdom (#4) and the Netherlands (#5).
South Korea (#6), is known for its high R&D intensity. This is driven by its industrial conglomerates, known as chaebols, that are generally family-owned. Samsung and LG are among its largest companies, known for their high degree of corporate-academic collaboration.
Below, we will take a closer look at the most innovative countries by region.
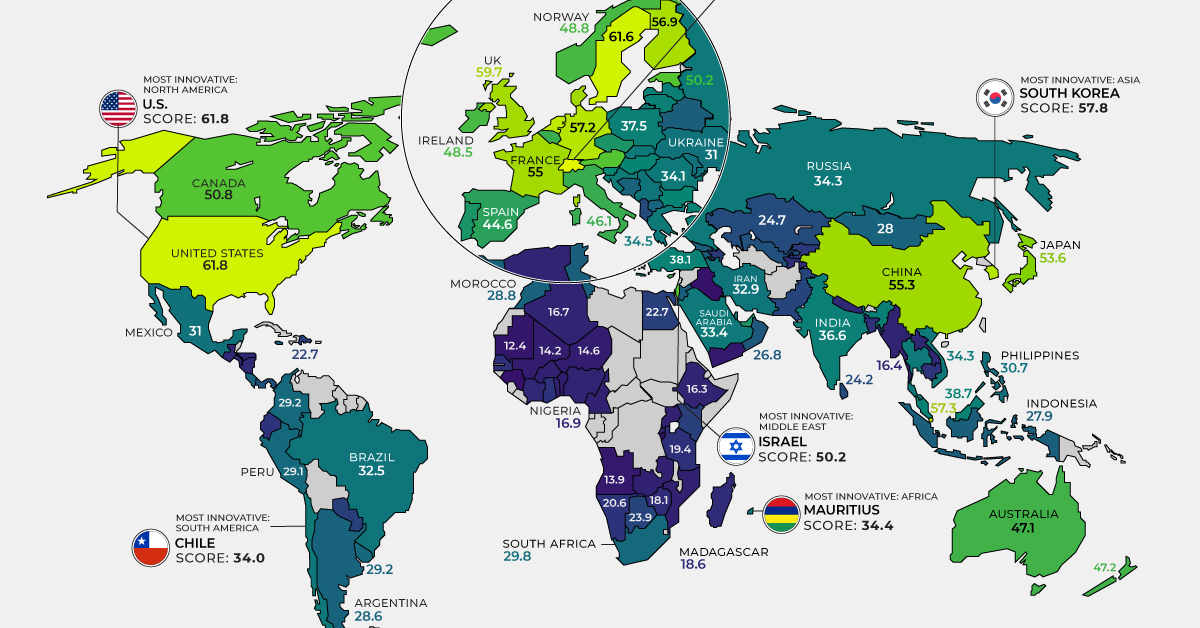
North America
In North America, the U.S. ranks highest. The country has long been known as a global leader in innovation, with a strong track record of introducing new ideas and technologies that have transformed the way we live and work. The U.S. ranks #1 in a number of indicators, including university-industry R&D collaboration and intangible asset intensity.
Ranking second in the region is Canada (Global rank: #15). Across all countries, it ranks first on measures of joint venture and strategic alliances per billion dollars of GDP (PPP) and number of venture capital (VC) recipients per billion dollars of GDP (PPP). In 2021, VC investment topped $14.7 billion across 752 deals.
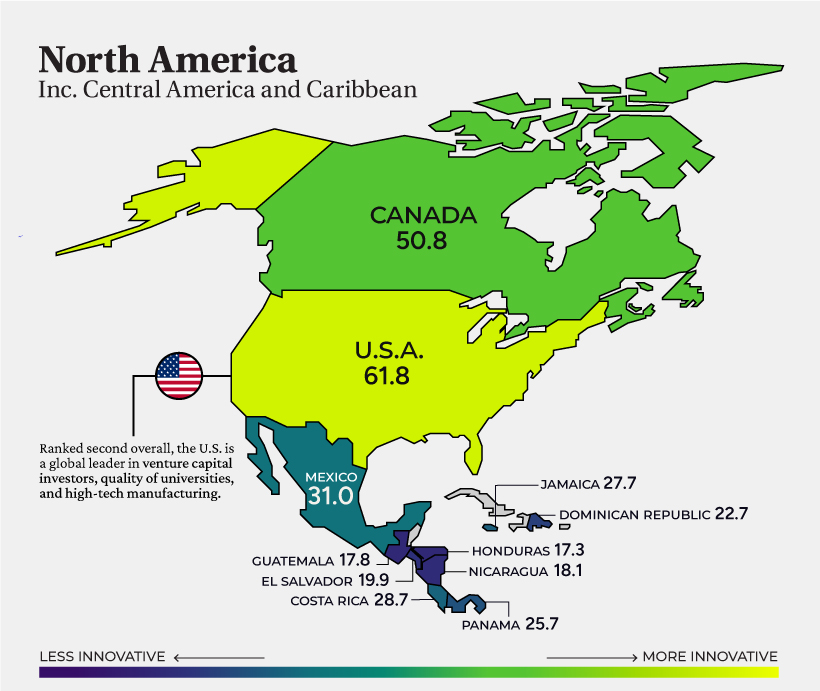
Another interesting example is Honduras (#113). Driving innovation in the country is a new economic zoning experiment called Zones for Economic Development and Employment (ZEDEs).
To date, these zones have attracted about a quarter of a billion dollars in private investment funding and have created thousands of new jobs.
South America
Chile (#50) ranks first across the region, thanks to its promising tech sector. To date, it is home to an estimated 8,000 tech companies. The country also has the highest scale of mobile connectivity in the region. In late 2021, it launched the first 5G network in South America.
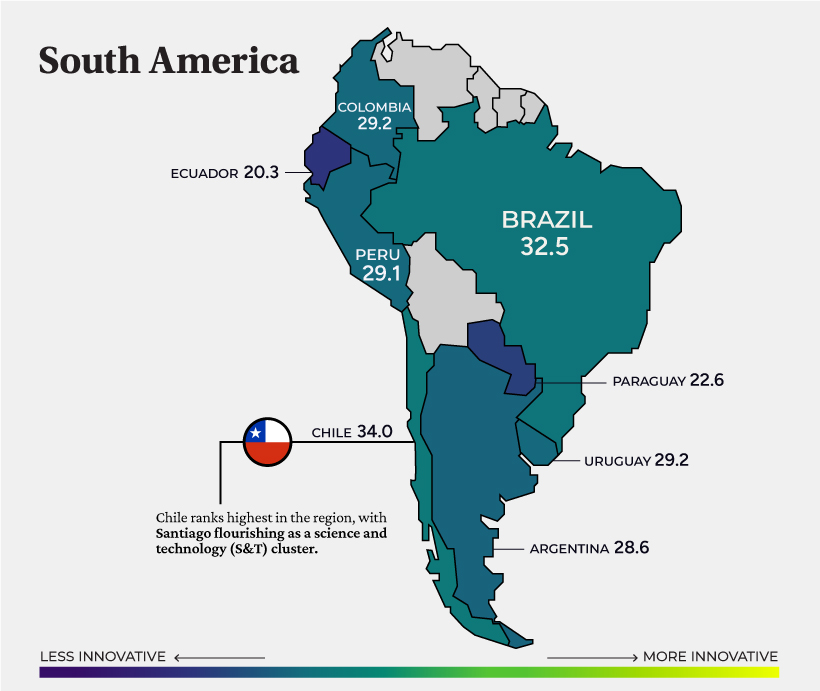
Following Chile is Brazil (#54), which saw a record number of IPOs in 2021 that were valued at nearly $7 billion.
Middle East and Central Asia
As the highest ranked in the region, Israel (#16) is the sole country globally that spends over 5% of GDP on R&D. Overall, it is a global leader in patent applications and information and communication technology (ICT) services exports.
For context, the country’s density of start-ups per capita is 16 times that of Europe.
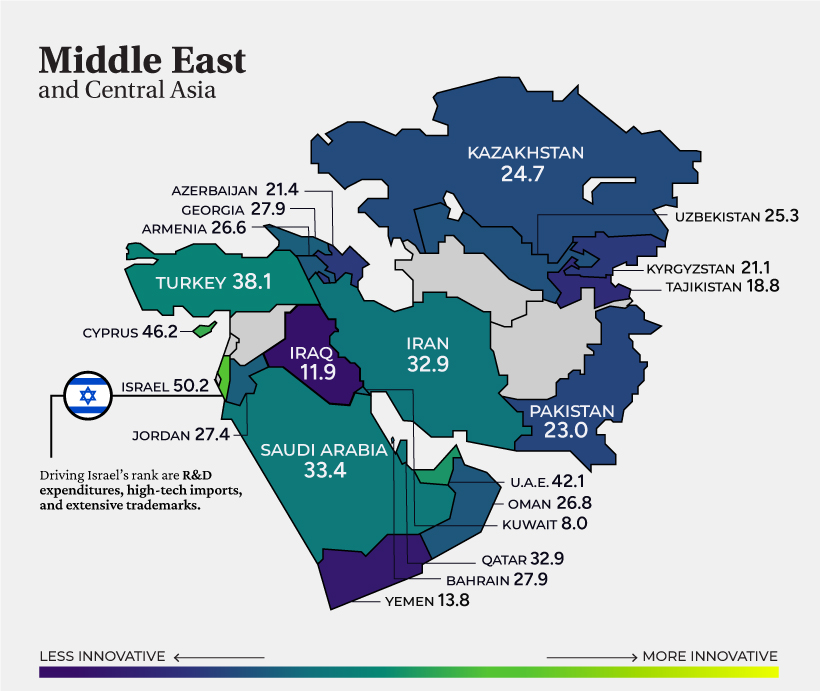
The small island nation of Cyprus (#27) follows in second, supported by government funding focused on start-ups. Meanwhile, Turkey (#37) in fourth, is home to six unicorns*, fostered by its development of a megatech corridor through Istanbul to Izmir.
*A unicorn is a privately-held startup that has a valuation of over $1 billion.
Europe
With 15 of the top 25 economies in the world, Europe is a powerhouse for fostering innovative ecosystems.
The continent is also a leader in social progress, equality, and life satisfaction. The region scores 30 on inequality according to the Gini Index compared to 41 for America.
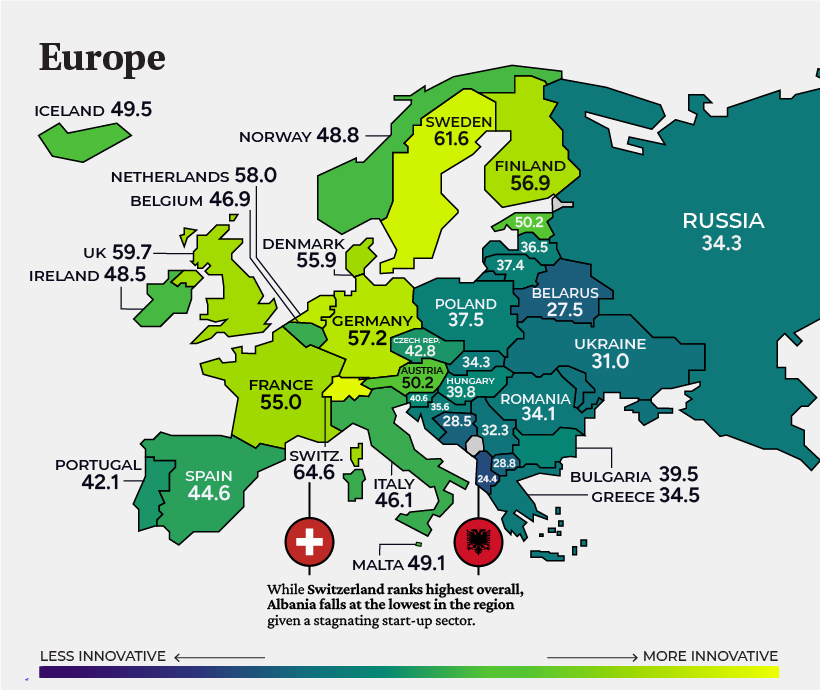
For many, technological output isn’t the first thing that comes to mind when they think of Europe, but VC deals surged over 53% in 2021. London, Berlin, and Paris were leading cities for VC activity.
East Asia and Oceania
South Korea (#6) ranks highest across East Asia and Oceania, and has established itself as a leader in technology and innovation on the global stage. Through its New Deal initiative, the government is spearheading projects on smart healthcare, AI, and smart industrial complexes. At the same time, it is accelerating the construction of eco-friendly infrastructure and renewable energy.
South Korea’s Hyundai and its subsidiary Kia have made considerable ground in electric vehicle (EV) production, comprising 9% of the U.S. EV market, the second-highest share after Tesla.
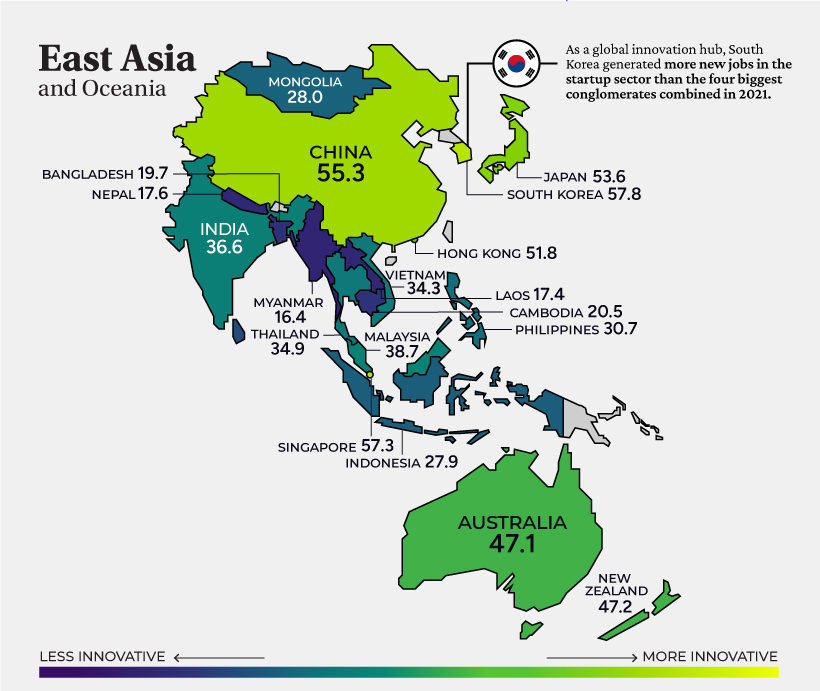
China sits just outside the global top 10, and now ranks #1 in multiple indicators, including labor productivity growth and trademarks by origin. China’s economic output per employed worker increased an impressive 4.2% annually from 2011 to 2019, on average.
Africa
The highest ranked in Africa is the island nation of Mauritius (#45).
Underscoring its rank is the strength of its institutions and market sophistication. Meanwhile, the government is accelerating investment in tech incubators, research-business collaboration, and tax incentives for R&D investment.
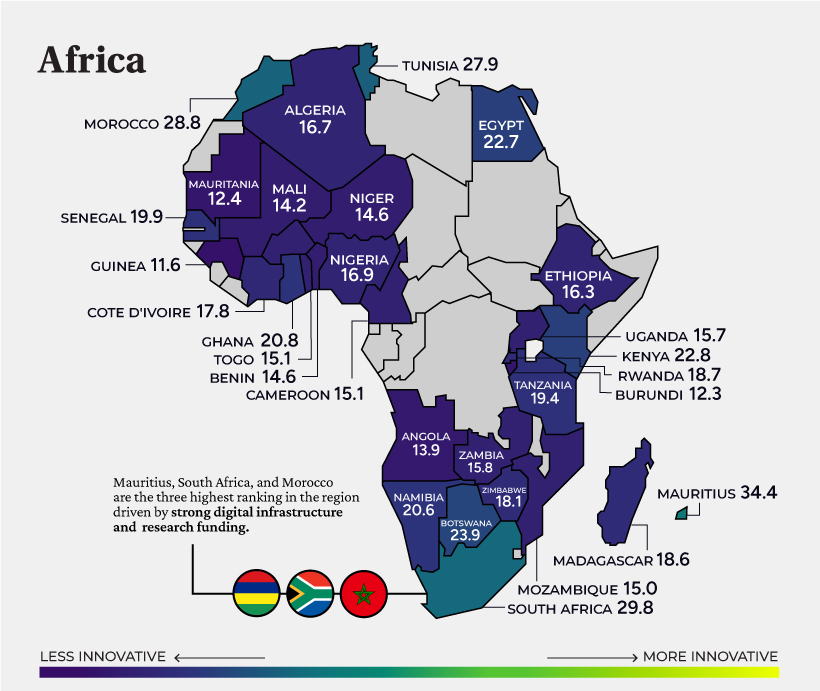
South Africa (#61) follows Mauritius on the list, with the city of Cape Town attracting a proposed $300 million Amazon headquarters.
Panasonic opened their headquarters in Cape Town in 2018. Oracle, IBM, Google, and Microsoft also have offices in the country’s expanding tech hub.


Technology
All of the Grants Given by the U.S. CHIPS Act
Intel, TSMC, and more have received billions in subsidies from the U.S. CHIPS Act in 2024.


All of the Grants Given by the U.S. CHIPS Act
This was originally posted on our Voronoi app. Download the app for free on iOS or Android and discover incredible data-driven charts from a variety of trusted sources.
This visualization shows which companies are receiving grants from the U.S. CHIPS Act, as of April 25, 2024. The CHIPS Act is a federal statute signed into law by President Joe Biden that authorizes $280 billion in new funding to boost domestic research and manufacturing of semiconductors.
The grant amounts visualized in this graphic are intended to accelerate the production of semiconductor fabrication plants (fabs) across the United States.
Data and Company Highlights
The figures we used to create this graphic were collected from a variety of public news sources. The Semiconductor Industry Association (SIA) also maintains a tracker for CHIPS Act recipients, though at the time of writing it does not have the latest details for Micron.
| Company | Federal Grant Amount | Anticipated Investment From Company |
|---|---|---|
| 🇺🇸 Intel | $8,500,000,000 | $100,000,000,000 |
| 🇹🇼 TSMC | $6,600,000,000 | $65,000,000,000 |
| 🇰🇷 Samsung | $6,400,000,000 | $45,000,000,000 |
| 🇺🇸 Micron | $6,100,000,000 | $50,000,000,000 |
| 🇺🇸 GlobalFoundries | $1,500,000,000 | $12,000,000,000 |
| 🇺🇸 Microchip | $162,000,000 | N/A |
| 🇬🇧 BAE Systems | $35,000,000 | N/A |
BAE Systems was not included in the graphic due to size limitations
Intel’s Massive Plans
Intel is receiving the largest share of the pie, with $8.5 billion in grants (plus an additional $11 billion in government loans). This grant accounts for 22% of the CHIPS Act’s total subsidies for chip production.
From Intel’s side, the company is expected to invest $100 billion to construct new fabs in Arizona and Ohio, while modernizing and/or expanding existing fabs in Oregon and New Mexico. Intel could also claim another $25 billion in credits through the U.S. Treasury Department’s Investment Tax Credit.
TSMC Expands its U.S. Presence
TSMC, the world’s largest semiconductor foundry company, is receiving a hefty $6.6 billion to construct a new chip plant with three fabs in Arizona. The Taiwanese chipmaker is expected to invest $65 billion into the project.
The plant’s first fab will be up and running in the first half of 2025, leveraging 4 nm (nanometer) technology. According to TrendForce, the other fabs will produce chips on more advanced 3 nm and 2 nm processes.
The Latest Grant Goes to Micron
Micron, the only U.S.-based manufacturer of memory chips, is set to receive $6.1 billion in grants to support its plans of investing $50 billion through 2030. This investment will be used to construct new fabs in Idaho and New York.

-

 Debt1 week ago
How Debt-to-GDP Ratios Have Changed Since 2000
-

 Markets2 weeks ago
Ranked: The World’s Top Flight Routes, by Revenue
-

 Countries2 weeks ago
Population Projections: The World’s 6 Largest Countries in 2075
-

 Markets2 weeks ago
The Top 10 States by Real GDP Growth in 2023
-

 Demographics2 weeks ago
The Smallest Gender Wage Gaps in OECD Countries
-

 United States2 weeks ago
Where U.S. Inflation Hit the Hardest in March 2024
-

 Green2 weeks ago
Top Countries By Forest Growth Since 2001
-

 United States2 weeks ago
Ranked: The Largest U.S. Corporations by Number of Employees