Energy
Mapped: Global Energy Prices, by Country in 2022
How to use: Arrows on side navigate between each type of energy.

Mapped: Global Energy Prices, by Country in 2022
This was originally posted on Elements. Sign up to the free mailing list to get beautiful visualizations on natural resource megatrends in your email every week.
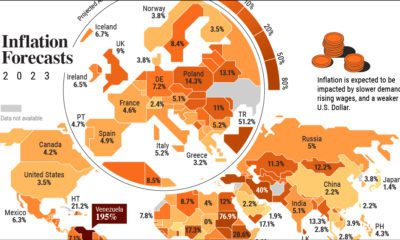
For some countries, energy prices hit historic levels in 2022.
Gasoline, electricity, and natural gas prices skyrocketed as Russia’s invasion of Ukraine ruptured global energy supply chains. Households and businesses are facing higher energy bills amid extreme price volatility. Uncertainty surrounding the war looms large, and winter heating costs are projected to soar.
Given the global consequences of the energy crisis, the above infographic shows the price of energy for households by country, with data from GlobalPetrolPrices.com.
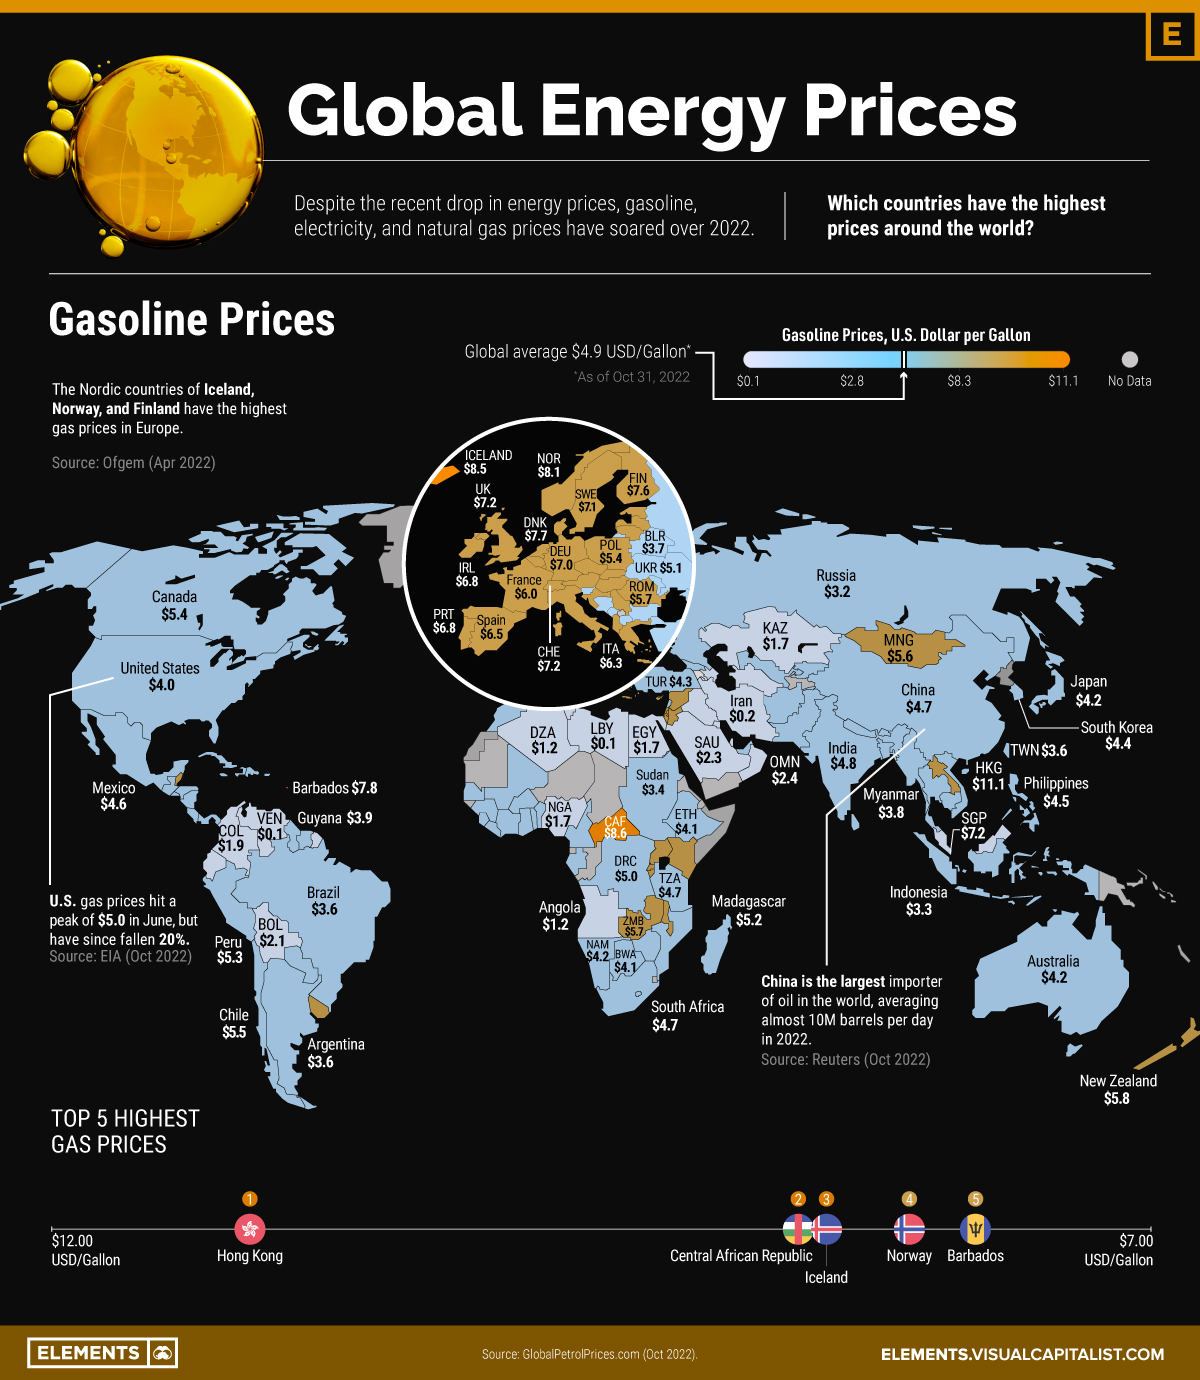
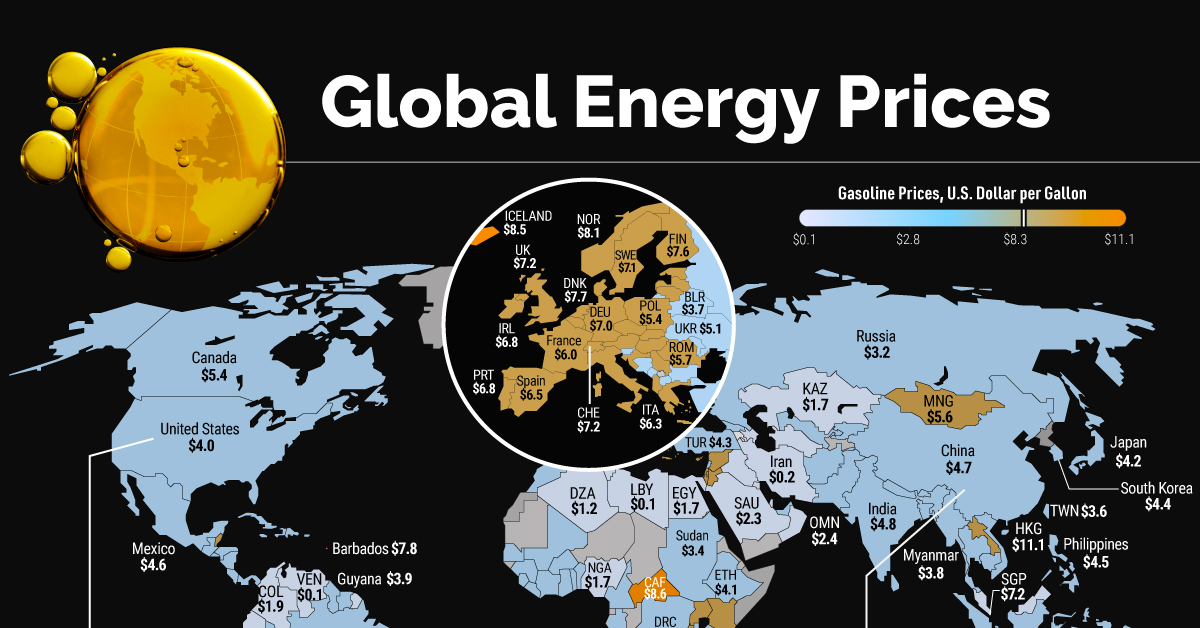
1. Global Energy Prices: Gasoline
Which countries and regions pay the most for a gallon of gas?
| Rank | Country/ Region | Gasoline Prices (USD per Gallon) |
|---|---|---|
| 1 | 🇭🇰 Hong Kong | $11.1 |
| 2 | 🇨🇫 Central African Republic | $8.6 |
| 3 | 🇮🇸 Iceland | $8.5 |
| 4 | 🇳🇴 Norway | $8.1 |
| 5 | 🇧🇧 Barbados | $7.8 |
| 6 | 🇩🇰 Denmark | $7.7 |
| 7 | 🇬🇷 Greece | $7.6 |
| 8 | 🇫🇮 Finland | $7.6 |
| 9 | 🇳🇱 Netherlands | $7.6 |
| 10 | 🇧🇪 Belgium | $7.4 |
| 11 | 🇬🇧 United Kingdom | $7.2 |
| 12 | 🇪🇪 Estonia | $7.2 |
| 13 | 🇨🇭 Switzerland | $7.2 |
| 14 | 🇸🇬 Singapore | $7.2 |
| 15 | 🇸🇪 Sweden | $7.1 |
| 16 | 🇸🇨 Seychelles | $7.1 |
| 17 | 🇮🇱 Israel | $7.0 |
| 18 | 🇩🇪 Germany | $7.0 |
| 19 | 🇺🇾 Uruguay | $7.0 |
| 20 | 🇼🇫 Wallis and Futuna | $7.0 |
| 21 | 🇱🇮 Liechtenstein | $6.9 |
| 22 | 🇮🇪 Ireland | $6.8 |
| 23 | 🇵🇹 Portugal | $6.8 |
| 24 | 🇱🇻 Latvia | $6.7 |
| 25 | 🇧🇿 Belize | $6.7 |
| 26 | 🇦🇱 Albania | $6.6 |
| 27 | 🇦🇹 Austria | $6.6 |
| 28 | 🇲🇨 Monaco | $6.6 |
| 29 | 🇪🇸 Spain | $6.5 |
| 30 | 🇨🇿 Czech Republic | $6.5 |
| 31 | 🇲🇼 Malawi | $6.5 |
| 32 | 🇰🇾 Cayman Islands | $6.4 |
| 33 | 🇸🇰 Slovakia | $6.4 |
| 34 | 🇲🇺 Mauritius | $6.3 |
| 35 | 🇱🇺 Luxembourg | $6.3 |
| 36 | 🇱🇹 Lithuania | $6.3 |
| 37 | 🇦🇩 Andorra | $6.3 |
| 38 | 🇮🇹 Italy | $6.3 |
| 39 | 🇺🇬 Uganda | $6.2 |
| 40 | 🇭🇺 Hungary | $6.2 |
| 41 | 🇯🇴 Jordan | $6.2 |
| 42 | 🇸🇾 Syria | $6.1 |
| 43 | 🇫🇷 France | $6.0 |
| 44 | 🇧🇮 Burundi | $6.0 |
| 45 | 🇧🇸 Bahamas | $6.0 |
| 46 | 🇳🇿 New Zealand | $5.8 |
| 47 | 🇸🇲 San Marino | $5.8 |
| 48 | 🇭🇷 Croatia | $5.8 |
| 49 | 🇷🇴 Romania | $5.7 |
| 50 | 🇾🇹 Mayotte | $5.7 |
| 51 | 🇷🇼 Rwanda | $5.7 |
| 52 | 🇿🇲 Zambia | $5.7 |
| 53 | 🇷🇸 Serbia | $5.7 |
| 54 | 🇱🇦 Laos | $5.6 |
| 55 | 🇲🇳 Mongolia | $5.6 |
| 56 | 🇰🇪 Kenya | $5.6 |
| 57 | 🇨🇾 Cyprus | $5.6 |
| 58 | 🇯🇲 Jamaica | $5.5 |
| 59 | 🇲🇰 Northern Macedonia | $5.5 |
| 60 | 🇨🇱 Chile | $5.5 |
| 61 | 🇧🇦 Bosnia | $5.5 |
| 62 | 🇱🇨 Saint Lucia | $5.4 |
| 63 | 🇵🇱 Poland | $5.4 |
| 64 | 🇩🇴 Dominican Republic | $5.4 |
| 65 | 🇨🇦 Canada | $5.4 |
| 66 | 🇲🇦 Morocco | $5.4 |
| 67 | 🇦🇼 Aruba | $5.4 |
| 68 | 🇸🇮 Slovenia | $5.3 |
| 69 | 🇧🇬 Bulgaria | $5.3 |
| 70 | 🇵🇪 Peru | $5.3 |
| 71 | 🇱🇰 Sri Lanka | $5.3 |
| 72 | 🇨🇷 Costa Rica | $5.2 |
| 73 | 🇲🇬 Madagascar | $5.2 |
| 74 | 🇬🇳 Guinea | $5.2 |
| 75 | 🇳🇵 Nepal | $5.2 |
| 76 | 🇲🇿 Mozambique | $5.2 |
| 77 | 🇳🇮 Nicaragua | $5.2 |
| 78 | 🇲🇱 Mali | $5.1 |
| 79 | 🇸🇳 Senegal | $5.1 |
| 80 | 🇺🇦 Ukraine | $5.1 |
| 81 | 🇩🇲 Dominica | $5.0 |
| 82 | 🇲🇪 Montenegro | $5.0 |
| 83 | 🇲🇹 Malta | $5.0 |
| 84 | 🇲🇩 Moldova | $5.0 |
| 85 | 🇨🇩 DR Congo | $5.0 |
| 86 | 🇨🇼 Curacao | $4.9 |
| 87 | 🇨🇻 Cape Verde | $4.9 |
| 88 | 🇧🇩 Bangladesh | $4.9 |
| 89 | 🇱🇷 Liberia | $4.8 |
| 90 | 🇰🇭 Cambodia | $4.8 |
| 91 | 🇮🇳 India | $4.8 |
| 92 | 🇨🇺 Cuba | $4.8 |
| 93 | 🇭🇳 Honduras | $4.7 |
| 94 | 🇬🇪 Georgia | $4.7 |
| 95 | 🇿🇦 South Africa | $4.7 |
| 96 | 🇹🇿 Tanzania | $4.7 |
| 97 | 🇫🇯 Fiji | $4.7 |
| 98 | 🇨🇳 China | $4.7 |
| 99 | 🇲🇽 Mexico | $4.6 |
| 100 | 🇬🇹 Guatemala | $4.6 |
Source: GlobalPetrolPrices.com. As of October 31, 2022. Represents average household prices.
At an average $11.10 per gallon, households in Hong Kong pay the highest for gasoline in the world—more than double the global average. Both high gas taxes and steep land costs are primary factors behind high gas prices.
Like Hong Kong, the Central African Republic has high gas costs, at $8.60 per gallon. As a net importer of gasoline, the country has faced increased price pressures since the war in Ukraine.
Households in Iceland, Norway, and Denmark face the highest gasoline costs in Europe. Overall, Europe has seen inflation hit 10% in September, driven by the energy crisis.
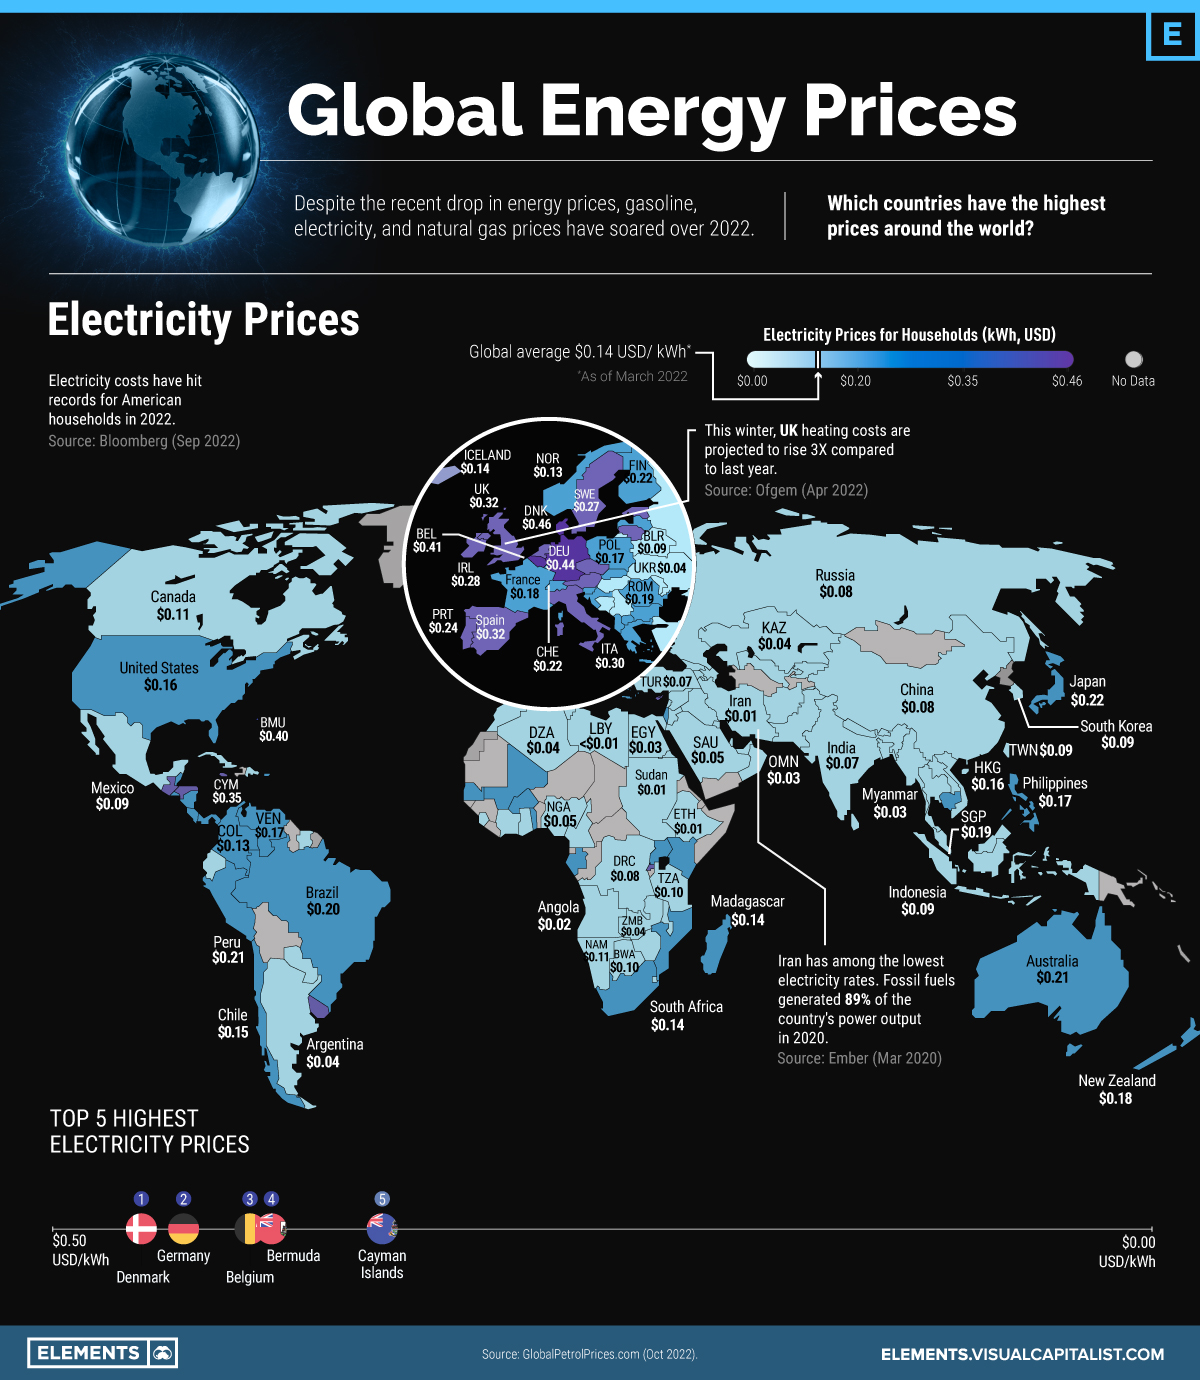
2. Global Energy Prices: Electricity
Extreme volatility is also being seen in electricity prices.
The majority of the highest household electricity prices are in Europe, where Denmark, Germany, and Belgium’s prices are about double that of France and Greece. For perspective, electricity prices in many countries in Europe are more than twice or three times the global average of $0.14 per kilowatt-hour.
Over the first quarter of 2022, household electricity prices in the European Union jumped 32% compared to the year before.
| Rank | Country/ Region | Electricity Prices (kWh, USD) |
|---|---|---|
| 1 | 🇩🇰 Denmark | $0.46 |
| 2 | 🇩🇪 Germany | $0.44 |
| 3 | 🇧🇪 Belgium | $0.41 |
| 4 | 🇧🇲 Bermuda | $0.40 |
| 5 | 🇰🇾 Cayman Islands | $0.35 |
| 6 | 🇯🇲 Jamaica | $0.34 |
| 7 | 🇬🇧 United Kingdom | $0.32 |
| 8 | 🇪🇸 Spain | $0.32 |
| 9 | 🇳🇱 Netherlands | $0.32 |
| 10 | 🇧🇧 Barbados | $0.32 |
| 11 | 🇪🇪 Estonia | $0.32 |
| 12 | 🇱🇹 Lithuania | $0.31 |
| 13 | 🇦🇹 Austria | $0.31 |
| 14 | 🇮🇹 Italy | $0.30 |
| 15 | 🇨🇿 Czech Republic | $0.29 |
| 16 | 🇨🇻 Cape Verde | $0.28 |
| 17 | 🇮🇪 Ireland | $0.28 |
| 18 | 🇸🇪 Sweden | $0.27 |
| 19 | 🇧🇸 Bahamas | $0.26 |
| 20 | 🇬🇹 Guatemala | $0.26 |
| 21 | 🇱🇮 Liechtenstein | $0.26 |
| 22 | 🇨🇾 Cyprus | $0.25 |
| 23 | 🇷🇼 Rwanda | $0.25 |
| 24 | 🇭🇳 Honduras | $0.24 |
| 25 | 🇺🇾 Uruguay | $0.24 |
| 26 | 🇵🇹 Portugal | $0.24 |
| 27 | 🇸🇻 El Salvador | $0.23 |
| 28 | 🇱🇻 Latvia | $0.22 |
| 29 | 🇫🇮 Finland | $0.22 |
| 30 | 🇱🇺 Luxembourg | $0.22 |
| 31 | 🇧🇿 Belize | $0.22 |
| 32 | 🇯🇵 Japan | $0.22 |
| 33 | 🇨🇭 Switzerland | $0.22 |
| 34 | 🇵🇪 Peru | $0.21 |
| 35 | 🇰🇪 Kenya | $0.21 |
| 36 | 🇦🇺 Australia | $0.21 |
| 37 | 🇧🇷 Brazil | $0.20 |
| 38 | 🇲🇱 Mali | $0.20 |
| 39 | 🇸🇬 Singapore | $0.19 |
| 40 | 🇷🇴 Romania | $0.19 |
| 41 | 🇧🇫 Burkina Faso | $0.19 |
| 42 | 🇸🇮 Slovenia | $0.19 |
| 43 | 🇬🇦 Gabon | $0.19 |
| 44 | 🇸🇰 Slovakia | $0.19 |
| 45 | 🇦🇼 Aruba | $0.19 |
| 46 | 🇬🇷 Greece | $0.19 |
| 47 | 🇫🇷 France | $0.18 |
| 48 | 🇳🇿 New Zealand | $0.18 |
| 49 | 🇹🇬 Togo | $0.18 |
| 50 | 🇳🇮 Nicaragua | $0.17 |
| 51 | 🇻🇪 Venezuela | $0.17 |
| 52 | 🇵🇦 Panama | $0.17 |
| 53 | 🇵🇭 Philippines | $0.17 |
| 54 | 🇵🇱 Poland | $0.17 |
| 55 | 🇮🇱 Israel | $0.16 |
| 56 | 🇺🇲 U.S. | $0.16 |
| 57 | 🇺🇬 Uganda | $0.16 |
| 58 | 🇭🇰 Hong Kong | $0.16 |
| 59 | 🇸🇳 Senegal | $0.16 |
| 60 | 🇲🇴 Macao | $0.15 |
| 61 | 🇨🇱 Chile | $0.15 |
| 62 | 🇰🇭 Cambodia | $0.15 |
| 63 | 🇿🇦 South Africa | $0.14 |
| 64 | 🇲🇺 Mauritius | $0.14 |
| 65 | 🇲🇬 Madagascar | $0.14 |
| 66 | 🇭🇷 Croatia | $0.14 |
| 67 | 🇮🇸 Iceland | $0.14 |
| 68 | 🇳🇴 Norway | $0.13 |
| 69 | 🇲🇹 Malta | $0.13 |
| 70 | 🇲🇿 Mozambique | $0.13 |
| 71 | 🇨🇴 Colombia | $0.13 |
| 72 | 🇧🇬 Bulgaria | $0.12 |
| 73 | 🇲🇻 Maldives | $0.12 |
| 74 | 🇨🇷 Costa Rica | $0.12 |
| 75 | 🇨🇦 Canada | $0.11 |
| 76 | 🇲🇼 Malawi | $0.11 |
| 77 | 🇨🇮 Ivory Coast | $0.11 |
| 78 | 🇳🇦 Namibia | $0.11 |
| 79 | 🇲🇦 Morocco | $0.11 |
| 80 | 🇹🇭 Thailand | $0.10 |
| 81 | 🇦🇲 Armenia | $0.10 |
| 82 | 🇯🇴 Jordan | $0.10 |
| 83 | 🇹🇿 Tanzania | $0.10 |
| 84 | 🇸🇿 Swaziland | $0.10 |
| 85 | 🇪🇨 Ecuador | $0.10 |
| 86 | 🇧🇼 Botswana | $0.10 |
| 87 | 🇩🇴 Dominican Republic | $0.10 |
| 88 | 🇲🇰 Northern Macedonia | $0.10 |
| 89 | 🇦🇱 Albania | $0.10 |
| 90 | 🇱🇸 Lesotho | $0.09 |
| 91 | 🇸🇱 Sierra Leone | $0.09 |
| 92 | 🇮🇩 Indonesia | $0.09 |
| 93 | 🇧🇾 Belarus | $0.09 |
| 94 | 🇭🇺 Hungary | $0.09 |
| 95 | 🇧🇦 Bosnia & Herzegovina | $0.09 |
| 96 | 🇹🇼 Taiwan | $0.09 |
| 97 | 🇰🇷 South Korea | $0.09 |
| 98 | 🇲🇽 Mexico | $0.09 |
| 99 | 🇷🇸 Serbia | $0.09 |
| 100 | 🇨🇩 DR Congo | $0.08 |
Source: GlobalPetrolPrices.com. As of March 31, 2022. Represents average household prices.
In the U.S., consumer electricity prices have increased nearly 16% annually compared to September last year, the highest increase in over four decades, fueling higher inflation.
However, households are more sheltered from the impact of Russian supply disruptions due to the U.S. being a net exporter of energy.
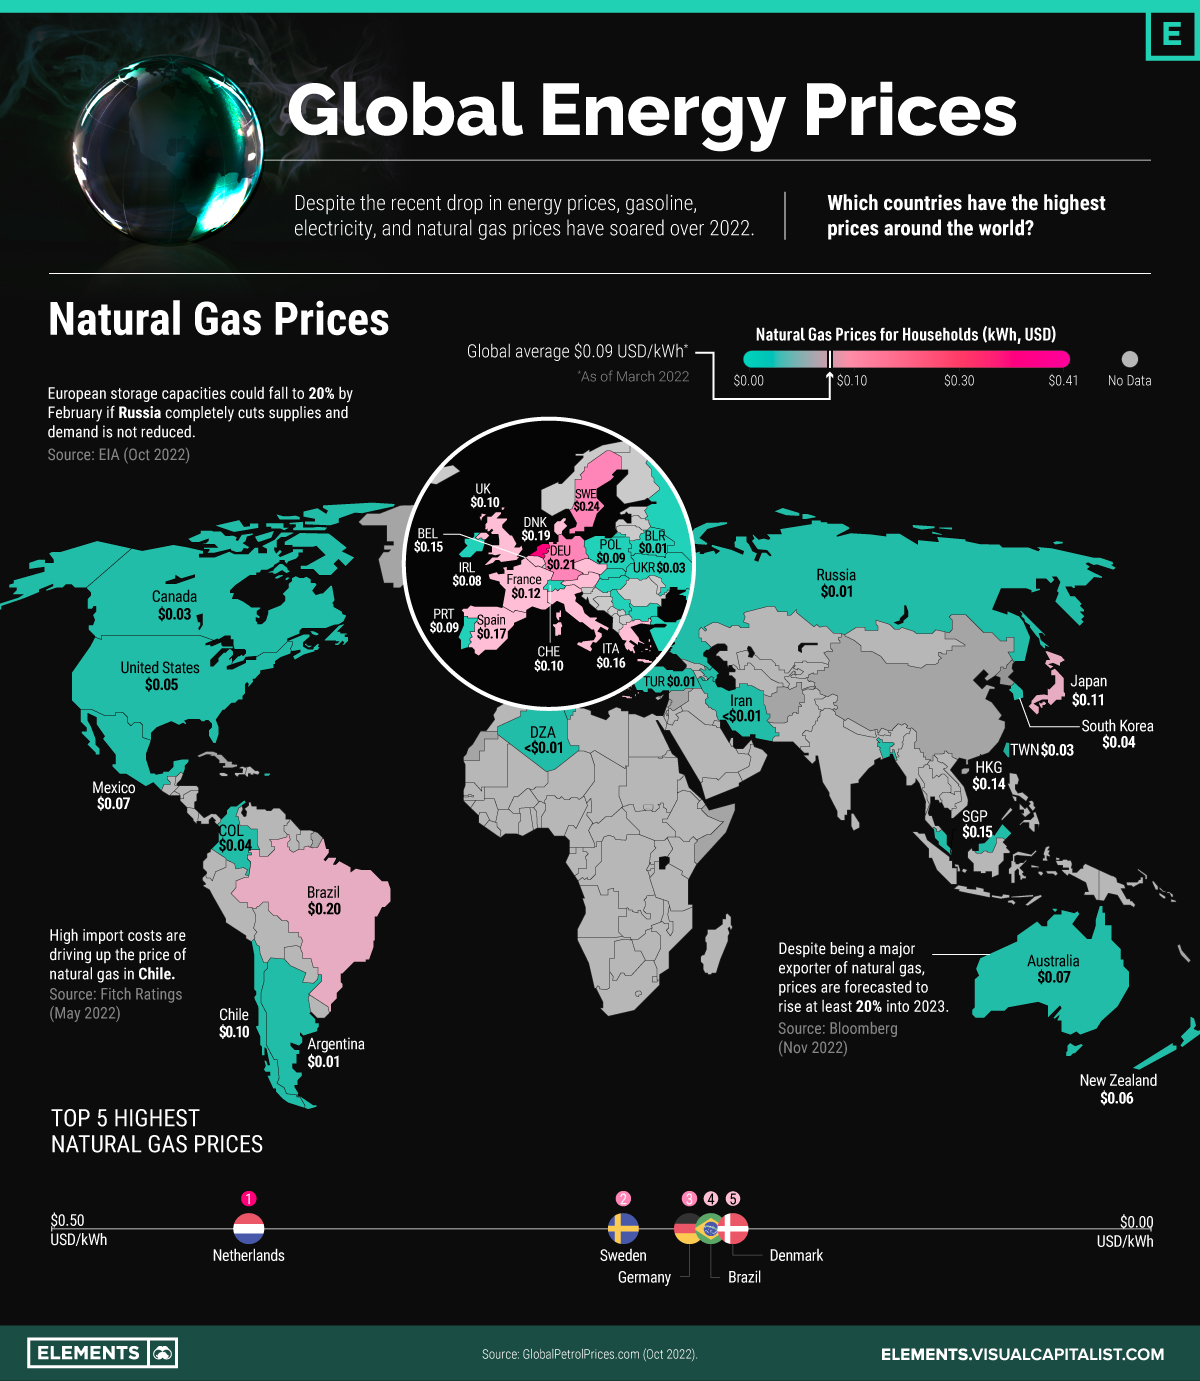
3. Global Energy Prices: Natural Gas
Eight of the 10 highest natural gas prices globally fall in Europe, with the Netherlands at the top. Overall, European natural gas prices have spiked sixfold in a year since the invasion of Ukraine.
| Rank | Country/ Region | Natural Gas Prices (kWh, USD) |
|---|---|---|
| 1 | 🇳🇱 Netherlands | $0.41 |
| 2 | 🇸🇪 Sweden | $0.24 |
| 3 | 🇩🇪 Germany | $0.21 |
| 4 | 🇧🇷 Brazil | $0.20 |
| 5 | 🇩🇰 Denmark | $0.19 |
| 6 | 🇪🇸 Spain | $0.17 |
| 7 | 🇮🇹 Italy | $0.16 |
| 8 | 🇦🇹 Austria | $0.16 |
| 9 | 🇸🇬 Singapore | $0.15 |
| 10 | 🇧🇪 Belgium | $0.15 |
| 11 | 🇭🇰 Hong Kong | $0.14 |
| 12 | 🇨🇿 Czech Republic | $0.14 |
| 13 | 🇬🇷 Greece | $0.12 |
| 14 | 🇫🇷 France | $0.12 |
| 15 | 🇯🇵 Japan | $0.11 |
| 16 | 🇬🇧 United Kingdom | $0.10 |
| 17 | 🇨🇭 Switzerland | $0.10 |
| 18 | 🇨🇱 Chile | $0.10 |
| 19 | 🇵🇹 Portugal | $0.09 |
| 20 | 🇧🇧 Barbados | $0.09 |
| 21 | 🇵🇱 Poland | $0.09 |
| 22 | 🇧🇬 Bulgaria | $0.09 |
| 23 | 🇮🇪 Ireland | $0.08 |
| 24 | 🇦🇺 Australia | $0.07 |
| 25 | 🇲🇽 Mexico | $0.07 |
| 26 | 🇳🇿 New Zealand | $0.06 |
| 27 | 🇸🇰 Slovakia | $0.06 |
| 28 | 🇺🇲 U.S. | $0.05 |
| 29 | 🇰🇷 South Korea | $0.04 |
| 30 | 🇨🇴 Colombia | $0.04 |
| 31 | 🇨🇦 Canada | $0.03 |
| 32 | 🇷🇸 Serbia | $0.03 |
| 33 | 🇹🇼 Taiwan | $0.03 |
| 34 | 🇺🇦 Ukraine | $0.03 |
| 35 | 🇲🇾 Malaysia | $0.03 |
| 36 | 🇭🇺 Hungary | $0.03 |
| 37 | 🇹🇳 Tunisia | $0.02 |
| 38 | 🇦🇿 Azerbaijan | $0.01 |
| 39 | 🇧🇭 Bahrain | $0.01 |
| 40 | 🇧🇩 Bangladesh | $0.01 |
| 41 | 🇹🇷 Turkey | $0.01 |
| 42 | 🇷🇺 Russia | $0.01 |
| 43 | 🇦🇷 Argentina | $0.01 |
| 44 | 🇧🇾 Belarus | $0.01 |
| 45 | 🇩🇿 Algeria | $0.00 |
| 46 | 🇮🇷 Iran | $0.00 |
Source: GlobalPetrolPrices.com. As of March 31, 2022. Represents average household prices.
The good news is that the fall season has been relatively warm, which has helped European natural gas demand drop 22% in October compared to last year. This helps reduce the risk of gas shortages transpiring later in the winter.
Outside of Europe, Brazil has the fourth highest natural gas prices globally, despite producing about half of supply domestically. High costs of cooking gas have been especially challenging for low-income families, which became a key political issue in the run-up to the presidential election in October.
Meanwhile, Singapore has the highest natural gas prices in Asia as the majority is imported via tankers or pipelines, leaving the country vulnerable to price shocks.
Increasing Competition
By December, all seaborne crude oil shipments from Russia to Europe will come to a halt, likely pushing up gasoline prices into the winter and 2023.
Concerningly, analysis from the EIA shows that European natural gas storage capacities could sink to 20% by February if Russia completely shuts off its supply and demand is not reduced.
As Europe seeks out alternatives to Russian energy, higher demand could increase global competition for fuel sources, driving up prices for energy in the coming months ahead.
Still, there is some room for optimism: the World Bank projects energy prices will decline 11% in 2023 after the 60% rise seen after the war in Ukraine in 2022.


Energy
Charted: 4 Reasons Why Lithium Could Be the Next Gold Rush
Visual Capitalist has partnered with EnergyX to show why drops in prices and growing demand may make now the right time to invest in lithium.


4 Reasons Why You Should Invest in Lithium
Lithium’s importance in powering EVs makes it a linchpin of the clean energy transition and one of the world’s most precious minerals.
In this graphic, Visual Capitalist partnered with EnergyX to explore why now may be the time to invest in lithium.
1. Lithium Prices Have Dropped
One of the most critical aspects of evaluating an investment is ensuring that the asset’s value is higher than its price would indicate. Lithium is integral to powering EVs, and, prices have fallen fast over the last year:
| Date | LiOH·H₂O* | Li₂CO₃** |
|---|---|---|
| Feb 2023 | $76 | $71 |
| March 2023 | $71 | $61 |
| Apr 2023 | $43 | $33 |
| May 2023 | $43 | $33 |
| June 2023 | $47 | $45 |
| July 2023 | $44 | $40 |
| Aug 2023 | $35 | $35 |
| Sept 2023 | $28 | $27 |
| Oct 2023 | $24 | $23 |
| Nov 2023 | $21 | $21 |
| Dec 2023 | $17 | $16 |
| Jan 2024 | $14 | $15 |
| Feb 2024 | $13 | $14 |
Note: Monthly spot prices were taken as close to the 14th of each month as possible.
*Lithium hydroxide monohydrate MB-LI-0033
**Lithium carbonate MB-LI-0029
2. Lithium-Ion Battery Prices Are Also Falling
The drop in lithium prices is just one reason to invest in the metal. Increasing economies of scale, coupled with low commodity prices, have caused the cost of lithium-ion batteries to drop significantly as well.
In fact, BNEF reports that between 2013 and 2023, the price of a Li-ion battery dropped by 82%.
| Year | Price per KWh |
|---|---|
| 2023 | $139 |
| 2022 | $161 |
| 2021 | $150 |
| 2020 | $160 |
| 2019 | $183 |
| 2018 | $211 |
| 2017 | $258 |
| 2016 | $345 |
| 2015 | $448 |
| 2014 | $692 |
| 2013 | $780 |

3. EV Adoption is Sustainable
One of the best reasons to invest in lithium is that EVs, one of the main drivers behind the demand for lithium, have reached a price point similar to that of traditional vehicle.
According to the Kelly Blue Book, Tesla’s average transaction price dropped by 25% between 2022 and 2023, bringing it in line with many other major manufacturers and showing that EVs are a realistic transport option from a consumer price perspective.
| Manufacturer | September 2022 | September 2023 |
|---|---|---|
| BMW | $69,000 | $72,000 |
| Ford | $54,000 | $56,000 |
| Volkswagon | $54,000 | $56,000 |
| General Motors | $52,000 | $53,000 |
| Tesla | $68,000 | $51,000 |
4. Electricity Demand in Transport is Growing
As EVs become an accessible transport option, there’s an investment opportunity in lithium. But possibly the best reason to invest in lithium is that the IEA reports global demand for the electricity in transport could grow dramatically by 2030:
| Transport Type | 2022 | 2025 | 2030 |
|---|---|---|---|
| Buses 🚌 | 23,000 GWh | 50,000 GWh | 130,000 GWh |
| Cars 🚙 | 65,000 GWh | 200,000 GWh | 570,000 GWh |
| Trucks 🛻 | 4,000 GWh | 15,000 GWh | 94,000 GWh |
| Vans 🚐 | 6,000 GWh | 16,000 GWh | 72,000 GWh |
The Lithium Investment Opportunity
Lithium presents a potentially classic investment opportunity. Lithium and battery prices have dropped significantly, and recently, EVs have reached a price point similar to other vehicles. By 2030, the demand for clean energy, especially in transport, will grow dramatically.
With prices dropping and demand skyrocketing, now is the time to invest in lithium.
EnergyX is poised to exploit lithium demand with cutting-edge lithium extraction technology capable of extracting 300% more lithium than current processes.

-

 Lithium5 days ago
Ranked: The Top 10 EV Battery Manufacturers in 2023
Asia dominates this ranking of the world’s largest EV battery manufacturers in 2023.
-

 Energy2 weeks ago
The World’s Biggest Nuclear Energy Producers
China has grown its nuclear capacity over the last decade, now ranking second on the list of top nuclear energy producers.
-

 Energy1 month ago
The World’s Biggest Oil Producers in 2023
Just three countries accounted for 40% of global oil production last year.
-

 Energy1 month ago
How Much Does the U.S. Depend on Russian Uranium?
Currently, Russia is the largest foreign supplier of nuclear power fuel to the U.S.
-

 Uranium2 months ago
Charted: Global Uranium Reserves, by Country
We visualize the distribution of the world’s uranium reserves by country, with 3 countries accounting for more than half of total reserves.
-

 Energy3 months ago
Visualizing the Rise of the U.S. as Top Crude Oil Producer
Over the last decade, the United States has established itself as the world’s top producer of crude oil, surpassing Saudi Arabia and Russia.

-

 Science1 week ago
Visualizing the Average Lifespans of Mammals
-

 Demographics2 weeks ago
The Smallest Gender Wage Gaps in OECD Countries
-

 United States2 weeks ago
Where U.S. Inflation Hit the Hardest in March 2024
-

 Green2 weeks ago
Top Countries By Forest Growth Since 2001
-

 United States2 weeks ago
Ranked: The Largest U.S. Corporations by Number of Employees
-

 Maps2 weeks ago
The Largest Earthquakes in the New York Area (1970-2024)
-

 Green2 weeks ago
Ranked: The Countries With the Most Air Pollution in 2023
-

 Green2 weeks ago
Ranking the Top 15 Countries by Carbon Tax Revenue