Technology
Mapped: Facebook’s Path to Social Network Domination (2008-2020)
How to Use: The below maps will animate automatically. To pause, move your cursor on the image. Arrows on left/right navigate.


Facebook’s Path to Global Social Network Domination
From just a few thousand users in 2004 to 2.7 billion monthly active users (MAUs) in 2020, Facebook is by far the world’s largest social network.
But its massive global footprint didn’t grow overnight. While Facebook is the most popular social network in many countries, this traction didn’t happen overnight. And in other places, it still hasn’t quite taken off.
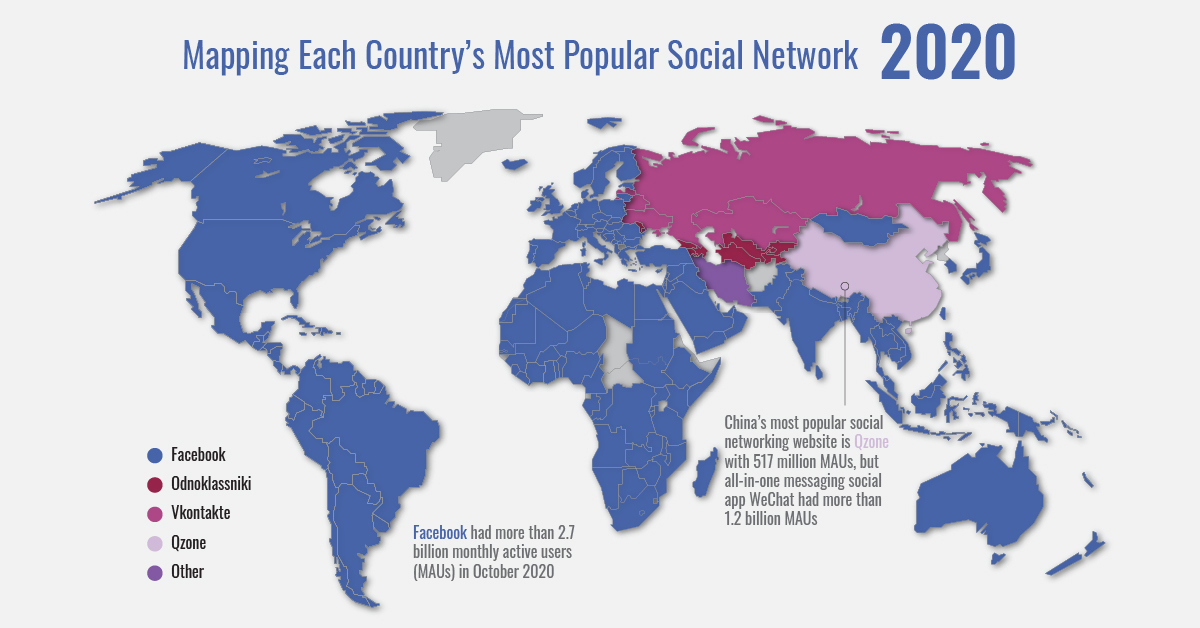
To see Facebook’s path to domination, we mapped each country’s most popular social network from 2008‒2020. The data was tabulated by Vincenzo Cosenza at Vincos.it by examining annual traffic data from Alexa and SimilarWeb.
Facebook Grows From the Americas to Southeast Asia
What famously started as Mark Zuckerberg’s late-night intoxicated project called Facemash—a “hot or not” type website for students at Harvard University—soon evolved into the world’s predominant social network.
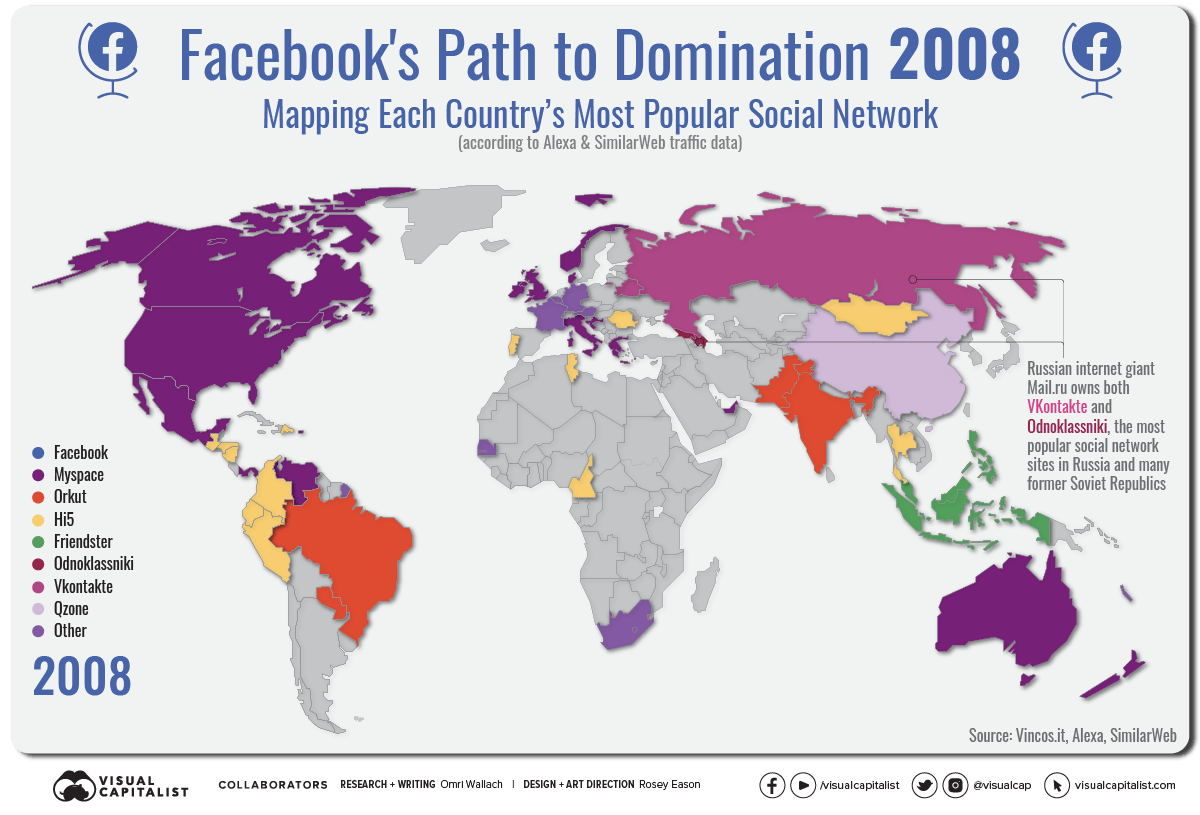
Before 2008, the social network landscape was populated by social network pioneers such as Myspace and Hi5. Google’s Orkut was the most popular network in Brazil and India, and Friendster found a foothold in Southeast Asia.
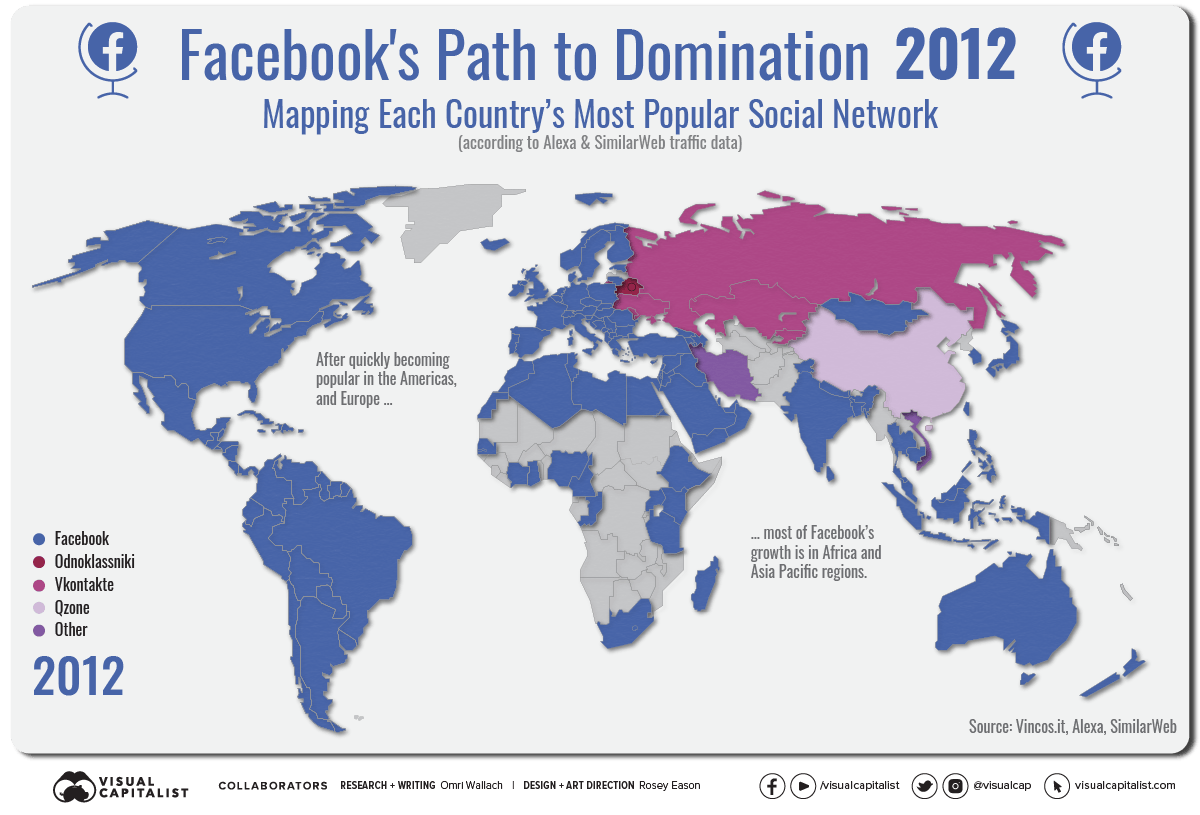
But the Facebook wave came in earnest. By 2009, the social media giant took the title of most popular network for the bulk of the Americas, Europe, South Asia, and Oceania, with Orkut in Brazil being the sole holdout until 2011.
The story was similar in Africa, as increasing internet traffic data pointed to Facebook dominating the social network landscape across the continent (minus a temporary LinkedIn surge in 2017 for Zimbabwe, Ethiopia, Kenya, and Cameroon).
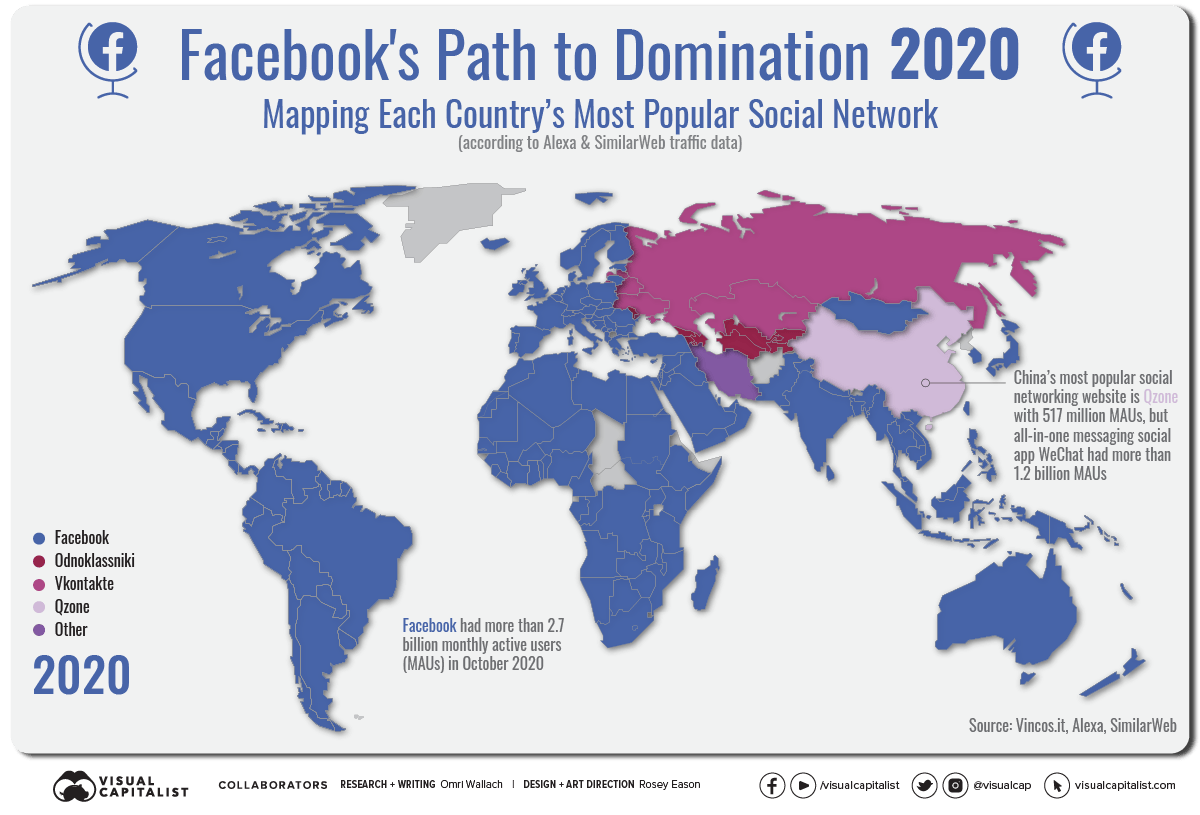
By the beginning of 2020, Facebook was measured as the leading social network site in 151 out of 167 measured countries, or over 90%.
China and Russia Resist Facebook’s Pull
The social giant’s growth, however, didn’t come without resistance.
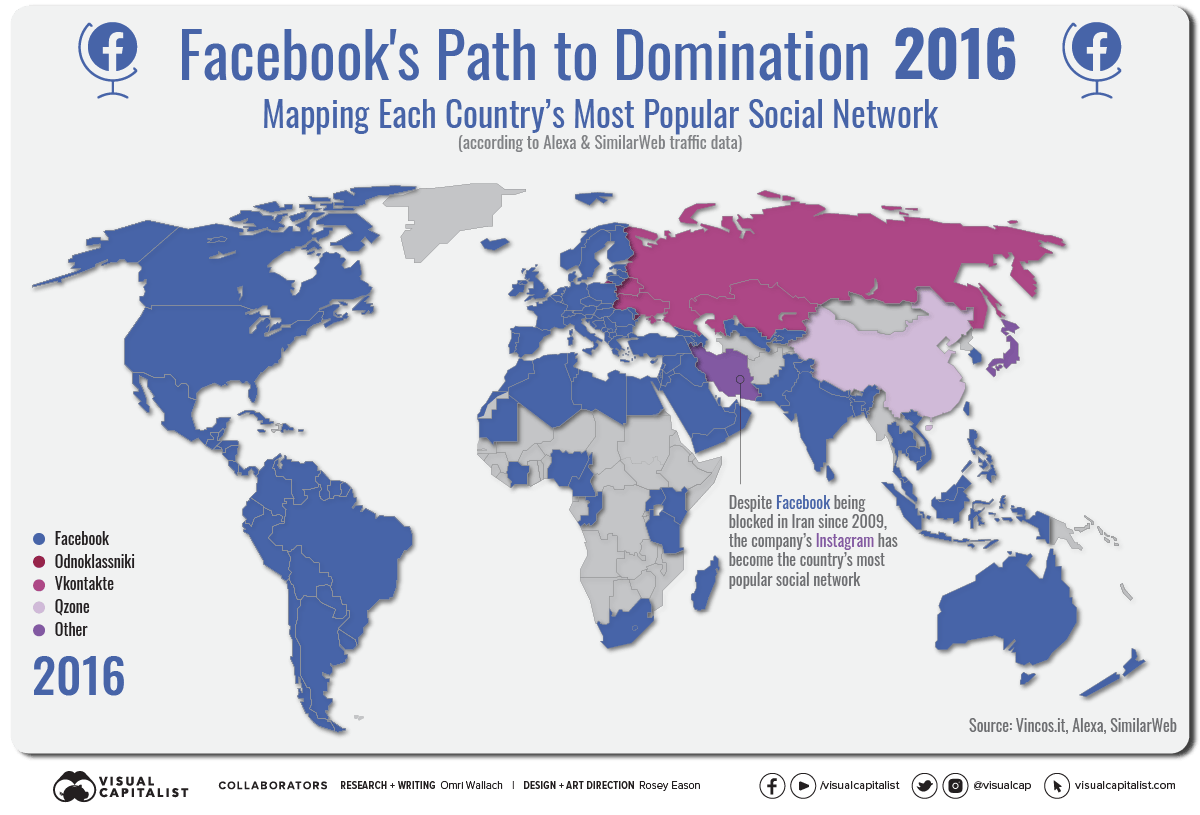
China’s most popular social networking website has been Tencent’s Qzone since the mid-2000s. WeChat—a popular all-in-one messaging platform—does not technically qualify for the above map as a “social networking website”, but the app now has more than 1.2 billion MAUs. Facebook had attempted to gain ground in the country but was banned in 2009.
Similarly in Iran, Facebook was also blocked first in 2009 and then intermittently since. Instead, Iran’s most popular social networks have been Persian sites Cloob and Facenama between 2009‒2016. Facebook did manage to capture the #1 spot briefly in 2011, but since then, they’ve been displaced by Facebook-owned Instagram.
The other countries that Facebook has had trouble capturing, despite not being blocked, are Russia and many former Soviet republics. There, social network dominance has switched regularly between the networks VKontakte and Odnoklassniki, both owned by Mail.ru, a Russian internet giant.
Facebook’s Monopoly Over Mobile Social Networks
As big of a footprint as Facebook has on social networking, the tech giant’s reach is magnified when factoring in mobile apps that it also owns.
In 2020, the company saw 1.3 billion MAUs on Facebook’s Messenger app, 2 billion MAUs on the world’s most popular messaging app WhatsApp, and just under 1.2 billion MAUs on photo sharing network Instagram.
By Facebook’s own estimates in its Q3 2020 reporting, its core products are used by more than 3.2 billion people every month. That means that 40% of Earth’s population (7.8 billion in December 2020) uses Facebook-owned social media.
The question now is if Facebook’s domination will grow further, or if it’ll begin to subside.
With increasing scrutiny of tech giants, the company is facing massive antitrust lawsuits in the U.S. by federal and state authorities, and other countries are stepping up potential regulation as well. At the same time, Facebook is struggling to reach younger audiences in developed countries, which have increasingly turned to Snap and TikTok instead for social media.
Did 2020 mark the height of Facebook’s global empire, or is it just another milestone on the path towards further domination?


Technology
All of the Grants Given by the U.S. CHIPS Act
Intel, TSMC, and more have received billions in subsidies from the U.S. CHIPS Act in 2024.


All of the Grants Given by the U.S. CHIPS Act
This was originally posted on our Voronoi app. Download the app for free on iOS or Android and discover incredible data-driven charts from a variety of trusted sources.
This visualization shows which companies are receiving grants from the U.S. CHIPS Act, as of April 25, 2024. The CHIPS Act is a federal statute signed into law by President Joe Biden that authorizes $280 billion in new funding to boost domestic research and manufacturing of semiconductors.
The grant amounts visualized in this graphic are intended to accelerate the production of semiconductor fabrication plants (fabs) across the United States.
Data and Company Highlights
The figures we used to create this graphic were collected from a variety of public news sources. The Semiconductor Industry Association (SIA) also maintains a tracker for CHIPS Act recipients, though at the time of writing it does not have the latest details for Micron.
| Company | Federal Grant Amount | Anticipated Investment From Company |
|---|---|---|
| 🇺🇸 Intel | $8,500,000,000 | $100,000,000,000 |
| 🇹🇼 TSMC | $6,600,000,000 | $65,000,000,000 |
| 🇰🇷 Samsung | $6,400,000,000 | $45,000,000,000 |
| 🇺🇸 Micron | $6,100,000,000 | $50,000,000,000 |
| 🇺🇸 GlobalFoundries | $1,500,000,000 | $12,000,000,000 |
| 🇺🇸 Microchip | $162,000,000 | N/A |
| 🇬🇧 BAE Systems | $35,000,000 | N/A |
BAE Systems was not included in the graphic due to size limitations
Intel’s Massive Plans
Intel is receiving the largest share of the pie, with $8.5 billion in grants (plus an additional $11 billion in government loans). This grant accounts for 22% of the CHIPS Act’s total subsidies for chip production.
From Intel’s side, the company is expected to invest $100 billion to construct new fabs in Arizona and Ohio, while modernizing and/or expanding existing fabs in Oregon and New Mexico. Intel could also claim another $25 billion in credits through the U.S. Treasury Department’s Investment Tax Credit.
TSMC Expands its U.S. Presence
TSMC, the world’s largest semiconductor foundry company, is receiving a hefty $6.6 billion to construct a new chip plant with three fabs in Arizona. The Taiwanese chipmaker is expected to invest $65 billion into the project.
The plant’s first fab will be up and running in the first half of 2025, leveraging 4 nm (nanometer) technology. According to TrendForce, the other fabs will produce chips on more advanced 3 nm and 2 nm processes.
The Latest Grant Goes to Micron
Micron, the only U.S.-based manufacturer of memory chips, is set to receive $6.1 billion in grants to support its plans of investing $50 billion through 2030. This investment will be used to construct new fabs in Idaho and New York.

-

 Misc1 week ago
How Hard Is It to Get Into an Ivy League School?
-

 Technology2 weeks ago
Ranked: Semiconductor Companies by Industry Revenue Share
-

 Markets2 weeks ago
Ranked: The World’s Top Flight Routes, by Revenue
-

 Countries2 weeks ago
Population Projections: The World’s 6 Largest Countries in 2075
-

 Markets2 weeks ago
The Top 10 States by Real GDP Growth in 2023
-

 Demographics2 weeks ago
The Smallest Gender Wage Gaps in OECD Countries
-

 United States2 weeks ago
Where U.S. Inflation Hit the Hardest in March 2024
-

 Green2 weeks ago
Top Countries By Forest Growth Since 2001