Datastream
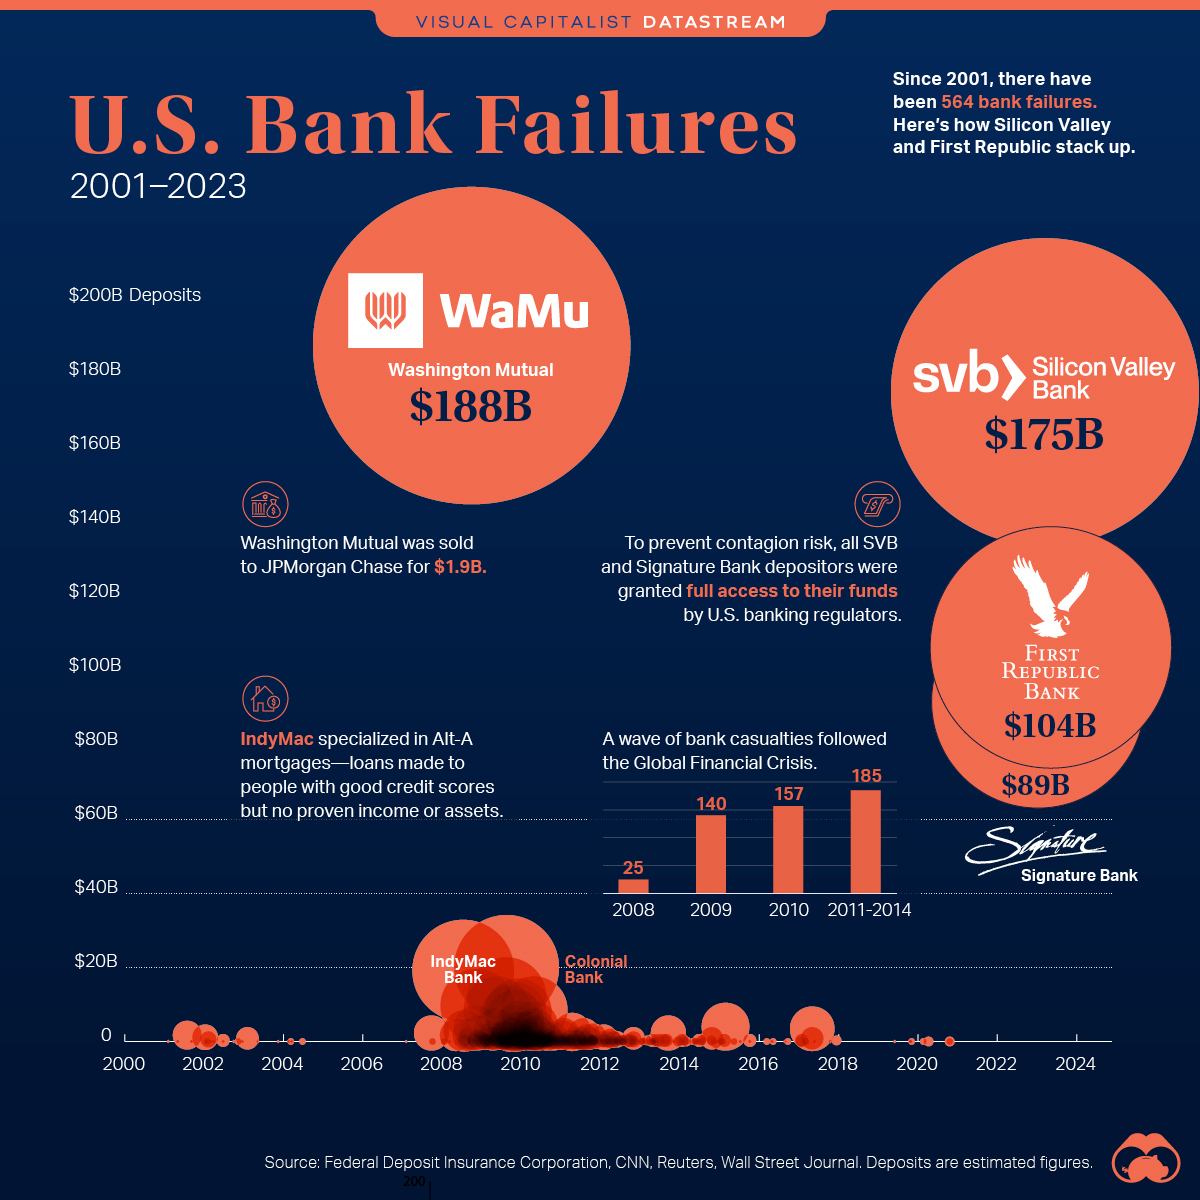
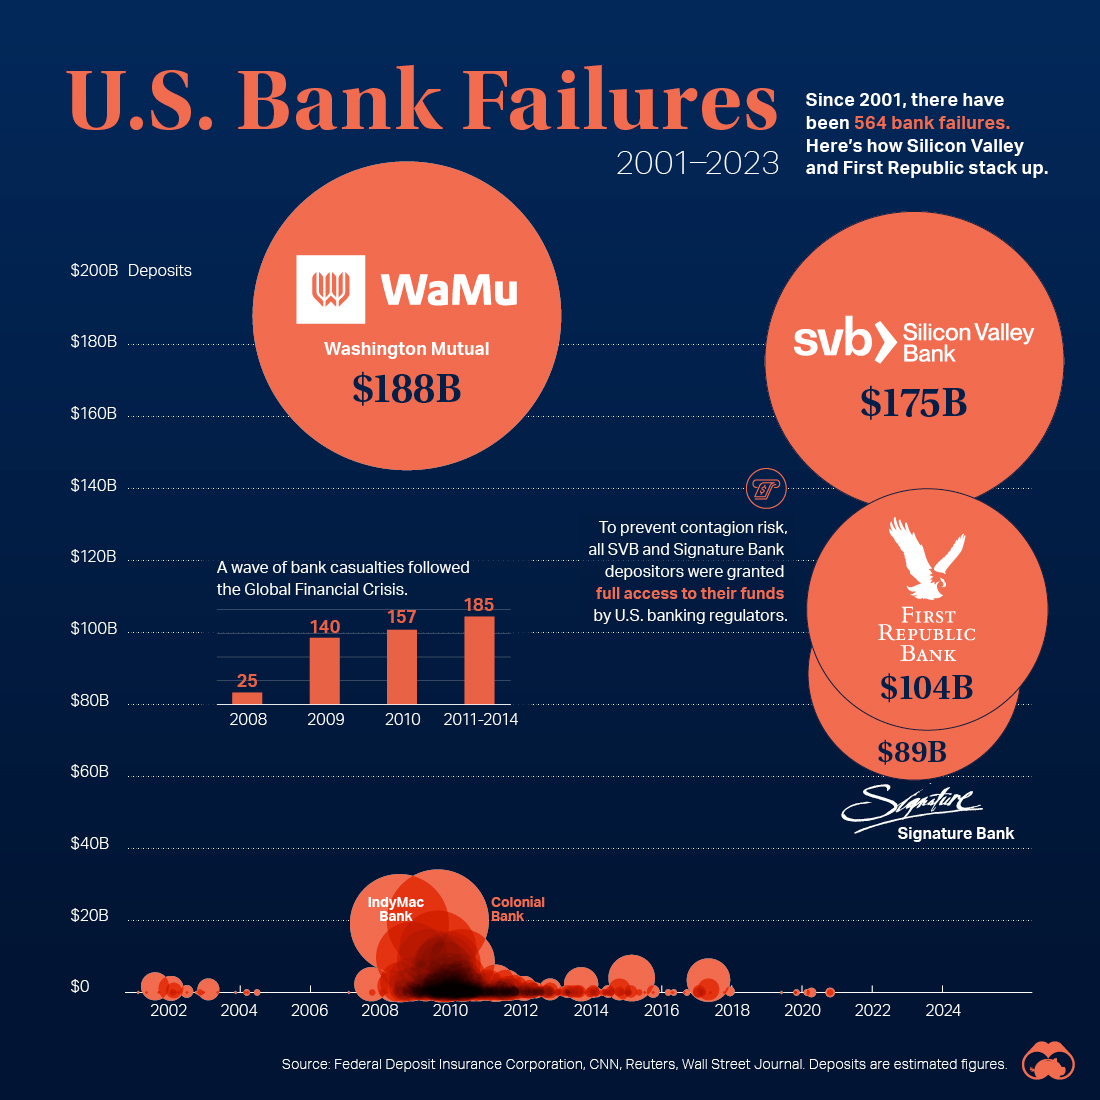
The Largest U.S. Bank Failures in Modern History


The Briefing
- The collapse of Silicon Valley Bank impacted $175 billion in deposits and $209 billion in assets
- First Republic Bank was seized two months later, in the second-largest bank failure by assets in U.S. history
The Largest Bank Failures in Modern History
Silicon Valley Bank cratered at warp speed—and within weeks, two other institutions folded in the March banking panic.
Just two months later, First Republic became the next casualty. After $100 billion in deposits were drained from the bank in days, the San Francisco-based bank began facing mounting pressures. On Monday, JPMorgan assumed ownership of the failed institution in the second-biggest bank collapse in U.S. history, by assets.
With data from the Federal Deposit Insurance Corporation (FDIC), the above graphic charts over 500 bank failures since 2001.
Top 20 Bank Failures Since 2001
The last time a major banking collapse took place, a flood of bank shutdowns followed.
After banks reported billions in subprime-mortgage losses in late 2007, sentiment began to shift. As losses snowballed in 2008, it triggered a run on shadow banks—institutions that aren’t regulated like banks but perform similar actions.
Back then, banks and shadow banks were holding foreclosed mortgages as collateral. At the time, it was also difficult to determine the value of these assets. A credit crisis spurred a wave of bank collapses.
Here are the top 20 bank failures over the last two decades:
| Rank | Bank Name | Date | Deposits | Assets |
|---|---|---|---|---|
| 1 | Washington Mutual Bank | Sep 2008 | $188.0B | $307.0B |
| 2 | Silicon Valley Bank | Mar 2023 | $175.4B | $209.0B |
| 3 | First Republic Bank | May 2023 | $103.9B | $229.1B |
| 4 | Signature Bank | Mar 2023 | $88.6B | $110.4B |
| 5 | Colonial Bank | Aug 2009 | $20.0B | $25.0B |
| 6 | IndyMac Bank | Jul 2008 | $19.1B | $32.0B |
| 7 | Guaranty Bank | Aug 2009 | $12.0B | $13.0B |
| 8 | Downey Savings and Loan Association | Nov 2008 | $9.7B | $12.8B |
| 9 | BankUnited | May 2009 | $8.6B | $12.8B |
| 10 | AmTrust Bank | Dec 2009 | $8.0B | $12.0B |
| 11 | Corus Bank | Sep 2009 | $7.0B | $7.0B |
| 12 | California National Bank | Oct 2009 | $6.2B | $7.8B |
| 13 | First Federal Bank of California | Dec 2009 | $4.5B | $6.1B |
| 14 | R-G Premier Bank of Puerto Rico | Apr 2010 | $4.3B | $5.9B |
| 15 | Doral Bank | Feb 2015 | $4.1B | $5.9B |
| 16 | Park National Bank | Oct 2009 | $3.7B | $4.7B |
| 17 | Franklin Bank | Nov 2008 | $3.7B | $5.1B |
| 18 | First NBC Bank | Apr 2017 | $3.5B | $4.7B |
| 19 | Amcore Bank | Apr 2010 | $3.4B | $3.8B |
| 20 | Silverton Bank | May 2009 | $3.3B | $4.1B |
The banks collapsing in more recent days have been holding U.S. Treasuries as collateral. These have declined in value as interest rates have spiked. Their customer bases are also concentrated, which decreases diversification. Just as Silicon Valley Bank served a niche clientele of venture-backed tech startups, Signature Bank worked with high-risk crypto firms.
As these banks poured deposits in long-term bonds when interest rates were historically low, it was a reflection of faulty risk management and the assumption that interest rates would remain at these levels.
What Happens Now?
U.S. banking regulators have shown that they’re serious about preventing any future fallout.
Together, the Federal Reserve, U.S. Treasury, and the FDIC took emergency measures to enable all Silicon Valley Bank and Signature Bank depositors access to their funds days after their collapse. This was after an auction that resulted in no buyer.
For First Republic, all of the 84 branches will now be under ownership of JPMorgan, with the FDIC stating that clients will have access to both insured and uninsured deposits.
In each of the three bank failures so far in 2023, regulators have taken swift action to repay depositors and stem systemic risk. This has led many market participants to believe that banking troubles are contained.
As the effects of the fastest rate hikes in decades continue to be felt, whether or not this proves to be the case is anyone’s guess.
Where does this data come from?
Source: Federal Deposit Insurance Corporation, May 2023.


Datastream
Can You Calculate Your Daily Carbon Footprint?
Discover how the average person’s carbon footprint impacts the environment and learn how carbon credits can offset your carbon footprint.


The Briefing
- A person’s carbon footprint is substantial, with activities such as food consumption creating as much as 4,500 g of CO₂ emissions daily.
- By purchasing carbon credits from Carbon Streaming Corporation, you can offset your own emissions and fund positive climate action.
Your Everyday Carbon Footprint
While many large businesses and countries have committed to net-zero goals, it is essential to acknowledge that your everyday activities also contribute to global emissions.
In this graphic, sponsored by Carbon Streaming Corporation, we will explore how the choices we make and the products we use have a profound impact on our carbon footprint.
Carbon Emissions by Activity
Here are some of the daily activities and products of the average person and their carbon footprint, according to Clever Carbon.
| Household Activities & Products | CO2 Emissions (g) |
|---|---|
| 💡 Standard Light Bulb (100 watts, four hours) | 172 g |
| 📱 Mobile Phone Use (195 minutes per day)* | 189 g |
| 👕 Washing Machine (0.63 kWh) | 275 g |
| 🔥 Electric Oven (1.56 kWh) | 675 g |
| ♨️ Tumble Dryer (2.5 kWh) | 1,000 g |
| 🧻 Toilet Roll (2 ply) | 1,300 g |
| 🚿 Hot Shower (10 mins) | 2,000 g |
| 🚙 Daily Commute (one hour, by car) | 3,360 g |
| 🍽️ Average Daily Food Consumption (three meals of 600 calories) | 4,500 g |
| *Phone use based on yearly use of 69kg per the source, Reboxed | |
Your choice of transportation plays a crucial role in determining your carbon footprint. For instance, a 15 km daily commute to work on public transport generates an average of 1,464 g of CO₂ emissions. Compared to 3,360 g—twice the volume for a journey the same length by car.
By opting for more sustainable modes of transport, such as cycling, walking, or public transportation, you can significantly reduce your carbon footprint.
Addressing Your Carbon Footprint
One way to compensate for your emissions is by purchasing high-quality carbon credits.
Carbon credits are used to help fund projects that avoid, reduce or remove CO₂ emissions. This includes nature-based solutions such as reforestation and improved forest management, or technology-based solutions such as the production of biochar and carbon capture and storage (CCS).
While carbon credits offer a potential solution for individuals to help reduce global emissions, public awareness remains a significant challenge. A BCG-Patch survey revealed that only 34% of U.S. consumers are familiar with carbon credits, and only 3% have purchased them in the past.
About Carbon Streaming
By financing the creation or expansion of carbon projects, Carbon Streaming Corporation secures the rights to future carbon credits generated by these sustainable projects. You can then purchase these carbon credits to help fund climate solutions around the world and compensate for your own emissions.
Ready to get involved?
>> Learn more about purchasing carbon credits at Carbon Streaming

-

 Sports1 week ago
The Highest Earning Athletes in Seven Professional Sports
-

 Countries2 weeks ago
Population Projections: The World’s 6 Largest Countries in 2075
-

 Markets2 weeks ago
The Top 10 States by Real GDP Growth in 2023
-

 Demographics2 weeks ago
The Smallest Gender Wage Gaps in OECD Countries
-

 United States2 weeks ago
Where U.S. Inflation Hit the Hardest in March 2024
-

 Green2 weeks ago
Top Countries By Forest Growth Since 2001
-

 United States2 weeks ago
Ranked: The Largest U.S. Corporations by Number of Employees
-

 Maps2 weeks ago
The Largest Earthquakes in the New York Area (1970-2024)