Green
Interactive: EV Charging Stations Across the U.S. Mapped
![]() Subscribe to the Elements free mailing list for more like this
Subscribe to the Elements free mailing list for more like this
View the non-interactive version of this map here.
var divElement = document.getElementById(‘viz1660173746083’); var vizElement = divElement.getElementsByTagName(‘object’)[0]; vizElement.style.width=’1200px’;vizElement.style.height=’1227px’; var scriptElement = document.createElement(‘script’); scriptElement.src = ‘https://public.tableau.com/javascripts/api/viz_v1.js’; vizElement.parentNode.insertBefore(scriptElement, vizElement);

Electric Vehicle Charging Stations Across America: Mapped
This was originally posted on Elements. Sign up to the free mailing list to get beautiful visualizations on natural resource megatrends in your email every week.
As the electric vehicle market continues to expand, having enough EV charging stations is essential to enable longer driving ranges and lower wait times at chargers.
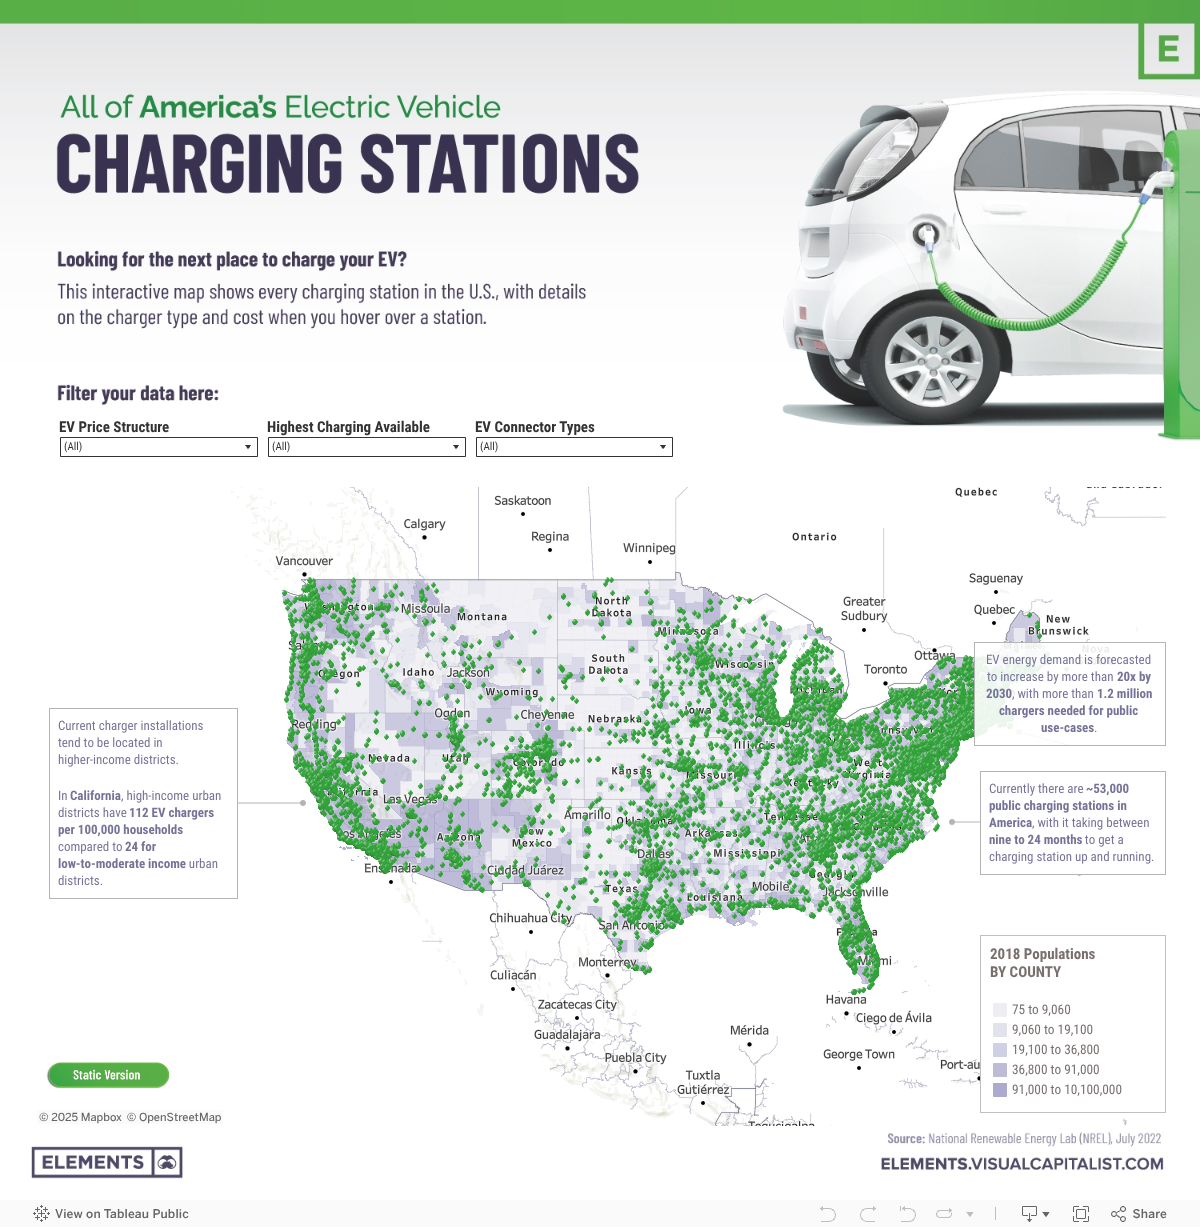
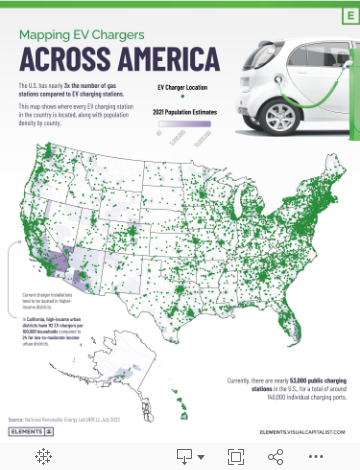
Currently, the U.S. has about 140,000 public EV chargers distributed across almost 53,000 charging stations, which are still far outnumbered by the 145,000 gas fueling stations in the country.
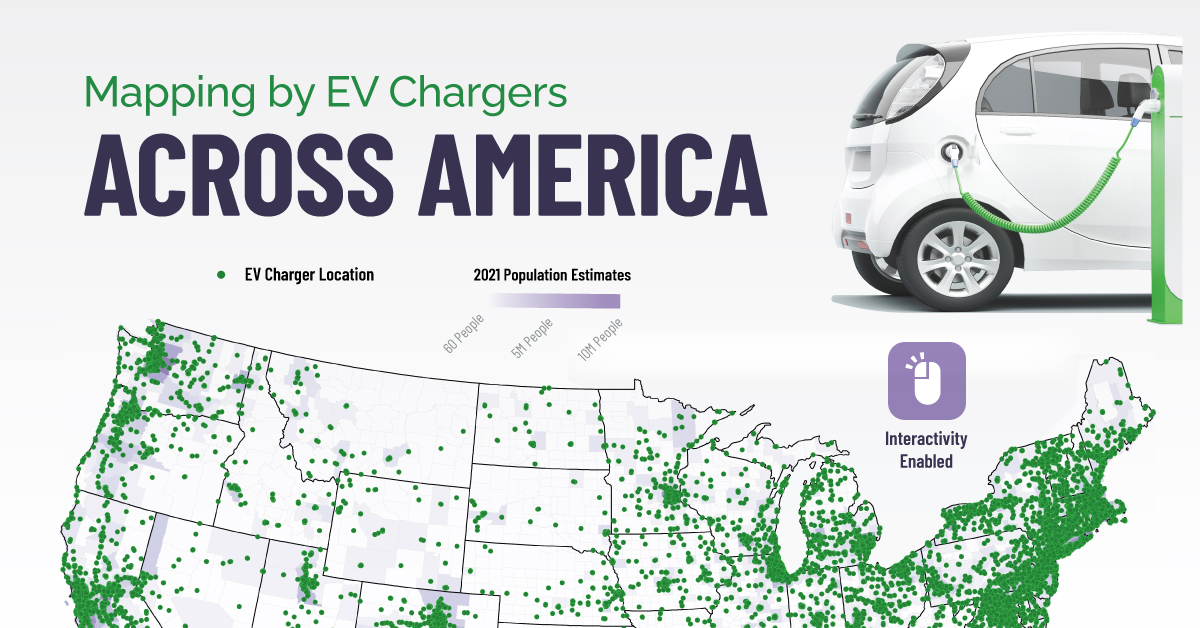
This graphic maps out EV charging stations across the U.S. using data from the National Renewable Energy Lab. The map has interactive features when viewed on desktop, showing pricing structures and the connector types when hovering over a charging station, along with filtering options.
Which States Lead in EV Charging Infrastructure?
As seen in the map above, most electric vehicle charging stations in the U.S. are located on the west and east coasts of the nation, while the Midwest strip is fairly barren aside from the state of Colorado.
California has the highest number of EV charging stations at 15,182, making up an impressive 29% of all charging stations in America. In fact, the Golden State has nearly double the chargers of the following three states, New York (3,085), Florida (2,858), and Texas (2,419) combined.
| Rank | State | Number of charging stations | Share of U.S. charging stations |
|---|---|---|---|
| 1 | California | 15,182 | 28.7% |
| 2 | New York | 3,085 | 5.8% |
| 3 | Florida | 2,858 | 5.4% |
| 4 | Texas | 2,419 | 4.6% |
| 5 | Massachusetts | 2,328 | 4.4% |
| 6 | Washington | 1,810 | 3.4% |
| 7 | Colorado | 1,718 | 3.2% |
| 8 | Georgia | 1,596 | 3.0% |
| 9 | Maryland | 1,358 | 2.6% |
| 10 | Pennsylvania | 1,260 | 2.4% |
| U.S. Total | 52,889 | 100.0% |
It’s no surprise the four top states by GDP have the highest number of EV chargers, and California’s significant lead is also unsurprising considering its ambition to completely phase out the sale of new gas vehicles by 2035.
The Best States for EV Charging Speeds and Cost
While having many charging stations distributed across a state is important, two other factors determine charging convenience: cost and charger level availability.
EV charger pricing structures and charger level availability across the nation are a Wild West with no set rules and few clear expectations.
Finding Free Electric Vehicle Chargers Across States
Generous electric vehicle charging locations will offer unlimited free charging or a time cap between 30 minutes and 4 hours of free charging before payment is required. Some EV charging stations located in parking structures simply require a parking fee, while others might have a flat charging fee per session, charge by kWh consumed, or have an hourly rate.
While California leads in terms of the raw amount of free chargers available in the state, it’s actually the second-worst in the top 10 states when it comes to the share of chargers, at only 11% of them free for 30 minutes or more.
| Rank | State name | Number of free charging stations | Share of free charging stations in the state |
|---|---|---|---|
| 1 | California | 1,717 | 11.3% |
| 2 | Florida | 673 | 23.6% |
| 3 | New York | 662 | 21.5% |
| 4 | Texas | 606 | 25.1% |
| 5 | Maryland | 399 | 29.4% |
| 6 | Georgia | 360 | 22.6% |
| 7 | Washington | 358 | 19.8% |
| 8 | Pennsylvania | 318 | 25.2% |
| 9 | Colorado | 273 | 15.9% |
| 10 | Massachusetts | 150 | 6.4% |
| U.S. Total | 10,295 | 19.5% |
Meanwhile, Maryland leads with almost 30% of the chargers in the state that offer a minimum of 30 minutes of free charging. On the other hand, Massachusetts is the stingiest state of the top 10, with only 6% of charging stations (150 total) in the state offering free charging for electric vehicle drivers.
The States with the Best DC Fast Charger Availability
While free EV chargers are great, having access to fast chargers can matter just as much, depending on how much you value your time. Most EV drivers across the U.S. will have access to level 2 chargers, with more than 86% of charging stations in the country having level 2 chargers available.
Although level 2 charging (4-10 hours from empty to full charge) beats the snail’s pace of level 1 charging (40-50 hours from empty to full charge), between busy schedules and many charging stations that are only free for the first 30 minutes, DC fast charger availability is almost a necessity.
Direct current fast chargers can charge an electric vehicle from empty to 80% in 20-60 minutes but are only available at 12% of America’s EV charging stations today.
| Rank | State | Number of stations with DC fast charger available | Share of DC fast charger available stations in state | Share of free and DC fast charger available stations in state |
|---|---|---|---|---|
| 1 | California | 1,756 | 11.6% | 0.7% |
| 2 | Florida | 360 | 12.6% | 1.1% |
| 3 | Texas | 276 | 11.4% | 1.2% |
| 4 | Colorado | 243 | 14.1% | 1.1% |
| 5 | New York | 234 | 7.6% | 0.8% |
| 6 | Washington | 232 | 12.8% | 1.1% |
| 7 | Georgia | 228 | 14.3% | 1.4% |
| 8 | Maryland | 223 | 16.4% | 2.7% |
| 9 | Pennsylvania | 134 | 10.6% | 1.0% |
| 10 | Massachusetts | 134 | 5.8% | 0.2% |
| U.S. Total | 6,540 | 12.4% | 0.9% |
Just like free stations, Maryland leads the top 10 states in having the highest share of DC fast chargers at 16%. While Massachusetts was the worst state for DC charger availability at 6%, the state of New York was second worst at 8% despite its large number of chargers overall. All other states in the top 10 have DC chargers available in at least one in 10 charging stations.
As for the holy grail of charging stations, with free charging and DC fast charger availability, almost 1% of the country’s charging stations are there. So if you’re hoping for free and DC fast charging, the chances in most states are around one in 100.
The Future of America’s EV Charging Infrastructure
As America works towards Biden’s goal of having half of all new vehicles sold in 2030 be zero-emissions vehicles (battery electric, plug-in hybrid electric, or fuel cell electric), charging infrastructure across the nation is essential in improving accessibility and convenience for drivers.
The Biden administration has given early approval to 35 states’ EV infrastructure plans, granting them access to $900 million in funding as part of the $5 billion National Electric Vehicle Infrastructure (NEVI) Formula Program set to be distributed over the next five years.
Along with this program, a $2.5 billion Discretionary Grant Program aims to increase EV charging access in rural, undeserved, and overburdened communities, along with the Inflation Reduction Act’s $3 billion dedicated to supporting access to EV charging for economically disadvantaged communities.
With more than $10 billion being invested into EV charging infrastructure over the next five years and more than half the sum focused on communities with poor current access, charger availability across America is set to continue improving in the coming years.


Green
The Carbon Footprint of Major Travel Methods
Going on a cruise ship and flying domestically are the most carbon-intensive travel methods.


The Carbon Footprint of Major Travel Methods
This was originally posted on our Voronoi app. Download the app for free on iOS or Android and discover incredible data-driven charts from a variety of trusted sources.
Did you know that transport accounts for nearly one-quarter of global energy-related carbon dioxide (CO₂) emissions?
This graphic illustrates the carbon footprints of major travel methods measured in grams of carbon dioxide equivalent (CO₂e) emitted per person to travel one kilometer. This includes both CO₂ and other greenhouse gases.
Data is sourced from Our World in Data, the UK Government’s Department for Energy Security and Net Zero, and The International Council on Clean Transportation, as of December 2022.
These figures should be interpreted as approximations, rather than exact numbers. There are many variables at play that determine the actual carbon footprint in any individual case, including vehicle type or model, occupancy, energy mix, and even weather.
Cruise Ships are the Most Carbon-Intensive Travel Method
According to these estimates, taking a cruise ship, flying domestically, and driving alone are some of the most carbon-intensive travel methods.
Cruise ships typically use heavy fuel oil, which is high in carbon content. The average cruise ship weighs between 70,000 to 180,000 metric tons, meaning they require large engines to get moving.
These massive vessels must also generate power for onboard amenities such as lighting, air conditioning, and entertainment systems.
Short-haul flights are also considered carbon-intensive due to the significant amount of fuel consumed during initial takeoff and climbing altitude, relative to a lower amount of cruising.
| Transportation method | CO₂ equivalent emissions per passenger km |
|---|---|
| Cruise Ship | 250 |
| Short-haul flight (i.e. within a U.S. state or European country) | 246 |
| Diesel car | 171 |
| Gas car | 170 |
| Medium-haul flight (i.e. international travel within Europe, or between U.S. states) | 151 |
| Long-haul flight (over 3,700 km, about the distance from LA to NY) | 147 |
| Motorbike | 113 |
| Bus (average) | 96 |
| Plug-in hybrid | 68 |
| Electric car | 47 |
| National rail | 35 |
| Tram | 28 |
| London Underground | 27 |
| Ferry (foot passenger) | 19 |
| Eurostar (International rail) | 4.5 |
Are EVs Greener?
Many experts agree that EVs produce a lower carbon footprint over time versus traditional internal combustion engine (ICE) vehicles.
However, the batteries in electric vehicles charge on the power that comes straight off the electrical grid—which in many places may be powered by fossil fuels. For that reason, the carbon footprint of an EV will depend largely on the blend of electricity sources used for charging.
There are also questions about how energy-intensive it is to build EVs compared to a comparable ICE vehicle.

-

 Education1 week ago
How Hard Is It to Get Into an Ivy League School?
-

 Technology2 weeks ago
Ranked: Semiconductor Companies by Industry Revenue Share
-

 Markets2 weeks ago
Ranked: The World’s Top Flight Routes, by Revenue
-

 Demographics2 weeks ago
Population Projections: The World’s 6 Largest Countries in 2075
-

 Markets2 weeks ago
The Top 10 States by Real GDP Growth in 2023
-

 Demographics2 weeks ago
The Smallest Gender Wage Gaps in OECD Countries
-

 Economy2 weeks ago
Where U.S. Inflation Hit the Hardest in March 2024
-

 Green2 weeks ago
Top Countries By Forest Growth Since 2001