Markets
Intangible Assets: A Hidden but Crucial Driver of Company Value
View the full-size version of this infographic.

Intangible Assets Take Center Stage
View the high resolution version of this infographic by clicking here
In 2018, intangible assets for S&P 500 companies hit a record value of $21 trillion. These assets, which are not physical in nature and include things like intellectual property, have rapidly risen in importance compared to tangible assets like cash.
Today’s infographic from Raconteur highlights the growth of intangible asset valuations, and how senior decision-makers view intangibles when making investment decisions.
Tracking the Growth of Intangibles
Intangibles used to play a much smaller role than they do now, with physical assets comprising the majority of value for most enterprise companies. However, an increasingly competitive and digital economy has placed the focus on things like intellectual property, as companies race to out-innovate one another.
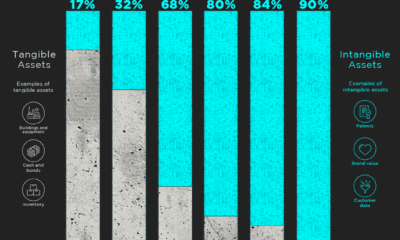
To measure this historical shift, Aon and the Ponemon Institute analyzed the value of intangible and tangible assets over nearly four and a half decades on the S&P 500. Here’s how they stack up:
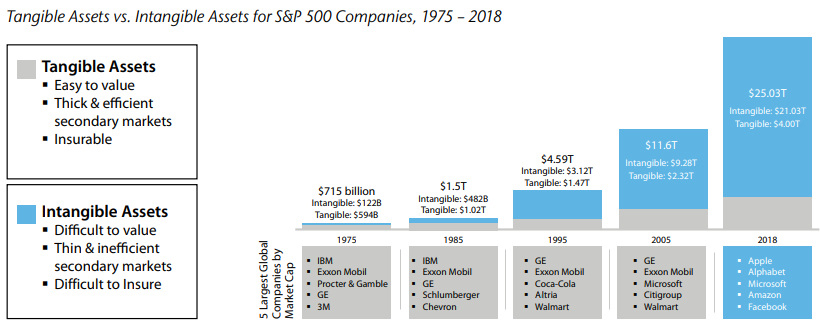
Source: Aon
In just 43 years, intangibles have evolved from a supporting asset into a major consideration for investors – today, they make up 84% of all enterprise value on the S&P 500, a massive increase from just 17% in 1975.
The Largest Companies by Intangible Value
Digital-centric sectors, such as internet & software and technology & IT, are heavily reliant on intangible assets.
Brand Finance, which produces an annual ranking of companies based on intangible value, has companies in these sectors taking the top five spots on the 2019 edition of their report.
| Rank | Company | Sector | Total Intangible Value | Share of Enterprise Value |
|---|---|---|---|---|
| 1 | Microsoft | Internet & Software | $904B | 90% |
| 2 | Amazon | Internet & Software | $839B | 93% |
| 3 | Apple | Technology & IT | $675B | 77% |
| 4 | Alphabet | Internet & Software | $521B | 65% |
| 5 | Internet & Software | $409B | 79% | |
| 6 | AT&T | Telecoms | $371B | 84% |
| 7 | Tencent | Internet & Software | $365B | 88% |
| 8 | Johnson & Johnson | Pharma | $361B | 101% |
| 9 | Visa | Banking | $348B | 100% |
| 10 | Alibaba | Internet & Software | $344B | 86% |
| 11 | Nestle | Food | $313B | 89% |
| 12 | Procter & Gamble | Cosmetics & Personal Care | $305B | 101% |
| 13 | Anheuser-Busch InBev | Beers | $304B | 99% |
| 14 | Verizon | Telecoms | $300B | 83% |
| 15 | Comcast | Media | $276B | 92% |
| 16 | Mastercard | Banking | $259B | 99% |
| 17 | Novartis | Pharma | $252B | 101% |
| 18 | Walmart | Retail | $252B | 68% |
| 19 | Unitedhealth | Healthcare | $245B | 94% |
| 20 | Pfizer | Pharma | $235B | 98% |
Note: Percentages may exceed 100% due to rounding.
Microsoft overtook Amazon for the top spot in the ranking for 2019, with $904B in intangible assets. The company has the largest commercial cloud business in the world.
Pharma and healthcare companies are also prominent on the list, comprising four of the top 20. Their intangible value is largely driven by patents, as well as mergers and acquisitions. Johnson & Johnson, for example, reported $32B in patents and trademarks in their latest annual report.
A Lack of Disclosure
It’s important to note that Brand Finance’s ranking is based on both disclosed intangibles—those that are reported on a company’s balance sheet—and undisclosed intangibles. In the ranking, undisclosed intangibles were calculated as the difference between a company’s market value and book value.
The majority of intangibles are not reported on balance sheets because accounting standards do not recognize them until a transaction has occurred to support their value. While many accounting managers see this as a prudent measure to stop unsubstantiated asset values, it means that many highly valuable intangibles never appear in financial reporting. In fact, 34% of the total worth of the world’s publicly traded companies is made up of undisclosed value.
“It is time for CEOs, CFOs, and CMOs to start a long overdue reporting revolution.”
—David Haigh, CEO of Brand Finance
Brand Finance believes that companies should regularly value each intangible asset, including the key assumptions management made when deriving their value. This information would be extremely useful for managers, investors, and other stakeholders.
A Key Consideration
Investment professionals certainly agree on the importance of intangibles. In a survey of institutional investors by Columbia Threadneedle, it was found that 95% agreed that intangible assets contain crucial information about the future strength of a company’s business model.
Moreover, 98% agree that more transparency would be beneficial to their assessment of intangible assets. In the absence of robust reporting, Columbia Threadneedle believes active managers are well equipped to understand intangible asset values due to their access to management, relationships with key opinion leaders, and deep industry expertise.
By undertaking rigorous analysis, managers may uncover hidden competitive advantages—and generate higher potential returns in the process.


Economy
The Most Valuable Companies in Major EU Economies
From semiconductor equipment manufacturers to supercar makers, the EU’s most valuable companies run the gamut of industries.
Most Valuable Companies in the EU, by Country
This was originally posted on our Voronoi app. Download the app for free on iOS or Android and discover incredible data-driven charts from a variety of trusted sources.
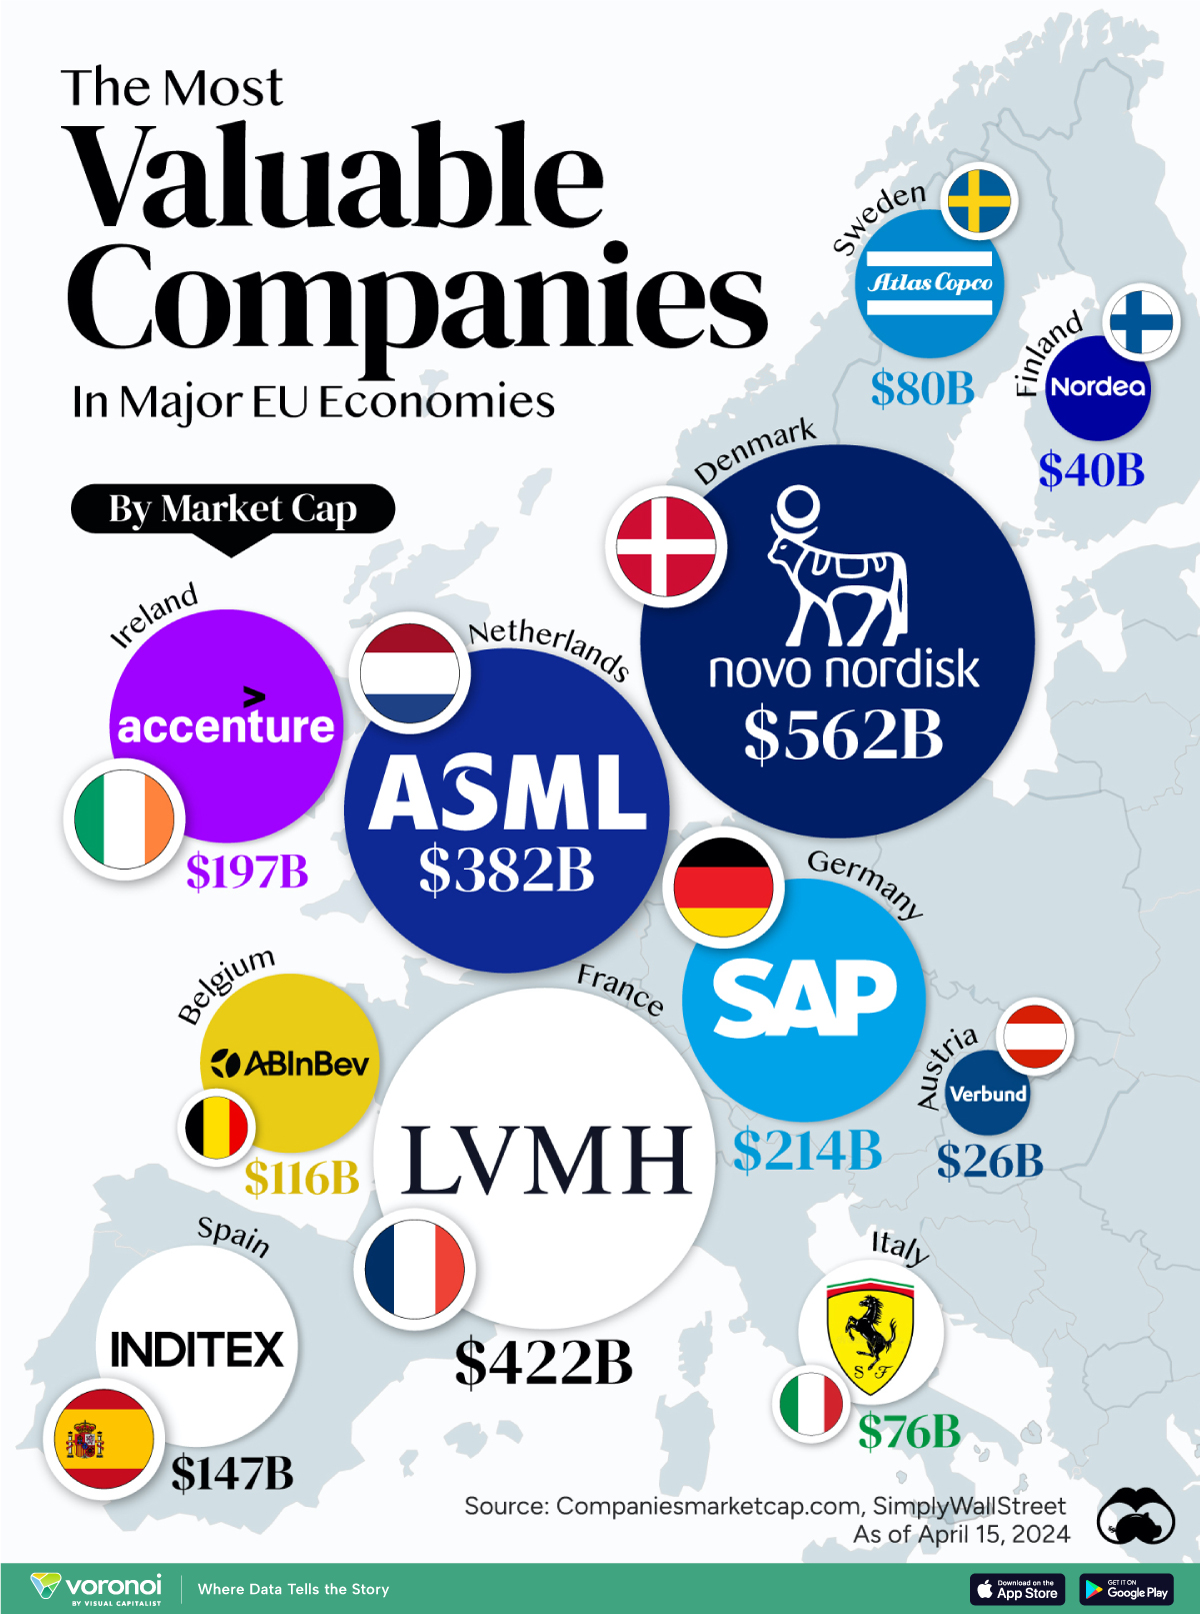
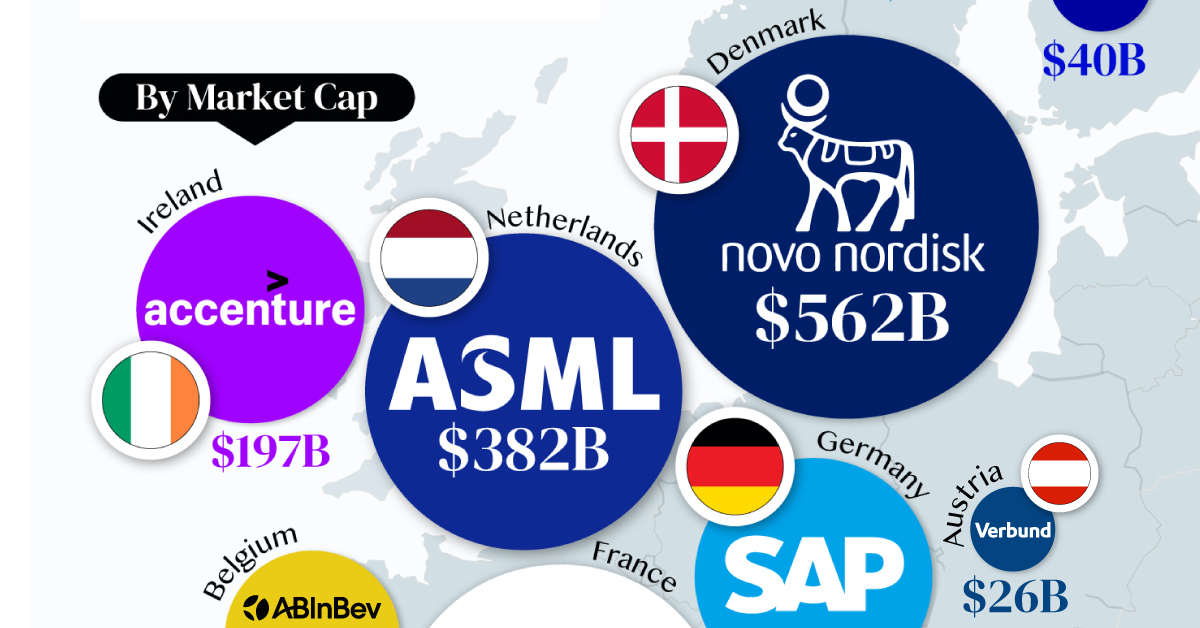
In this graphic, we mapped out the most valuable corporations in 11 major EU economies, based on their market capitalizations as of April 15th, 2024. All figures are in USD, and were sourced from Companiesmarketcap.com.
Novo Nordisk is currently worth more than $550 billion, making it Europe’s most valuable company by a wide margin. The pharmaceutical giant specializes in diabetes and weight-loss drugs. Demand for two of them, Ozempic and Wegovy, has surged due to their weight-loss capabilities, even causing nationwide shortages in the United States.
The following table includes an expanded list of the most valuable publicly-traded company in larger EU economies. Many of these were not included in the graphic due to space limitations.
| Country | Company | Sector | Market Cap |
|---|---|---|---|
| 🇩🇰 Denmark | 💊 Novo Nordisk | Pharmaceuticals | $562B |
| 🇫🇷 France | 👜 LVMH | Luxury Goods | $422B |
| 🇳🇱 Netherlands | 🔧 ASML | Semiconductor Equipment | $382B |
| 🇩🇪 Germany | 💼 SAP | Enterprise Software | $214B |
| 🇮🇪 Ireland | 🖥️ Accenture | IT Services | $197B |
| 🇪🇸 Spain | 👗 Inditex | Retail | $147B |
| 🇧🇪 Belgium | 🍻 Anheuser-Busch InBev | Beverages | $116B |
| 🇸🇪 Sweden | 🛠️ Atlas Copco | Industrial Equipment | $80B |
| 🇮🇹 Italy | 🏎️ Ferrari | Automotive | $76B |
| 🇫🇮 Finland | 🏦 Nordea Bank | Banking | $40B |
| 🇦🇹 Austria | 🔌 Verbund AG | Energy | $26B |
| 🇱🇺 Luxembourg | 🏗️ Tenaris | Oil & Gas Equipment | $22B |
| 🇨🇿 Czech Republic | 💡 CEZ Group | Energy | $20B |
| 🇵🇱 Poland | ⛽ PKN Orlen | Energy | $20B |
| 🇵🇹 Portugal | 🔌 EDP Group | Energy | $16B |
| 🇬🇷 Greece | 🏦 Eurobank | Banking | $7B |
| 🇭🇺 Hungary | ⛽ MOL Group | Energy | $7B |
| 🇭🇷 Croatia | 🏦 Zagrebacka Banka | Banking | $6B |
| 🇷🇴 Romania | ⛽ Romgaz | Energy | $4B |
| 🇸🇮 Slovenia | 💊 Krka | Pharmaceuticals | $4B |
Note: Figures are rounded and last updated on April 15th, 2024. Countries with top publicly-traded companies worth under $4 billion are excluded.
Luxury supergiant LVMH—which owns brands like Tiffany, Christian Dior, and TAG Heuer to name a few—is Europe’s second largest company by market cap, at $420 billion.
Rounding out the top three is ASML, which produces equipment crucial to chip manufacturers, worth $380 billion.
When looking at the region, there is a vast disparity between EU member states and their most valuable companies.
For example, as mentioned earlier, Denmark’s Novo Nordisk and France’s LVMH are worth between $400-550 billion each. Meanwhile, some countries don’t even have a single publicly-listed company that is worth over $1 billion.
In fact, only 12 EU countries (less than half of the union) are home to the top 100 most valuable companies within the bloc. An additional four countries are represented if you look at the list of the top 200 companies.

-

 Wealth6 days ago
Charted: Which City Has the Most Billionaires in 2024?
-

 Mining2 weeks ago
Gold vs. S&P 500: Which Has Grown More Over Five Years?
-

 Uranium2 weeks ago
The World’s Biggest Nuclear Energy Producers
-

 Education2 weeks ago
How Hard Is It to Get Into an Ivy League School?
-

 Debt2 weeks ago
How Debt-to-GDP Ratios Have Changed Since 2000
-

 Sports2 weeks ago
The Highest Earning Athletes in Seven Professional Sports
-

 Science2 weeks ago
Visualizing the Average Lifespans of Mammals
-

 Brands1 week ago
How Tech Logos Have Evolved Over Time