Mining
The Impact of COVID-19 Shutdowns on the Gold Supply Chain
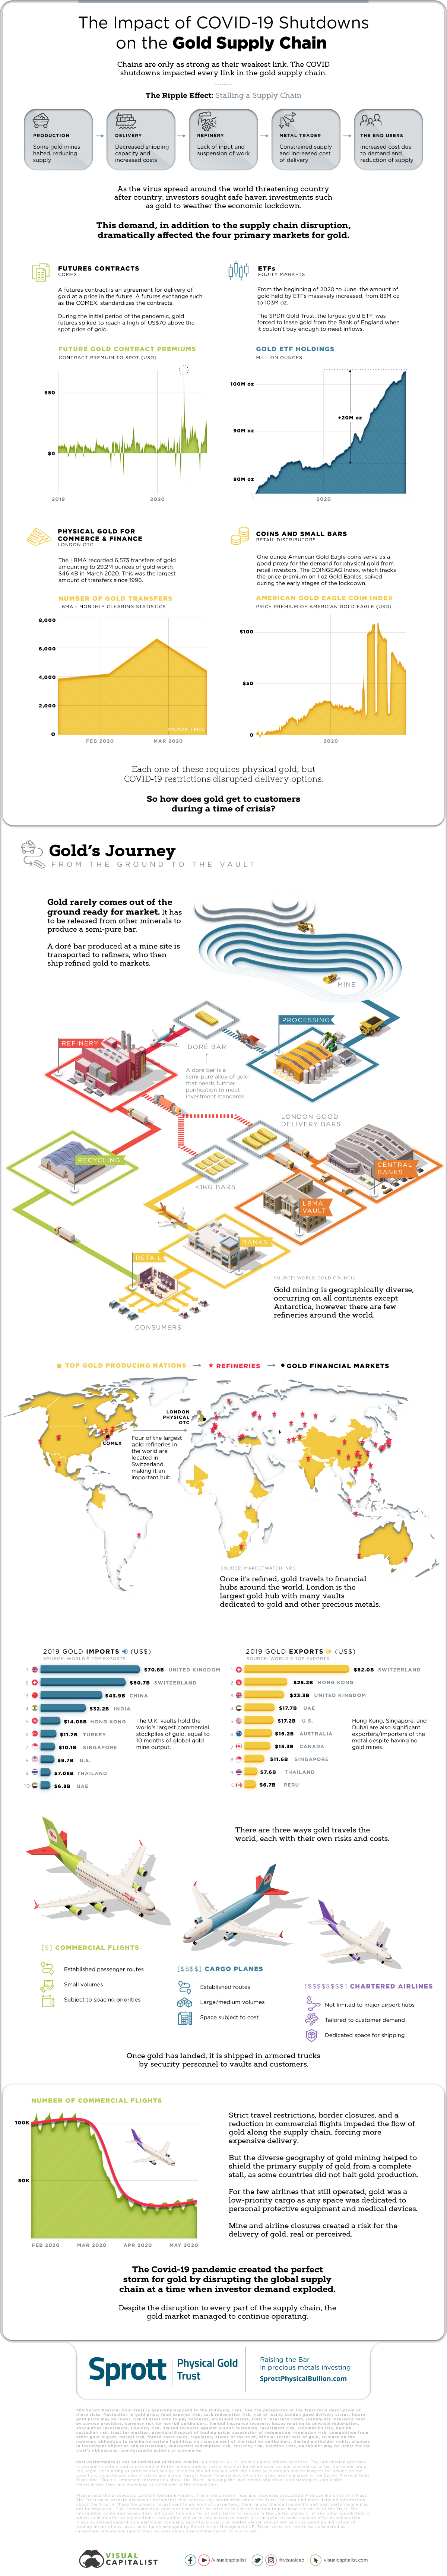
How COVID-19 Shutdowns Impact the Gold Supply Chain
Chains are only as strong as their weakest link—and recent COVID-19 shutdowns have affected every link in the gold supply chain, from producers to end-users.
Increased investor demand for gold coupled with a constrained supply has led to high prices and a bullish market, which has been operating despite these pressures on the supply chain.
Today’s infographic comes to us from Sprott Physical Bullion Trust and it outlines the gold supply chain and the impacts COVID shutdowns have had on the gold market.
The Ripple Effect: Stalling a Supply Chain
Disruptions to the gold supply chain have rippled all the way from the mine to the investor:
- Production
Some gold mines halted production due to the high-risk to COVID-19 exposure, reducing the supply of gold. In many nations, operations had to shut down as a result of COVID-19 based legal restrictions. - Delivery
Strict travel regulations restricted the shipment of gold and increased the costs of delivery as less air routes were available and medical supplies were prioritized. - Refinery
Refineries depend on gold production for input. A reduction in incoming gold and the suspension of labor work shortened the supply of refined gold. - Metal Traders
Towards the other end of the gold supply chain, traders have faced both constrained supply and increased cost of delivery. These increased costs have translated over to end-users. - The End Users
Higher demand, lower supply, and increased costs have resulted in higher prices for buyers of gold.
Gold: A Safe Haven for Investors
As the virus spread around the world threatening populations and economies, investors turned to safe-haven investments such as gold to hedge against an economic lockdown.
This increase in investor demand affected the four primary financial markets for gold:
- Futures Contracts:
A futures contract is an agreement for the delivery of gold at a fixed price in the future. These contracts are standardized by futures exchanges such as COMEX. During the initial periods of the pandemic, the price of gold futures spiked to reach a high of US$70 above the spot price. - Exchange-Traded Funds (ETFs):
An ETF is an investment fund traded on stock exchanges. ETFs hold assets such as stocks, bonds, and commodities such as gold. From the beginning of 2020 to June, the amount of gold held by ETFs massively increased, from 83 million oz to 103 million oz. The SPDR Gold Trust is a great example of how the surge in ETF demand for gold has played out—the organization was forced to lease gold from the Bank of England when it couldn’t buy enough from suppliers. - Physical Gold for Commerce and Finance:
The London Bullion Market Association (LBMA) is a market where gold is physically traded over-the-counter. The LBMA recorded 6,573 transfers of gold amounting to 29.2 million oz ($46.4 billion)—all in March 2020. This was the largest amount of monthly transfers since 1996. - Coins and Small Bars:
One ounce American Gold Eagle coins serve as a good proxy for the demand for physical gold from retail investors. The COINGEAG Index, which tracks the premium price of 1 oz. Gold Eagles, spiked during the early stages of the lockdown.
Each one of these markets requires access to physical gold. COVID-19 restrictions have disrupted shipping and delivery options, making it harder to access gold. The market for gold has been functioning nonetheless.
So how does gold get to customers during a time of crisis?
Gold’s Journey: From the Ground to the Vault
Gold ore goes through several stages before being ready for the market.
- Processing:
Gold must be released from other minerals to produce a doré bar—a semi-pure alloy of gold that needs further purification to meet investment standards. Doré bars are typically produced at mine sites and transported to refiners. - Refining:
Refineries are responsible for turning semi-pure gold alloys into refined, pure, gold. In addition to reprocessing doré bars from mines, refiners also recycle gold from scrap materials. Although gold mining is geographically diverse and occurs in all continents except Antarctica, there are only a handful of gold refineries around the world. - Transportation:
Once it’s refined, gold is transported to financial hubs around the world. There are three main ways gold travels the world, each with their own costs and benefits:- Commercial Flights:
Cheapest of the three options, commercial flights are useful in transporting gold over established passenger routes. However, the volume of gold carried by a commercial flight is typically small and subject to spacing priorities. - Cargo Planes:
At a relatively moderate cost, cargo planes carry medium to large amounts of gold along established trade routes. The space dedicated to cargo determines the cost, with higher volumes leading to higher shipping prices. - Chartered Airlines:
Chartered airlines offer a wider range of travel routes with dedicated shipping space and services tailored to customer demand. However, they charge a high price for these conveniences.
- Commercial Flights:
After reaching its destination via air, armored trucks with security personnel move the gold to vaults and customers in financial hubs around the world.
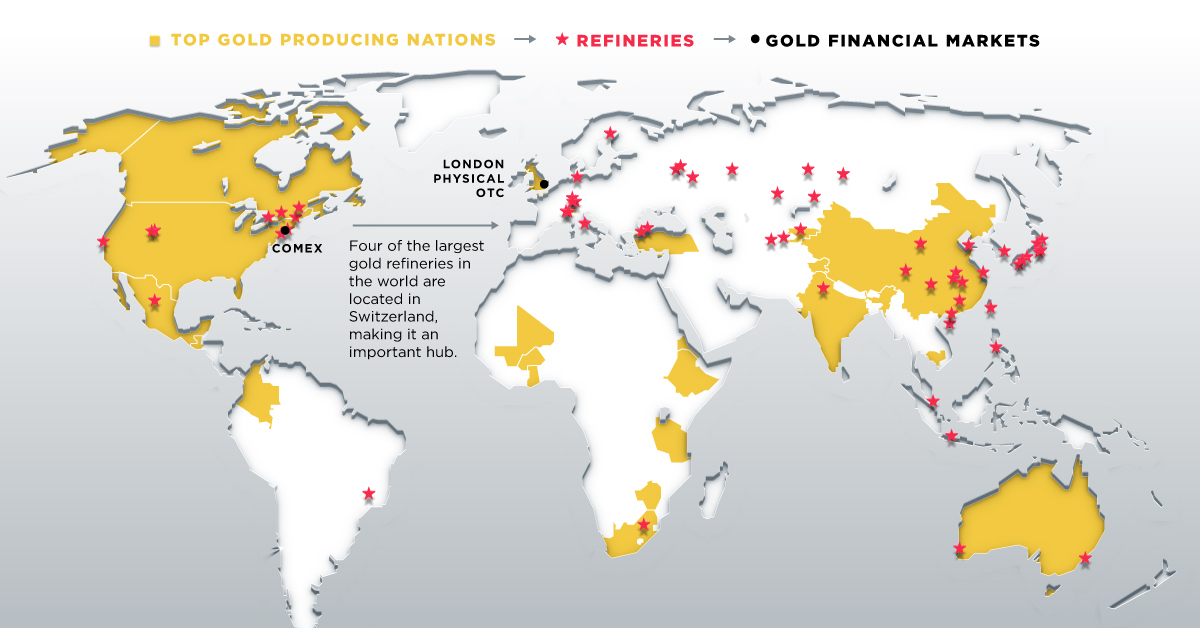
The World’s Biggest Gold Hubs
The U.K.’s bullion banks hold the world’s biggest commercial stockpiles of gold, equal to 10 months of global gold mine output. London is the largest gold hub, with numerous vaults dedicated to gold and other precious metals.
Four of the largest gold refineries in the world are located in Switzerland, making it an important part of the gold supply chain. Hong Kong, Singapore, and Dubai are surprising additions and remain significant traders of gold despite having no mines within their borders.
COVID-19: The Perfect Storm for Gold?
As countries took stringent safety measures such as travel restrictions and border closures, the number of commercial flights dropped exponentially across the world. For the few commercial airlines that still operated, gold was a low-priority cargo as space was dedicated to medical supplies.
This impeded the flow of gold through the supply chain, increasing the cost of delivery and the price of gold. However, thanks to the diverse geography of gold mining, some countries did not halt production—this helped avoid a complete stall in the supply of gold.
The COVID-19 pandemic has created the perfect storm for gold by disrupting the global supply chain while investor demand for gold exploded. Despite heightened delivery risks and disruptions, the gold market has managed to continue operating thus far.


Lithium
Ranked: The Top 10 EV Battery Manufacturers in 2023
Asia dominates this ranking of the world’s largest EV battery manufacturers in 2023.


The Top 10 EV Battery Manufacturers in 2023
This was originally posted on our Voronoi app. Download the app for free on iOS or Android and discover incredible data-driven charts from a variety of trusted sources.
Despite efforts from the U.S. and EU to secure local domestic supply, all major EV battery manufacturers remain based in Asia.
In this graphic we rank the top 10 EV battery manufacturers by total battery deployment (measured in megawatt-hours) in 2023. The data is from EV Volumes.
Chinese Dominance
Contemporary Amperex Technology Co. Limited (CATL) has swiftly risen in less than a decade to claim the title of the largest global battery group.
The Chinese company now has a 34% share of the market and supplies batteries to a range of made-in-China vehicles, including the Tesla Model Y, SAIC’s MG4/Mulan, and various Li Auto models.
| Company | Country | 2023 Production (megawatt-hour) | Share of Total Production |
|---|---|---|---|
| CATL | 🇨🇳 China | 242,700 | 34% |
| BYD | 🇨🇳 China | 115,917 | 16% |
| LG Energy Solution | 🇰🇷 Korea | 108,487 | 15% |
| Panasonic | 🇯🇵 Japan | 56,560 | 8% |
| SK On | 🇰🇷 Korea | 40,711 | 6% |
| Samsung SDI | 🇰🇷 Korea | 35,703 | 5% |
| CALB | 🇨🇳 China | 23,493 | 3% |
| Farasis Energy | 🇨🇳 China | 16,527 | 2% |
| Envision AESC | 🇨🇳 China | 8,342 | 1% |
| Sunwoda | 🇨🇳 China | 6,979 | 1% |
| Other | - | 56,040 | 8% |
In 2023, BYD surpassed LG Energy Solution to claim second place. This was driven by demand from its own models and growth in third-party deals, including providing batteries for the made-in-Germany Tesla Model Y, Toyota bZ3, Changan UNI-V, Venucia V-Online, as well as several Haval and FAW models.
The top three battery makers (CATL, BYD, LG) collectively account for two-thirds (66%) of total battery deployment.
Once a leader in the EV battery business, Panasonic now holds the fourth position with an 8% market share, down from 9% last year. With its main client, Tesla, now sourcing batteries from multiple suppliers, the Japanese battery maker seems to be losing its competitive edge in the industry.
Overall, the global EV battery market size is projected to grow from $49 billion in 2022 to $98 billion by 2029, according to Fortune Business Insights.

-

 Debt1 week ago
How Debt-to-GDP Ratios Have Changed Since 2000
-

 Markets2 weeks ago
Ranked: The World’s Top Flight Routes, by Revenue
-

 Countries2 weeks ago
Population Projections: The World’s 6 Largest Countries in 2075
-

 Markets2 weeks ago
The Top 10 States by Real GDP Growth in 2023
-

 Demographics2 weeks ago
The Smallest Gender Wage Gaps in OECD Countries
-

 United States2 weeks ago
Where U.S. Inflation Hit the Hardest in March 2024
-

 Green2 weeks ago
Top Countries By Forest Growth Since 2001
-

 United States2 weeks ago
Ranked: The Largest U.S. Corporations by Number of Employees