Markets
Visualizing the State of Global Debt, by Country
View the expanded version of this infographic to see all countries.
View the expanded version of this infographic to see all countries.


Visualizing the State of Global Debt, by Country
Since COVID-19 started its spread around the world in 2020, the global economy has been put to the test with supply chain disruptions, price volatility for commodities, challenges in the job market, and declining income from tourism. The World Bank has estimated that almost 97 million people have been pushed into extreme poverty as a result of the pandemic.
In order to help with this difficult situation, global governments have had to increase their expenditures to deal with higher healthcare costs, unemployment, food insecurity, and to help businesses to survive. Countries have taken on new debt to provide financial support for these measures, which has resulted in the highest global debt levels in half a century.
To analyze the extent of global debt, we’ve compiled debt-to-GDP data by country from the most recent World Economic Outlook report by the IMF.
Global Debt by Country: The Top 10 Most Indebted Nations
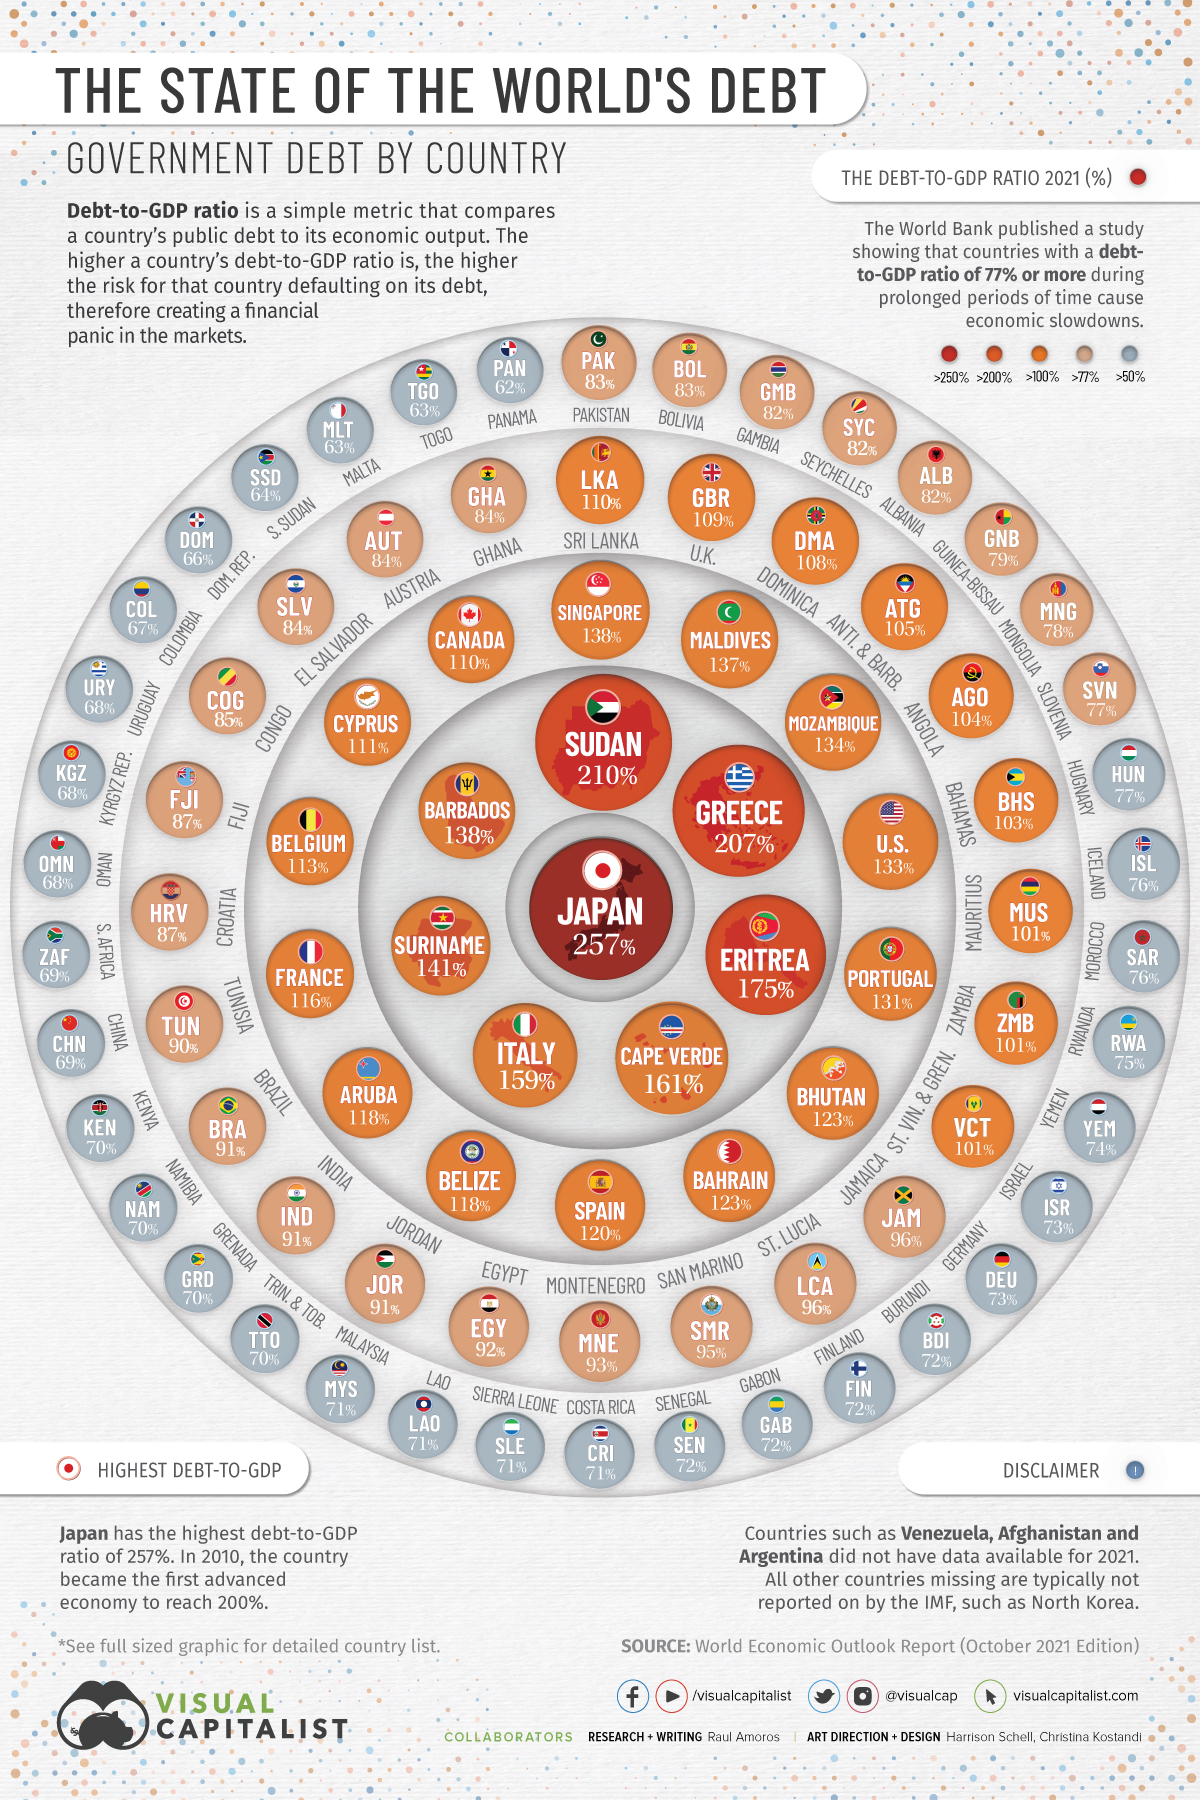
The debt-to-GDP ratio is a simple metric that compares a country’s public debt to its economic output. By comparing how much a country owes and how much it produces in a year, economists can measure a country’s theoretical ability to pay off its debt.
Let’s take a look at the top 10 countries in terms of debt-to-GDP:
| Rank | Country | Debt-to-GDP (2021) |
|---|---|---|
| #1 | Japan 🇯🇵 | 257% |
| #2 | Sudan 🇸🇩 | 210% |
| #3 | Greece 🇬🇷 | 207% |
| #4 | Eritrea 🇪🇷 | 175% |
| #5 | Cape Verde 🇨🇻 | 161% |
| #6 | Italy 🇮🇹 | 155% |
| #7 | Suriname 🇸🇷 | 141% |
| #8 | Barbados 🇧🇧 | 138% |
| #9 | Singapore 🇸🇬 | 138% |
| #10 | Maldives 🇲🇻 | 137% |
Source: World Economic Outlook Report (October 2021 Edition)
Japan, Sudan, and Greece top the list with debt-to-GDP ratios well above 200%, followed by Eritrea (175%), Cape Verde (160%), and Italy (154%).
Japan’s debt level won’t come as a surprise to most. In 2010, it became the first country to reach a debt-to-GDP ratio 200%, and it now sits at 257%. In order to finance new debt, the Japanese government issues bonds which get bought up primarily by the Bank of Japan.
By the end of 2020, the Bank of Japan owned 45% of government debt outstanding.
What is the main risk of a high debt-to-GDP ratio?
A rapid increase in government debt is a major cause for concern. Generally, the higher a country’s debt-to-GDP ratio is, the higher chance that country could default on its debt, therefore creating a financial panic in the markets.
The World Bank published a study showing that countries that maintained a debt-to-GDP ratio of over 77% for prolonged periods of time experienced economic slowdowns.
COVID-19 has worsened a debt crisis that has been brewing since the 2008 global recession. A report from the International Monetary Fund (IMF) shows that at least 100 countries will have to reduce expenditures on health, education, and social protection. Also, 30 countries in the developing world have high levels of debt distress, meaning they’re experiencing great difficulties in servicing their debt.
This crisis is hitting poor and middle-income countries harder than rich countries. Wealthier countries are borrowing to launch fiscal stimulus packages while low and middle income countries cannot afford such measures, potentially resulting in wider global inequality.
The IMF Warns of Interest Rates
Global debt reached $226 trillion by the end of 2020, seeing the biggest one-year increase since World War II.
Borrowing by governments accounted for slightly over half of the $28 trillion increase, bringing global public debt ratio to a record of 99% of GDP. As interest rates rise, IMF officials warn that higher interest rates will diminish the impact of fiscal spending, and cause debt sustainability concerns to intensify. “The risks will be magnified if global interest rates rise faster than expected and growth falters,” the officials wrote.
“A significant tightening of financial conditions would heighten the pressure on the most highly indebted governments, households, and firms. If the public and private sectors are forced to deleverage simultaneously, growth prospects will suffer.”
Editor’s note: All data used in our visualization was extracted from the World Economic Outlook Report (October 2021 Edition) and The World Bank. We will update this data when the new report is available in April 2022.


Markets
The World’s Fastest Growing Emerging Markets (2024-2029 Forecast)
Here are the emerging markets with the fastest projected growth rates over the next five years based on analysis from the IMF.
The World’s Fastest Growing Emerging Markets (2024-2029)
Large emerging markets are forecast to play a greater role in powering global economic growth in the future, driven by demographic shifts and a growing consumer class.
At the same time, many smaller nations are projected to see their economies grow at double the global average over the next five years due to rich natural resource deposits among other factors. That said, elevated debt levels do present risks to future economic activity.
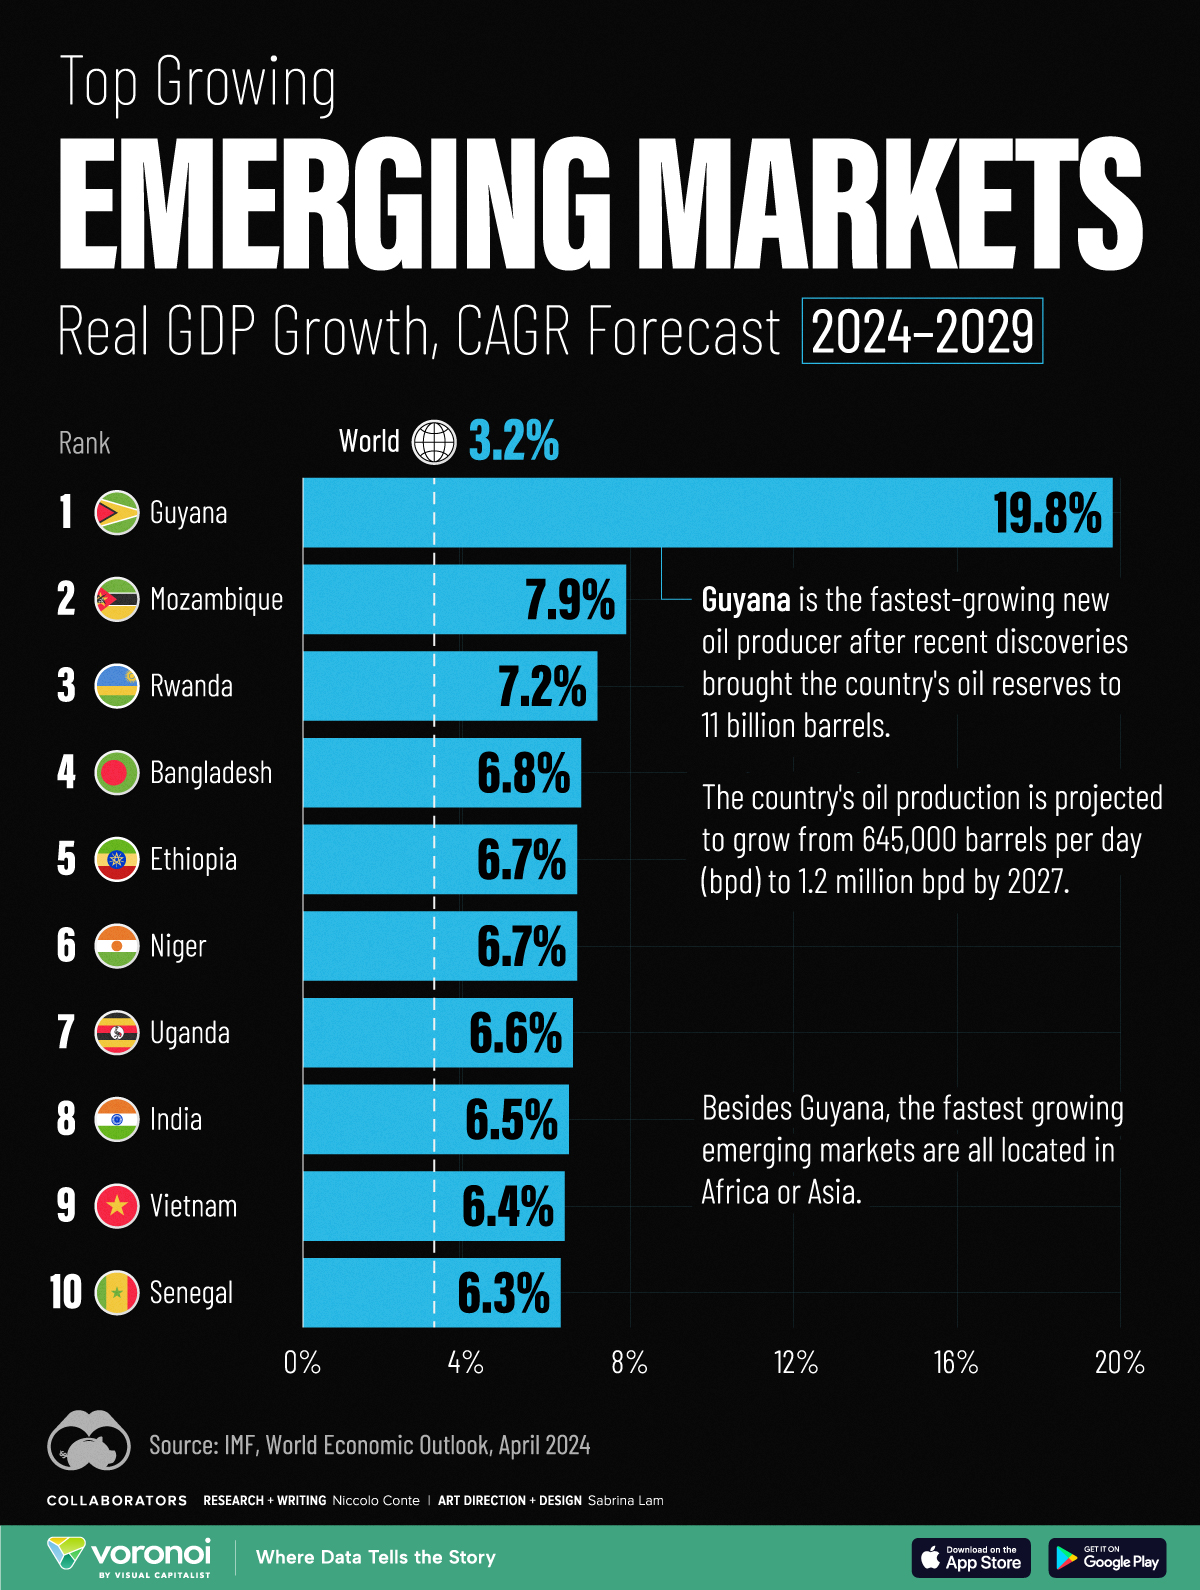
This graphic shows the emerging markets with the fastest projected growth through to 2029, based on data from the International Monetary Fund’s 2024 World Economic Outlook.
Get the Key Insights of the IMF’s World Economic Outlook
Want a visual breakdown of the insights from the IMF’s 2024 World Economic Outlook report?
This visual is part of a special dispatch of the key takeaways exclusively for VC+ members.
Get the full dispatch of charts by signing up to VC+.
Top 10 Emerging Markets
Here are the fastest-growing emerging economies, based on real GDP compound annual growth rate (CAGR) forecasts over the period of 2024-2029:
| Rank | Country | Projected CAGR (2024-2029) |
|---|---|---|
| 1 | 🇬🇾 Guyana | 19.8% |
| 2 | 🇲🇿 Mozambique | 7.9% |
| 3 | 🇷🇼 Rwanda | 7.2% |
| 4 | 🇧🇩 Bangladesh | 6.8% |
| 5 | 🇪🇹 Ethiopia | 6.7% |
| 6 | 🇳🇪 Niger | 6.7% |
| 7 | 🇺🇬 Uganda | 6.6% |
| 8 | 🇮🇳 India | 6.5% |
| 9 | 🇻🇳 Vietnam | 6.4% |
| 10 | 🇸🇳 Senegal | 6.3% |
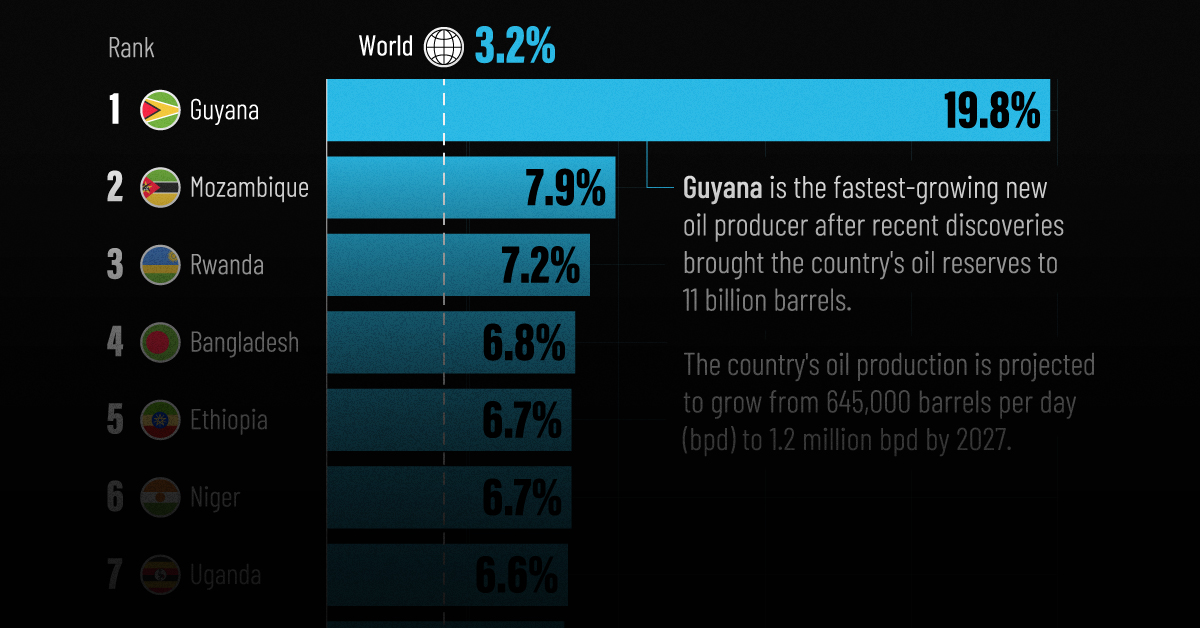
As South America’s third-smallest nation by land area, Guyana is projected to be the world’s fastest growing economy from now to 2029.
This is thanks to a significant discovery of oil deposits in 2015 by ExxonMobil, which has propelled the country’s economy to grow by fourfold over the last five years alone. By 2028, the nation of just 800,000 people is projected to have the highest crude oil production per capita, outpacing Kuwait for the first time.
Bangladesh, where 85% of exports are driven by the textiles industry, is forecast to see the strongest growth in Asia. In fact, over the last 30 years, the country of 170 million people has not had a single year of negative growth.
In eighth place overall is India, projected to achieve a 6.5% CAGR in real GDP through to 2029. This growth is forecast to be fueled by population trends, public investment, and strong consumer demand.
Get the Full Analysis of the IMF’s Outlook on VC+
This visual is part of an exclusive special dispatch for VC+ members which breaks down the key takeaways from the IMF’s 2024 World Economic Outlook.
For the full set of charts and analysis, sign up for VC+.

-

 Green6 days ago
The Carbon Footprint of Major Travel Methods
-

 Misc2 weeks ago
How Hard Is It to Get Into an Ivy League School?
-

 Debt2 weeks ago
How Debt-to-GDP Ratios Have Changed Since 2000
-

 Sports2 weeks ago
The Highest Earning Athletes in Seven Professional Sports
-

 Science2 weeks ago
Visualizing the Average Lifespans of Mammals
-

 Brands2 weeks ago
How Tech Logos Have Evolved Over Time
-

 Energy1 week ago
Ranked: The Top 10 EV Battery Manufacturers in 2023
-

 Demographics1 week ago
Countries With the Largest Happiness Gains Since 2010