Datastream
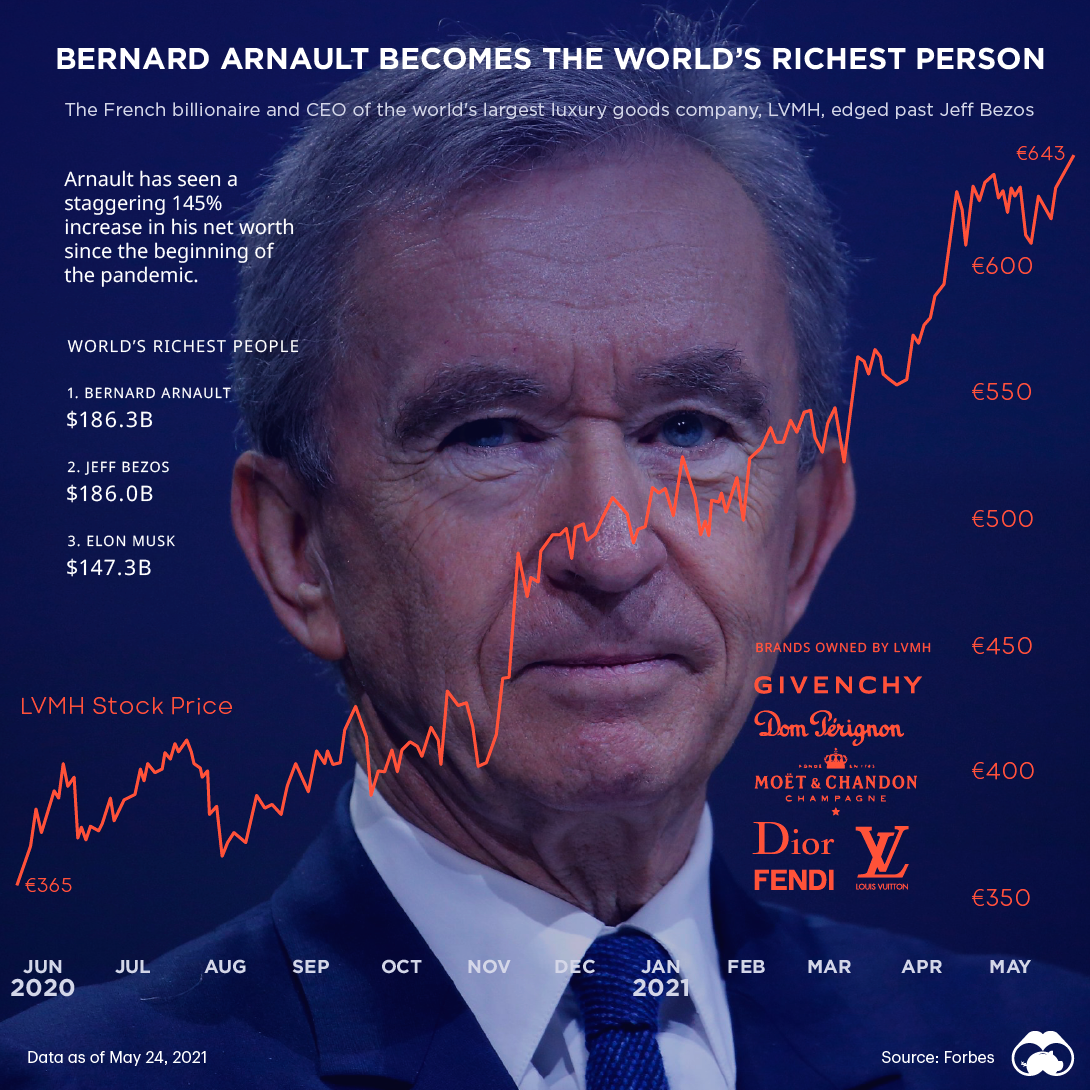
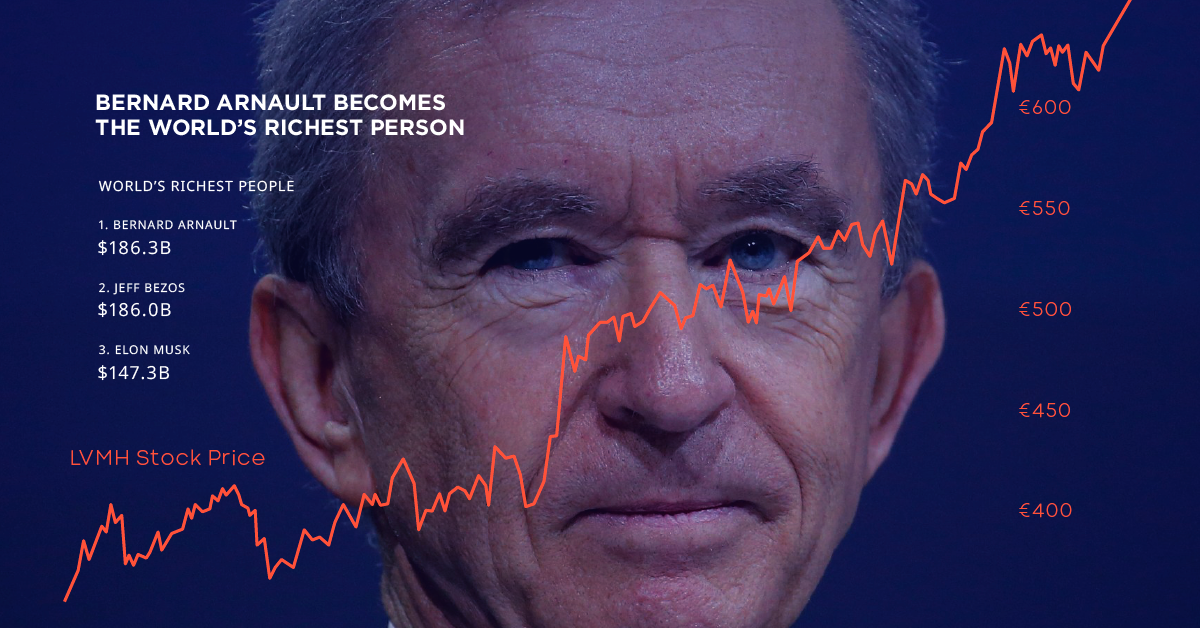
France’s Bernard Arnault Becomes the World’s Richest Person
The Briefing
- French billionaire, Bernard Arnault, became the world’s richest person with a net worth surpassing $186B
- Arnault, whose fortunes are largely tied to luxury conglomerate LVMH, has seen a staggering 145% increase in his net worth since the beginning of the pandemic
France’s Bernard Arnault Becomes the World’s Richest Person
This week, French billionaire, Bernard Arnault, became the world’s richest person.
Arnault’s rise into top spot is particularly noteworthy since American billionaires – particularly in the technology sector – have dominated the world’s richest people ranking for a number of years. Amazon’s Jeff Bezos remains neck-and-neck with Arnault, with Elon Musk still within striking distance.
| Rank | Name | Country | Net Worth (May 24, 2021) |
|---|---|---|---|
| 1 | Bernard Arnault | 🇫🇷 France | $186.3 billion |
| 2 | Jeff Bezos | 🇺🇸 United States | $186.0 billion |
| 3 | Elon Musk | 🇺🇸 United States | $147.3 billion |
Jeff Bezos began 2021 in top spot, but has been challenged by both Elon Musk and Bernard Arnault. The former took a hit after Tesla’s stock began to cool off after hitting a record high in Q1 2021.
Arnault’s name may be new to some, but he has been on of the top five richest people globally since 2018, and has been a billionaire for well over a decade. The French tycoon got his start in the fashion space by parlaying a fortune made in construction into the purchase of Christian Dior in 1985.
Vive la France
Bernard Arnault oversees an empire that includes many iconic French luxury brands, including; Louis Vuitton, Dom Pérignon, and Christian Dior. His luxury group, LVMH (Louis Vuitton Moët Hennessy), also spans retail and hospitality industries.
It may be surprising that LVMH is thriving during the COVID-19 pandemic, but the company has been buoyed by strong sales in Asia – especially China.
In January 2021, LVMH completed a deal for Tiffany & Co for nearly $16 billion, in what is possibly the largest luxury brand acquisition in history.
» Like this? Then you might like this article on The World’s Richest People 2021
Where does this data come from?
Source: Forbes’ Real-Time Billionaire Tracker (Data as of May 26, 2021)
Note: Rankings on the Forbes Billionaire Tracker fluctuate throughout the day. Given the similar net worth of both Jeff Bezos and Bernard Arnault, the two men may trade top spot back and forth for a time.


Datastream
Can You Calculate Your Daily Carbon Footprint?
Discover how the average person’s carbon footprint impacts the environment and learn how carbon credits can offset your carbon footprint.


The Briefing
- A person’s carbon footprint is substantial, with activities such as food consumption creating as much as 4,500 g of CO₂ emissions daily.
- By purchasing carbon credits from Carbon Streaming Corporation, you can offset your own emissions and fund positive climate action.
Your Everyday Carbon Footprint
While many large businesses and countries have committed to net-zero goals, it is essential to acknowledge that your everyday activities also contribute to global emissions.
In this graphic, sponsored by Carbon Streaming Corporation, we will explore how the choices we make and the products we use have a profound impact on our carbon footprint.
Carbon Emissions by Activity
Here are some of the daily activities and products of the average person and their carbon footprint, according to Clever Carbon.
| Household Activities & Products | CO2 Emissions (g) |
|---|---|
| 💡 Standard Light Bulb (100 watts, four hours) | 172 g |
| 📱 Mobile Phone Use (195 minutes per day)* | 189 g |
| 👕 Washing Machine (0.63 kWh) | 275 g |
| 🔥 Electric Oven (1.56 kWh) | 675 g |
| ♨️ Tumble Dryer (2.5 kWh) | 1,000 g |
| 🧻 Toilet Roll (2 ply) | 1,300 g |
| 🚿 Hot Shower (10 mins) | 2,000 g |
| 🚙 Daily Commute (one hour, by car) | 3,360 g |
| 🍽️ Average Daily Food Consumption (three meals of 600 calories) | 4,500 g |
| *Phone use based on yearly use of 69kg per the source, Reboxed | |
Your choice of transportation plays a crucial role in determining your carbon footprint. For instance, a 15 km daily commute to work on public transport generates an average of 1,464 g of CO₂ emissions. Compared to 3,360 g—twice the volume for a journey the same length by car.
By opting for more sustainable modes of transport, such as cycling, walking, or public transportation, you can significantly reduce your carbon footprint.
Addressing Your Carbon Footprint
One way to compensate for your emissions is by purchasing high-quality carbon credits.
Carbon credits are used to help fund projects that avoid, reduce or remove CO₂ emissions. This includes nature-based solutions such as reforestation and improved forest management, or technology-based solutions such as the production of biochar and carbon capture and storage (CCS).
While carbon credits offer a potential solution for individuals to help reduce global emissions, public awareness remains a significant challenge. A BCG-Patch survey revealed that only 34% of U.S. consumers are familiar with carbon credits, and only 3% have purchased them in the past.
About Carbon Streaming
By financing the creation or expansion of carbon projects, Carbon Streaming Corporation secures the rights to future carbon credits generated by these sustainable projects. You can then purchase these carbon credits to help fund climate solutions around the world and compensate for your own emissions.
Ready to get involved?
>> Learn more about purchasing carbon credits at Carbon Streaming

-

 Debt1 week ago
How Debt-to-GDP Ratios Have Changed Since 2000
-

 Markets2 weeks ago
Ranked: The World’s Top Flight Routes, by Revenue
-

 Countries2 weeks ago
Population Projections: The World’s 6 Largest Countries in 2075
-

 Markets2 weeks ago
The Top 10 States by Real GDP Growth in 2023
-

 Demographics2 weeks ago
The Smallest Gender Wage Gaps in OECD Countries
-

 United States2 weeks ago
Where U.S. Inflation Hit the Hardest in March 2024
-

 Green2 weeks ago
Top Countries By Forest Growth Since 2001
-

 United States2 weeks ago
Ranked: The Largest U.S. Corporations by Number of Employees