Markets
The Influence of Family-Owned Businesses, by Share of GDP


Family-Owned Businesses, by Share of GDP
In many ways, the engine of global economic growth is hidden in plain sight.
Family-owned businesses, which make up 90% of global enterprises, have driven job creation and entrepreneurship over history. While the majority of these are mom-and-pop shops, some of the world’s largest companies, from Walmart to Ford, are family-run.
This graphic shows the economic influence of family businesses in select countries, with analysis from Tharawat.
Family Businesses and the World Economy
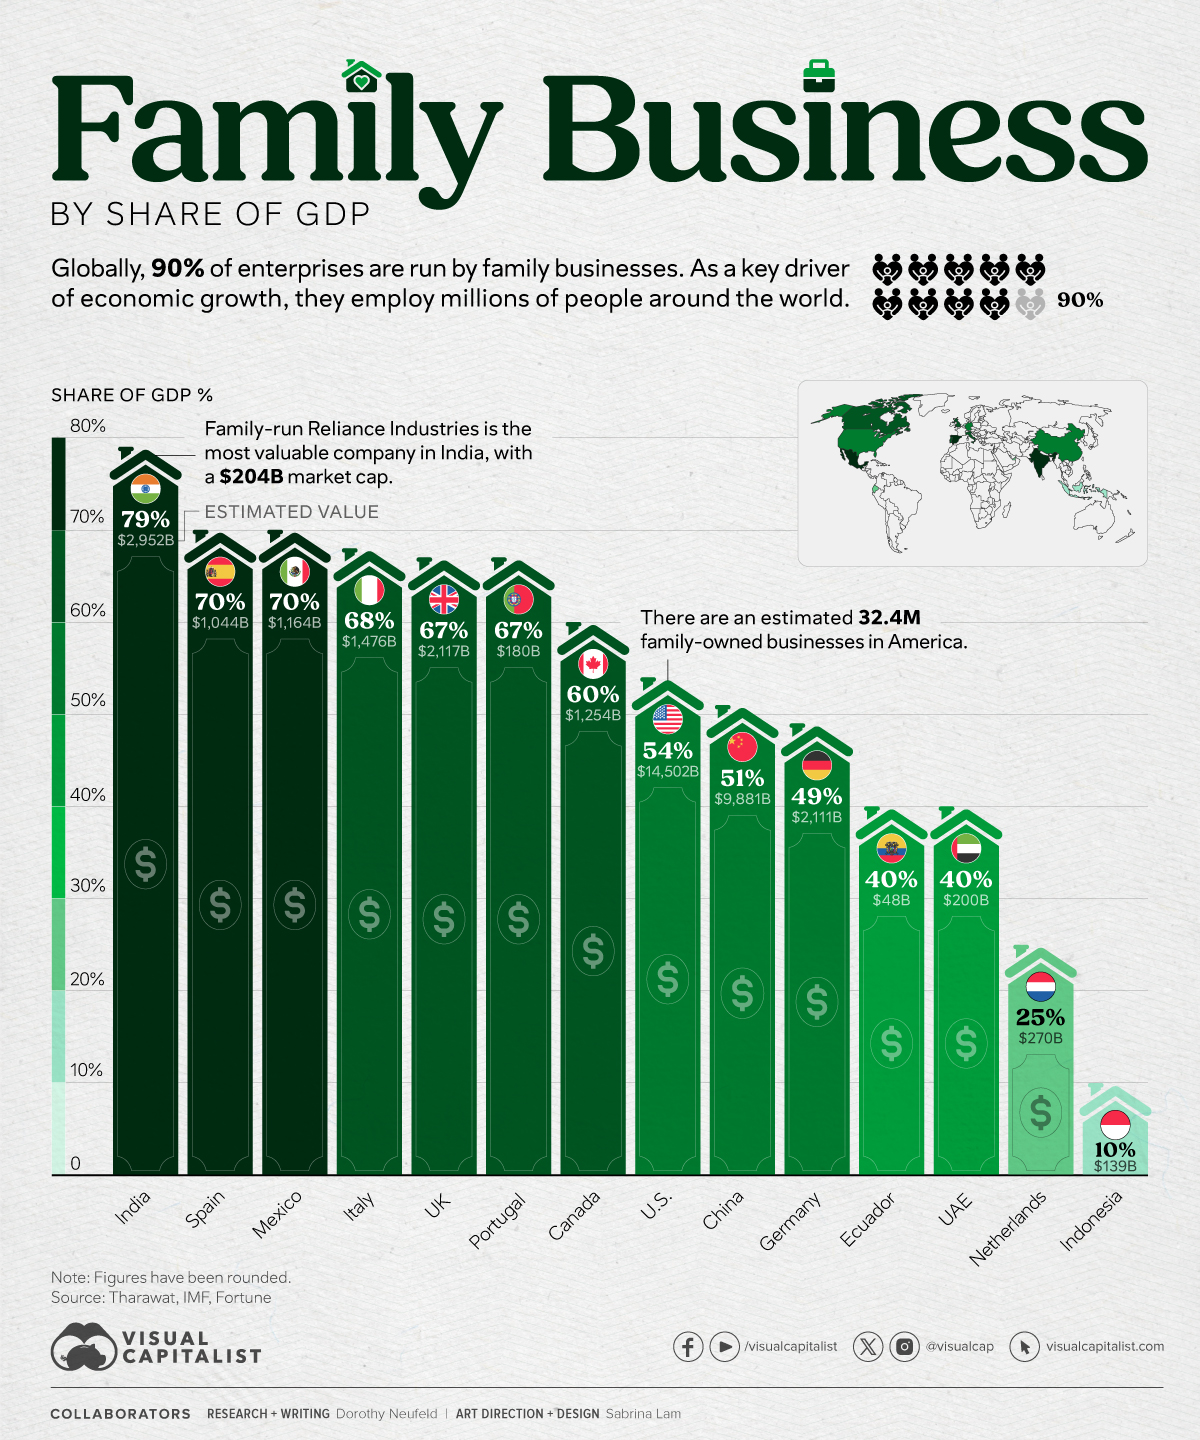
Below, we show the economic contribution of family businesses around the world:
| Country | Family Business Share of GDP | GDP 2023 | Estimated Contribution to GDP |
|---|---|---|---|
| 🇮🇳 India | 79% | $3,737B | $2,952B |
| 🇪🇸 Spain | 70% | $1,492B | $1,044B |
| 🇲🇽 Mexico | 70% | $1,663B | $1,164B |
| 🇮🇹 Italy | 68% | $2,170B | $1,476B |
| 🇬🇧 UK | 67% | $3,159B | $2,117B |
| 🇵🇹 Portugal | 67% | $268B | $180B |
| 🇨🇦 Canada | 60% | $2,090B | $1,254B |
| 🇺🇸 U.S. | 54% | $26,855B | $14,502B |
| 🇨🇳 China | 51% | $19,374B | $9,881B |
| 🇩🇪 Germany | 49% | $4,309B | $2,111B |
| 🇪🇨 Ecuador | 40% | $121B | $48B |
| 🇦🇪 UAE | 40% | $499B | $200B |
| 🇳🇱 Netherlands | 25% | $1,081B | $270B |
| 🇮🇩 Indonesia | 10% | $1,392B | $139B |
As the above table shows, 79% of India’s economic output is fueled by family-owned businesses, the highest across the dataset.
Reliance Industries is the largest family enterprise in the country, and the 10th-largest globally. Founded in 1973, it is run by the Ambani family and has a $204 billion market capitalization as of December 2023.
Following India are Spain and Mexico, with family businesses making up 70% of GDP and contributing over $1 trillion to these economies each year.
In the U.S., an estimated 32.4 million businesses are family-owned that collectively generate $14.5 trillion in GDP. The largest of these enterprises are Walmart, Berkshire Hathaway, and Cargill.
Family Offices in Private Capital Markets
Just as family businesses have significant influence over global GDP, family offices also own a large portion of global assets.
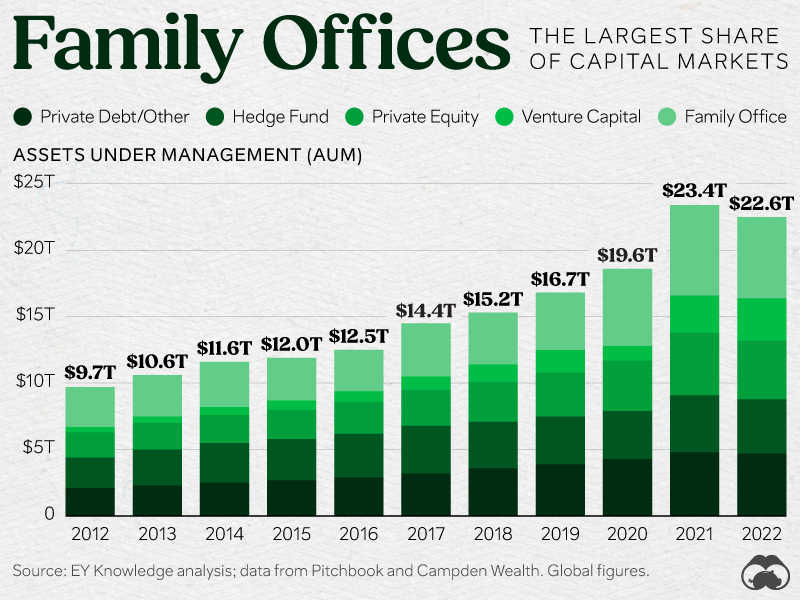
In fact, they make 27% of private capital markets globally, with $6.1 trillion in assets under management—more than doubling over the last decade.
While the majority of family office assets are invested in funds, there is a growing trend of investing directly in target companies, such as tech start-ups.
By 2027, Ernst & Young projects that private markets will expand considerably, facing a similar trend seen over the last decade—with family offices playing a key role in driving this growth.


Markets
Visualizing Global Inflation Forecasts (2024-2026)
Here are IMF forecasts for global inflation rates up to 2026, highlighting a slow descent of price pressures amid resilient global growth.


Visualizing Global Inflation Forecasts (2024-2026)
Global inflation rates are gradually descending, but progress has been slow.
Today, the big question is if inflation will decline far enough to trigger easing monetary policy. So far, the Federal Reserve has held rates for nine months amid stronger than expected core inflation, which excludes volatile energy and food prices.
Yet looking further ahead, inflation forecasts from the International Monetary Fund (IMF) suggest that inflation will decline as price pressures ease, but the path of disinflation is not without its unknown risks.
This graphic shows global inflation forecasts, based on data from the April 2024 IMF World Economic Outlook.
Get the Key Insights of the IMF’s World Economic Outlook
Want a visual breakdown of the insights from the IMF’s 2024 World Economic Outlook report?
This visual is part of a special dispatch of the key takeaways exclusively for VC+ members.
Get the full dispatch of charts by signing up to VC+.
The IMF’s Inflation Outlook
Below, we show the IMF’s latest projections for global inflation rates through to 2026:
| Year | Global Inflation Rate (%) | Advanced Economies Inflation Rate (%) | Emerging Market and Developing Economies Inflation Rate (%) |
|---|---|---|---|
| 2019 | 3.5 | 1.4 | 5.1 |
| 2020 | 3.2 | 0.7 | 5.2 |
| 2021 | 4.7 | 3.1 | 5.9 |
| 2022 | 8.7 | 7.3 | 9.8 |
| 2023 | 6.8 | 4.6 | 8.3 |
| 2024 | 5.9 | 2.6 | 8.3 |
| 2025 | 4.5 | 2.0 | 6.2 |
| 2026 | 3.7 | 2.0 | 4.9 |
After hitting a peak of 8.7% in 2022, global inflation is projected to fall to 5.9% in 2024, reflecting promising inflation trends amid resilient global growth.
While inflation has largely declined due to falling energy and goods prices, persistently high services inflation poses challenges to mitigating price pressures. In addition, the IMF highlights the potential risk of an escalating conflict in the Middle East, which could lead to energy price shocks and higher shipping costs.
These developments could negatively affect inflation scenarios and prompt central banks to adopt tighter monetary policies. Overall, by 2026, global inflation is anticipated to decline to 3.7%—still notably above the 2% target set by several major economies.
Adding to this, we can see divergences in the path of inflation between advanced and emerging economies. While affluent nations are forecast to see inflation edge closer to the 2% target by 2026, emerging economies are projected to have inflation rates reach 4.9%—falling closer to their pre-pandemic averages.
Get the Full Analysis of the IMF’s Outlook on VC+
This visual is part of an exclusive special dispatch for VC+ members which breaks down the key takeaways from the IMF’s 2024 World Economic Outlook.
For the full set of charts and analysis, sign up for VC+.

-

 Culture6 days ago
The World’s Top Media Franchises by All-Time Revenue
-

 Science2 weeks ago
Visualizing the Average Lifespans of Mammals
-

 Brands2 weeks ago
How Tech Logos Have Evolved Over Time
-

 Energy2 weeks ago
Ranked: The Top 10 EV Battery Manufacturers in 2023
-

 Demographics2 weeks ago
Countries With the Largest Happiness Gains Since 2010
-

 Economy2 weeks ago
VC+: Get Our Key Takeaways From the IMF’s World Economic Outlook
-

 Demographics2 weeks ago
The Countries That Have Become Sadder Since 2010
-

 Money1 week ago
Charted: Who Has Savings in This Economy?