Economy
This Simple Chart Reveals the Distribution Of Global Wealth
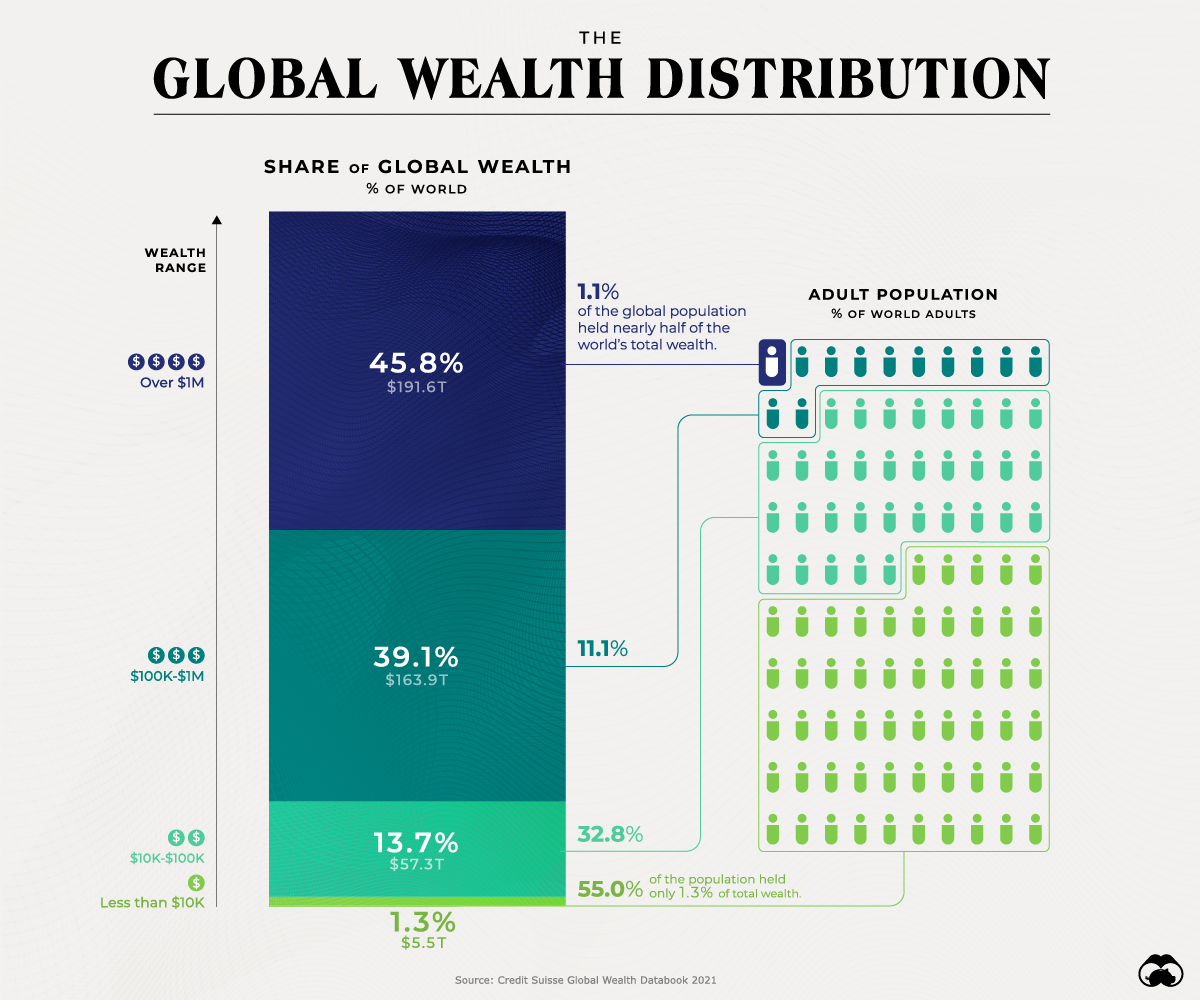


The Global Wealth Distribution in One Chart
The pandemic resulted in global wealth taking a significant dip in the first part of 2020. By the end of March, global household wealth had already declined by around 4.4%.
Interestingly, after much monetary and fiscal stimulus from governments around the world, global household wealth was more than able to recover, finishing up the year at $418.3 trillion, a 7.4% gain from the previous year.
Using data from Credit Suisse, this graphic looks at how global wealth is distributed among the adult population.
How is Global Wealth Distributed?
While individuals worth more than $1 million constitute just 1.1% of the world’s population, they hold 45.8% of global wealth.
| Wealth Range | Wealth | Global Share (%) | Adult Population |
|---|---|---|---|
| Over $1M | $191.6 trillion | 45.8% | Held by 1.1% |
| $100k-$1M | $163.9 trillion | 39.1% | Held by 11.1% |
| $10k-$100k | $57.3 trillion | 13.7% | Held by 32.8% |
| Less than $10k | $5.5 trillion | 1.3% | Held by 55.0% |
| Total | $418.3 trillion | 100.0% | Held by 100.0% |
On the other end of the spectrum, 55% of the population owns only 1.3% of global wealth.
And between these two extreme wealth distribution cases, the rest of the world’s population has a combined 52.8% of the wealth.
Global Wealth Distribution by Region
While wealth inequality is especially evident within the wealth ranges mentioned above, these differences can also be seen on a more regional basis between countries.
In 2020, total wealth rose by $12.4 trillion in North America and $9.2 trillion in Europe. These two regions accounted for the bulk of the wealth gains, with China adding another $4.2 trillion and the Asia-Pacific region (excluding China and India) another $4.7 trillion.
Here is a breakdown of global wealth distribution by region:
| Region | Total Wealth (US$B) | Change in Total Wealth (US$B) | Change % | Wealth Per Adult (US$) | Change % |
|---|---|---|---|---|---|
| North America | 136,316 | 12,370 | 10.0 | 486,930 | 9.1 |
| Europe | 103,213 | 9,179 | 9.8 | 174,836 | 9.8 |
| Asia-Pacific | 75,277 | 4,694 | 6.7 | 60,790 | 5.0 |
| China | 74,884 | 4,246 | 6.0 | 67,771 | 5.4 |
| India | 12,833 | -594 | -4.4 | 14,252 | -6.1 |
| Latin America | 10,872 | -1,215 | -10.1 | 24,301 | -11.4 |
| Africa | 4,946 | 36 | 0.7 | 7,371 | -2.1 |
| World | 418,342 | 28,716 | 7.4 | 79,952 | 6.0 |
India and Latin America both recorded losses in 2020.
Total wealth fell in India by $594 billion, or 4.4%. Meanwhile, Latin America appears to have been the worst-performing region, with total wealth dropping by 11.4% or $1.2 trillion.
Post-COVID Global Outlook 2020-2025
Despite the burden of COVID-19 on the global economy, the world can expect robust GDP growth in the coming years, especially in 2021. The latest estimates by the International Monetary Fund in April 2021 suggest that global GDP in 2021 will total $100.1 trillion in nominal terms, up by 4.1% compared to last year.
The link in normal times between GDP growth and household wealth growth, combined with the expected rapid return of economic activity to its pre-pandemic levels, suggests that global wealth could grow again at a fast pace. According to Credit Suisse estimates, global wealth may rise by 39% over the next five years.
Low and middle-income countries will also play an essential role in the coming year. They are responsible for 42% of the growth, even though they account for just 33% of current wealth.


Public Opinion
Charted: How Americans Feel About Federal Government Agencies
Fourteen of 16 federal government agencies garnered more favorable responses than unfavorable ones. But what were the outliers?
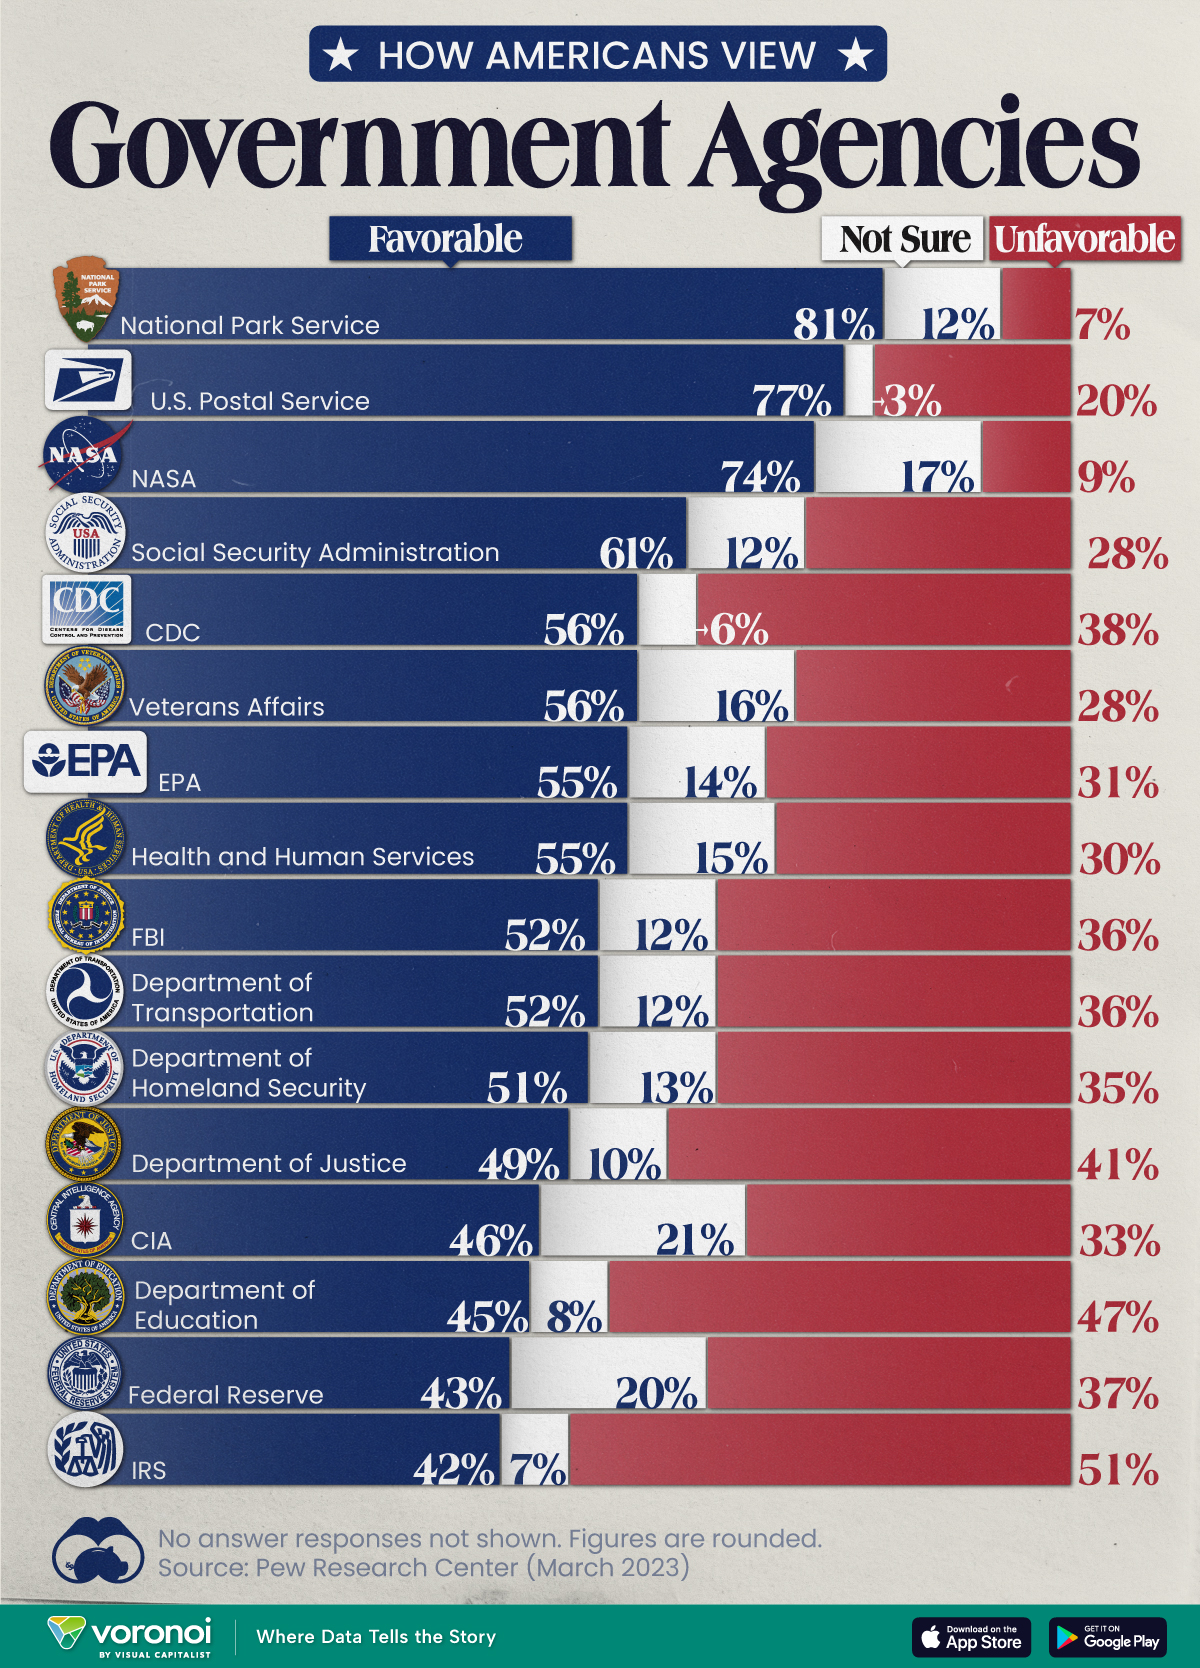

Chart: How Americans Rate 16 Federal Government Agencies
This was originally posted on our Voronoi app. Download the app for free on iOS or Android and discover incredible data-driven charts from a variety of trusted sources.
Come election time, America won’t hesitate to show its approval or disapproval of the country’s elected political representatives. That said, feelings about the federal bureaucracy and its associated agencies are a little harder to gauge.
We chart the results from an opinion poll conducted by Pew Research Center between March 13-19, 2023. In it, 10,701 adults—a representative of the U.S. adult population—were asked whether they felt favorably or unfavorably towards 16 different federal government agencies.
Americans Love the Park Service, Are Divided Over the IRS
Broadly speaking, 14 of the 16 federal government agencies garnered more favorable responses than unfavorable ones.
Of them, the Parks Service, Postal Service, and NASA all had the approval of more than 70% of the respondents.
| Agency | Favorable | Unfavorable | Not sure |
|---|---|---|---|
| 🏞️ National Park Service | 81% | 7% | 12% |
| 📮 U.S. Postal Service | 77% | 20% | 3% |
| 🚀 NASA | 74% | 9% | 17% |
| 💼 Social Security Administration | 61% | 28% | 12% |
| 🔬 CDC | 56% | 38% | 6% |
| 🎖️ Veterans Affairs | 56% | 28% | 16% |
| 🌿 EPA | 55% | 31% | 14% |
| 💉 Health & Human Services | 55% | 30% | 15% |
| 🕵️ FBI | 52% | 36% | 12% |
| 🚗 Department of Transportation | 52% | 36% | 12% |
| 🛡️ Department of Homeland Security | 51% | 35% | 13% |
| ⚖️ Department of Justice | 49% | 41% | 10% |
| 🕵️♂️ CIA | 46% | 33% | 21% |
| 📚 Department of Education | 45% | 47% | 8% |
| 💰 Federal Reserve | 43% | 37% | 20% |
| 💼 IRS | 42% | 51% | 7% |
Note: Figures are rounded. No answer responses are not shown.
Only the Department of Education and the IRS earned more unfavorable responses, and between them, only the IRS had a majority (51%) of unfavorable responses.
There are some caveats to remember with this data. Firstly, tax collection is a less-friendly activity than say, maintaining picturesque parks. Secondly, the survey was conducted a month before taxes were typically due, a peak time for experiencing filing woes.
Nevertheless, the IRS has come under fire in recent years. As per a New York Times article in 2019, eight years of budget cuts have stymied the agency’s ability to scrutinize tax filings from wealthier and more sophisticated filers.
At the same time poorer Americans are facing increasing audits on wage subsidies available to low income workers. According to a Transactional Records Access Clearinghouse report, this subset of filers was audited five-and-a-half more times the average American.

-

 Technology5 days ago
Mapped: The Number of AI Startups By Country
-

 Markets2 weeks ago
The Best U.S. Companies to Work for According to LinkedIn
-

 Economy2 weeks ago
Ranked: The Top 20 Countries in Debt to China
-

 Politics2 weeks ago
Charted: Trust in Government Institutions by G7 Countries
-

 Energy2 weeks ago
Mapped: The Age of Energy Projects in Interconnection Queues, by State
-

 Mining2 weeks ago
Visualizing Global Gold Production in 2023
-

 Markets1 week ago
Visualized: Interest Rate Forecasts for Advanced Economies
-

 Economy1 week ago
The Most Valuable Companies in Major EU Economies