Demographics
Where Will the World’s Next 1,000 Babies Be Born?
Article/Editing:
View a higher resolution version of this map.
Where Will the World’s Next 1,000 Babies Be Born?
View a higher resolution version of this map.
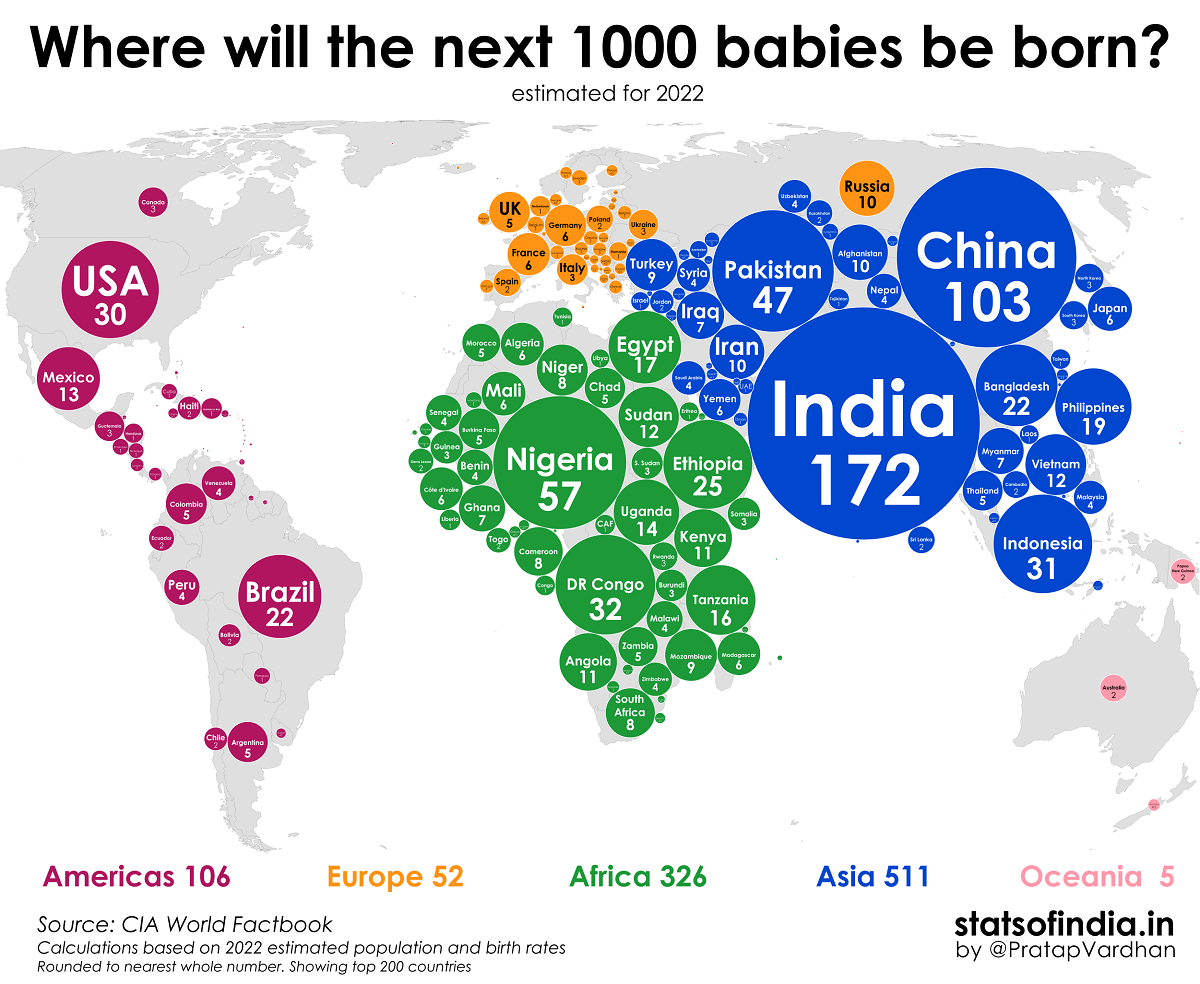
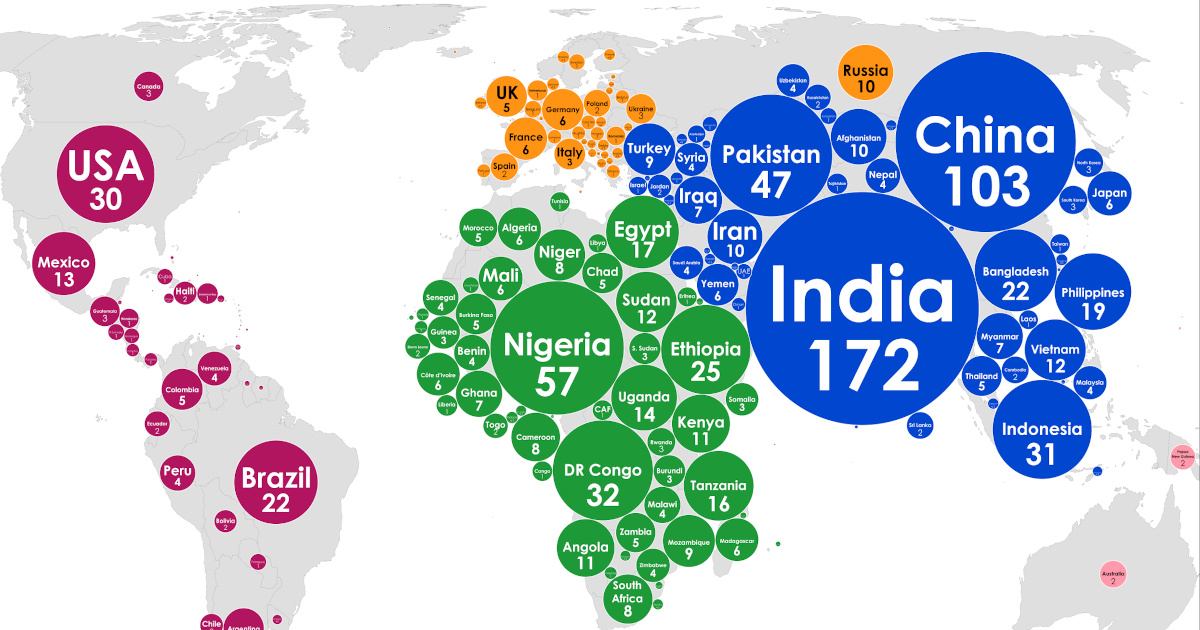
Every four minutes, approximately 1,000 babies are born across the globe. But in which countries are these babies the most statistically likely to come from?
Using data from the CIA World Factbook, this graphic by Pratap Vardhan (Stats of India) paints a picture of the world’s demographics, showing which countries are most likely to welcome the next 1,000 babies based on population and birth rates as of 2022 estimates.
The Next 1,000 Babies, By Country
Considering India has a population of nearly 1.4 billion, it’s fairly unsurprising that it ranks first on the list. Of every 1,000 babies born, the South Asian country accounts for roughly 172 of them.
| Place | Region | Births Per 1,000 Global Babies |
|---|---|---|
| 🇮🇳 India | Asia | 171.62 |
| 🇨🇳 China | Asia | 102.84 |
| 🇳🇬 Nigeria | Africa | 56.50 |
| 🇵🇰 Pakistan | Asia | 47.23 |
| 🇨🇩 Congo, Democratic Republic of the | Africa | 31.90 |
| 🇮🇩 Indonesia | Asia | 31.20 |
| 🇺🇸 United States | Americas | 30.42 |
| 🇪🇹 Ethiopia | Africa | 25.44 |
| 🇧🇷 Brazil | Americas | 22.27 |
| 🇧🇩 Bangladesh | Asia | 21.52 |
| 🇵🇭 Philippines | Asia | 18.75 |
| 🇪🇬 Egypt | Africa | 16.98 |
| 🇹🇿 Tanzania | Africa | 15.61 |
| 🇺🇬 Uganda | Africa | 13.89 |
| 🇲🇽 Mexico | Americas | 12.85 |
| 🇻🇳 Vietnam | Asia | 11.96 |
| 🇸🇩 Sudan | Africa | 11.79 |
| 🇰🇪 Kenya | Africa | 10.82 |
| 🇦🇴 Angola | Africa | 10.68 |
| 🇦🇫 Afghanistan | Asia | 9.98 |
| 🇷🇺 Russia | Europe | 9.85 |
| 🇮🇷 Iran | Asia | 9.73 |
| 🇲🇿 Mozambique | Africa | 8.72 |
| 🇹🇷 Turkey | Asia | 8.71 |
| 🇳🇪 Niger | Africa | 8.46 |
| 🇿🇦 South Africa | Africa | 7.84 |
| 🇨🇲 Cameroon | Africa | 7.65 |
| 🇮🇶 Iraq | Asia | 7.34 |
| 🇬🇭 Ghana | Africa | 6.94 |
| 🇲🇲 Myanmar | Asia | 6.90 |
| 🇯🇵 Japan | Asia | 6.34 |
| 🇲🇱 Mali | Africa | 6.25 |
| 🇩🇿 Algeria | Africa | 6.01 |
| 🇨🇮 Cote d'Ivoire | Africa | 5.97 |
| 🇲🇬 Madagascar | Africa | 5.93 |
| 🇫🇷 France | Europe | 5.85 |
| 🇩🇪 Germany | Europe | 5.62 |
| 🇾🇪 Yemen | Asia | 5.61 |
| 🇨🇴 Colombia | Americas | 5.48 |
| 🇧🇫 Burkina Faso | Africa | 5.41 |
| 🇬🇧 United Kingdom | Europe | 5.37 |
| 🇹🇩 Chad | Africa | 5.34 |
| 🇦🇷 Argentina | Americas | 5.29 |
| 🇹🇭 Thailand | Asia | 5.19 |
| 🇿🇲 Zambia | Africa | 5.03 |
| 🇲🇦 Morocco | Africa | 4.70 |
| 🇲🇼 Malawi | Africa | 4.27 |
| 🇧🇯 Benin | Africa | 4.16 |
| 🇸🇳 Senegal | Africa | 4.15 |
| 🇵🇪 Peru | Americas | 4.08 |
| 🇳🇵 Nepal | Asia | 3.95 |
| 🇻🇪 Venezuela | Americas | 3.78 |
| 🇸🇦 Saudi Arabia | Asia | 3.69 |
| 🇿🇼 Zimbabwe | Africa | 3.67 |
| 🇲🇾 Malaysia | Asia | 3.62 |
| 🇸🇾 Syria | Asia | 3.60 |
| 🇺🇿 Uzbekistan | Asia | 3.55 |
| 🇬🇳 Guinea | Africa | 3.47 |
| 🇸🇴 Somalia | Africa | 3.45 |
| 🇧🇮 Burundi | Africa | 3.28 |
| 🇸🇸 South Sudan | Africa | 3.19 |
| 🇮🇹 Italy | Europe | 3.12 |
| 🇬🇹 Guatemala | Americas | 2.90 |
| 🇺🇦 Ukraine | Europe | 2.88 |
| 🇨🇦 Canada | Americas | 2.85 |
| 🇰🇵 Korea, North | Asia | 2.71 |
| 🇰🇷 Korea, South | Asia | 2.63 |
| 🇷🇼 Rwanda | Africa | 2.56 |
| 🇪🇸 Spain | Europe | 2.47 |
| 🇵🇱 Poland | Europe | 2.38 |
| 🇰🇭 Cambodia | Asia | 2.37 |
| 🇦🇺 Australia | Oceania | 2.36 |
| 🇱🇰 Sri Lanka | Asia | 2.35 |
| 🇰🇿 Kazakhstan | Asia | 2.19 |
| 🇪🇨 Ecuador | Americas | 2.09 |
| 🇸🇱 Sierra Leone | Africa | 2.06 |
| 🇵🇬 Papua New Guinea | Oceania | 2.04 |
| 🇹🇬 Togo | Africa | 1.99 |
| 🇯🇴 Jordan | Asia | 1.82 |
| 🇭🇹 Haiti | Americas | 1.76 |
| 🇨🇱 Chile | Americas | 1.73 |
| 🇧🇴 Bolivia | Americas | 1.65 |
| 🇱🇷 Liberia | Africa | 1.44 |
| 🇩🇴 Dominican Republic | Americas | 1.42 |
| 🇳🇱 Netherlands | Europe | 1.40 |
| 🇹🇯 Tajikistan | Asia | 1.39 |
| 🇨🇫 Central African Republic | Africa | 1.31 |
| 🇨🇬 Congo, Republic of the | Africa | 1.30 |
| 🇹🇼 Taiwan | Asia | 1.28 |
| 🇹🇳 Tunisia | Africa | 1.28 |
| 🇭🇳 Honduras | Americas | 1.24 |
| 🇪🇷 Eritrea | Africa | 1.23 |
| 🇷🇴 Romania | Europe | 1.19 |
| 🇱🇦 Laos | Asia | 1.19 |
| 🇮🇱 Israel | Asia | 1.14 |
| 🇱🇾 Libya | Africa | 1.13 |
| 🇦🇿 Azerbaijan | Asia | 1.03 |
| 🇧🇪 Belgium | Europe | 0.95 |
| 🇵🇾 Paraguay | Americas | 0.88 |
| 🇰🇬 Kyrgyzstan | Asia | 0.87 |
| 🇸🇻 El Salvador | Americas | 0.86 |
| 🇲🇷 Mauritania | Africa | 0.86 |
| 🇸🇪 Sweden | Europe | 0.83 |
| 🇨🇺 Cuba | Americas | 0.82 |
| 🇦🇪 United Arab Emirates | Asia | 0.79 |
| 🇳🇮 Nicaragua | Americas | 0.76 |
| 🇹🇲 Turkmenistan | Asia | 0.72 |
| 🇨🇿 Czechia | Europe | 0.68 |
| 🇨🇭 Switzerland | Europe | 0.65 |
| 🇧🇾 Belarus | Europe | 0.63 |
| 🇦🇹 Austria | Europe | 0.62 |
| 🇭🇺 Hungary | Europe | 0.62 |
| 🇴🇲 Oman | Asia | 0.61 |
| 🇵🇹 Portugal | Europe | 0.60 |
| 🇬🇷 Greece | Europe | 0.59 |
| 🇵🇦 Panama | Americas | 0.57 |
| 🇨🇷 Costa Rica | Americas | 0.55 |
| 🇬🇼 Guinea-Bissau | Africa | 0.54 |
| 🇵🇸 West Bank | Asia | 0.54 |
| 🇬🇲 Gambia | Africa | 0.51 |
| 🇱🇧 Lebanon | Asia | 0.51 |
| 🇳🇦 Namibia | Africa | 0.50 |
| 🇳🇴 Norway | Europe | 0.49 |
| 🇩🇰 Denmark | Europe | 0.49 |
| 🇮🇪 Ireland | Europe | 0.48 |
| 🇳🇿 New Zealand | Oceania | 0.47 |
| 🇬🇦 Gabon | Africa | 0.45 |
| 🇷🇸 Serbia | Europe | 0.44 |
| 🇭🇰 Hong Kong | Asia | 0.43 |
| 🇫🇮 Finland | Europe | 0.43 |
| 🇧🇬 Bulgaria | Europe | 0.41 |
| 🇵🇸 Gaza Strip | Asia | 0.41 |
| 🇰🇼 Kuwait | Asia | 0.40 |
| 🇬🇪 Georgia | Asia | 0.40 |
| 🇸🇬 Singapore | Asia | 0.39 |
| 🇲🇳 Mongolia | Asia | 0.38 |
| 🇱🇸 Lesotho | Africa | 0.37 |
| 🇬🇶 Equatorial Guinea | Africa | 0.37 |
| 🇸🇰 Slovakia | Europe | 0.36 |
| 🇧🇼 Botswana | Africa | 0.36 |
| 🇯🇲 Jamaica | Americas | 0.33 |
| 🇹🇱 Timor-Leste | Asia | 0.33 |
| 🇺🇾 Uruguay | Americas | 0.32 |
| 🇦🇱 Albania | Europe | 0.29 |
| 🇭🇷 Croatia | Europe | 0.27 |
| 🇲🇩 Moldova | Europe | 0.25 |
| 🇦🇲 Armenia | Asia | 0.24 |
| 🇧🇦 Bosnia and Herzegovina | Europe | 0.24 |
| 🇽🇰 Kosovo | Europe | 0.21 |
| 🇸🇿 Eswatini | Africa | 0.19 |
| 🇱🇹 Lithuania | Europe | 0.18 |
| 🇵🇷 Puerto Rico | Americas | 0.18 |
| 🇶🇦 Qatar | Asia | 0.17 |
| 🇲🇰 North Macedonia | Europe | 0.16 |
| 🇩🇯 Djibouti | Africa | 0.16 |
| 🇰🇲 Comoros | Africa | 0.14 |
| 🇧🇭 Bahrain | Asia | 0.14 |
| 🇸🇮 Slovenia | Europe | 0.13 |
| 🇱🇻 Latvia | Europe | 0.12 |
| 🇸🇧 Solomon Islands | Oceania | 0.12 |
| 🇫🇯 Fiji | Oceania | 0.11 |
| 🇹🇹 Trinidad and Tobago | Americas | 0.11 |
| 🇧🇹 Bhutan | Asia | 0.10 |
| 🇨🇾 Cyprus | Asia | 0.10 |
| 🇬🇾 Guyana | Americas | 0.10 |
| 🇲🇺 Mauritius | Africa | 0.09 |
| 🇨🇻 Cabo Verde | Africa | 0.08 |
| 🇪🇪 Estonia | Europe | 0.08 |
| 🇸🇷 Suriname | Americas | 0.07 |
| 🇧🇿 Belize | Americas | 0.06 |
| 🇧🇳 Brunei | Asia | 0.06 |
| 🇱🇺 Luxembourg | Europe | 0.06 |
| 🇲🇪 Montenegro | Europe | 0.05 |
| 🇻🇺 Vanuatu | Oceania | 0.05 |
| 🇸🇹 Sao Tome and Principe | Africa | 0.04 |
| 🇲🇻 Maldives | Asia | 0.04 |
| 🇲🇴 Macau | Asia | 0.04 |
| 🇧🇸 Bahamas, The | Americas | 0.04 |
| 🇮🇸 Iceland | Europe | 0.03 |
| 🇲🇹 Malta | Europe | 0.03 |
| 🇳🇨 New Caledonia | Oceania | 0.03 |
| 🇵🇫 French Polynesia | Oceania | 0.03 |
| 🇼🇸 Samoa | Oceania | 0.03 |
| 🇧🇧 Barbados | Americas | 0.02 |
| 🇬🇺 Guam | Oceania | 0.02 |
| 🇰🇮 Kiribati | Oceania | 0.02 |
| 🇹🇴 Tonga | Oceania | 0.02 |
| 🇨🇼 Curacao | Americas | 0.01 |
| 🇱🇨 Saint Lucia | Americas | 0.01 |
| 🇫🇲 Micronesia, Federated States of | Oceania | 0.01 |
| 🇲🇭 Marshall Islands | Oceania | 0.01 |
| 🇬🇩 Grenada | Americas | 0.01 |
| 🇦🇬 Antigua and Barbuda | Americas | 0.01 |
| 🇦🇼 Aruba | Americas | 0.01 |
| 🇯🇪 Jersey | Europe | 0.01 |
| 🇻🇨 Saint Vincent and the Grenadines | Americas | 0.01 |
| 🇻🇮 Virgin Islands | Americas | 0.01 |
| 🇸🇨 Seychelles | Africa | 0.01 |
| 🇩🇲 Dominica | Americas | 0.01 |
| 🇮🇲 Isle of Man | Europe | 0.01 |
| 🇧🇲 Bermuda | Americas | 0.01 |
| 🇲🇵 Northern Mariana Islands | Oceania | 0.01 |
| 🇬🇱 Greenland | Americas | 0.01 |
| 🇹🇨 Turks and Caicos Islands | Americas | 0.01 |
| 🇫🇴 Faroe Islands | Europe | 0.01 |
| 🇦🇸 American Samoa | Oceania | 0.01 |
| 🇰🇾 Cayman Islands | Americas | 0.01 |
| 🇰🇳 Saint Kitts and Nevis | Americas | 0.00 |
| 🇬🇬 Guernsey | Europe | 0.00 |
| 🇦🇩 Andorra | Europe | 0.00 |
| 🇸🇽 Sint Maarten | Americas | 0.00 |
| 🇲🇫 Saint Martin | Americas | 0.00 |
| 🇻🇬 British Virgin Islands | Americas | 0.00 |
| 🇬🇮 Gibraltar | Europe | 0.00 |
| 🇱🇮 Liechtenstein | Europe | 0.00 |
| 🇸🇲 San Marino | Europe | 0.00 |
| 🇹🇻 Tuvalu | Oceania | 0.00 |
| 🇵🇼 Palau | Oceania | 0.00 |
| 🇦🇮 Anguilla | Americas | 0.00 |
| 🇲🇨 Monaco | Europe | 0.00 |
| 🇳🇷 Nauru | Oceania | 0.00 |
| 🇼🇫 Wallis and Futuna | Oceania | 0.00 |
| 🇨🇰 Cook Islands | Oceania | 0.00 |
| 🇸🇭 Saint Helena, Ascension, and Tristan da Cunha | Africa | 0.00 |
| 🇧🇱 Saint Barthelemy | Americas | 0.00 |
| 🇲🇸 Montserrat | Americas | 0.00 |
| 🇫🇰 Falkland Islands (Islas Malvinas) | Americas | 0.00 |
| 🇵🇲 Saint Pierre and Miquelon | Americas | 0.00 |
It’s worth noting that, while India ranks number one on the list, the country’s birth rate (which is its total number of births in a year per 1,000 individuals) is actually slightly below the global average, at 16.8 compared to 17.7 respectively.
China, which comes second on the list, is similar to India, with a high population but relatively low birth rate as well. On the other hand, Nigeria, which ranks third on the list, has a birth rate that’s nearly double the global average, at 34.2.
Why is Nigeria’s birth rate so high?
There are various intermingling factors at play, but one key reason is the fact that Nigeria’s economy still is developing, and ranks 131st globally in terms of GDP per capita. Further, access to education for women is still not as widespread as it could be, and research shows that this is strongly correlated with higher birth rates.
The World’s Population Growth Rate is Declining
While there are hundreds of thousands of babies born around the world each day, it’s worth mentioning that the world’s overall population growth rate has actually been declining since the 1960s.
This is happening for a number of reasons, including:
- Increased wealth around the world, which research has correlated with fewer births
- Various government policies discouraging large families
- The global shift from rural to urban living
By 2100, global population growth is expected to drop to 0.1%, which means we’ll essentially reach net-zero population growth.
This would increase our global median age even further, which poses a number of economic risks if countries don’t properly prepare for this demographic shift.

This article was published as a part of Visual Capitalist's Creator Program, which features data-driven visuals from some of our favorite Creators around the world.


Demographics
The Countries That Have Become Sadder Since 2010
Tracking Gallup survey data for more than a decade reveals some countries are witnessing big happiness declines, reflecting their shifting socio-economic conditions.


The Countries That Have Become Sadder Since 2010
This was originally posted on our Voronoi app. Download the app for free on iOS or Android and discover incredible data-driven charts from a variety of trusted sources.
Can happiness be quantified?
Some approaches that try to answer this question make a distinction between two differing components of happiness: a daily experience part, and a more general life evaluation (which includes how people think about their life as a whole).
The World Happiness Report—first launched in 2012—has been making a serious go at quantifying happiness, by examining Gallup poll data that asks respondents in nearly every country to evaluate their life on a 0–10 scale. From this they extrapolate a single “happiness score” out of 10 to compare how happy (or unhappy) countries are.
More than a decade later, the 2024 World Happiness Report continues the mission. Its latest findings also include how some countries have become sadder in the intervening years.
Which Countries Have Become Unhappier Since 2010?
Afghanistan is the unhappiest country in the world right now, and is also 60% unhappier than over a decade ago, indicating how much life has worsened since 2010.
In 2021, the Taliban officially returned to power in Afghanistan, after nearly two decades of American occupation in the country. The Islamic fundamentalist group has made life harder, especially for women, who are restricted from pursuing higher education, travel, and work.
On a broader scale, the Afghan economy has suffered post-Taliban takeover, with various consequent effects: mass unemployment, a drop in income, malnutrition, and a crumbling healthcare system.
| Rank | Country | Happiness Score Loss (2010–24) | 2024 Happiness Score (out of 10) |
|---|---|---|---|
| 1 | 🇦🇫 Afghanistan | -2.6 | 1.7 |
| 2 | 🇱🇧 Lebanon | -2.3 | 2.7 |
| 3 | 🇯🇴 Jordan | -1.5 | 4.2 |
| 4 | 🇻🇪 Venezuela | -1.3 | 5.6 |
| 5 | 🇲🇼 Malawi | -1.2 | 3.4 |
| 6 | 🇿🇲 Zambia | -1.2 | 3.5 |
| 7 | 🇧🇼 Botswana | -1.2 | 3.4 |
| 8 | 🇾🇪 Yemen | -1.0 | 3.6 |
| 9 | 🇪🇬 Egypt | -1.0 | 4.0 |
| 10 | 🇮🇳 India | -0.9 | 4.1 |
| 11 | 🇧🇩 Bangladesh | -0.9 | 3.9 |
| 12 | 🇨🇩 DRC | -0.7 | 3.3 |
| 13 | 🇹🇳 Tunisia | -0.7 | 4.4 |
| 14 | 🇨🇦 Canada | -0.6 | 6.9 |
| 15 | 🇺🇸 U.S. | -0.6 | 6.7 |
| 16 | 🇨🇴 Colombia | -0.5 | 5.7 |
| 17 | 🇵🇦 Panama | -0.5 | 6.4 |
| 18 | 🇵🇰 Pakistan | -0.5 | 4.7 |
| 19 | 🇿🇼 Zimbabwe | -0.5 | 3.3 |
| 20 | 🇮🇪 Ireland | -0.5 | 6.8 |
| N/A | 🌍 World | +0.1 | 5.5 |
Nine countries in total saw their happiness score drop by a full point or more, on the 0–10 scale.
Noticeably, many of them have seen years of social and economic upheaval. Lebanon, for example, has been grappling with decades of corruption, and a severe liquidity crisis since 2019 that has resulted in a banking system collapse, sending poverty levels skyrocketing.
In Jordan, unprecedented population growth—from refugees leaving Iraq and Syria—has aggravated unemployment rates. A somewhat abrupt change in the line of succession has also raised concerns about political stability in the country.

-

 Education1 week ago
How Hard Is It to Get Into an Ivy League School?
-

 Technology2 weeks ago
Ranked: Semiconductor Companies by Industry Revenue Share
-

 Markets2 weeks ago
Ranked: The World’s Top Flight Routes, by Revenue
-

 Demographics2 weeks ago
Population Projections: The World’s 6 Largest Countries in 2075
-

 Markets2 weeks ago
The Top 10 States by Real GDP Growth in 2023
-

 Demographics2 weeks ago
The Smallest Gender Wage Gaps in OECD Countries
-

 Economy2 weeks ago
Where U.S. Inflation Hit the Hardest in March 2024
-

 Green2 weeks ago
Top Countries By Forest Growth Since 2001