Misc
Visualizing the Current State of the Global Gender Gap
Article/Editing:
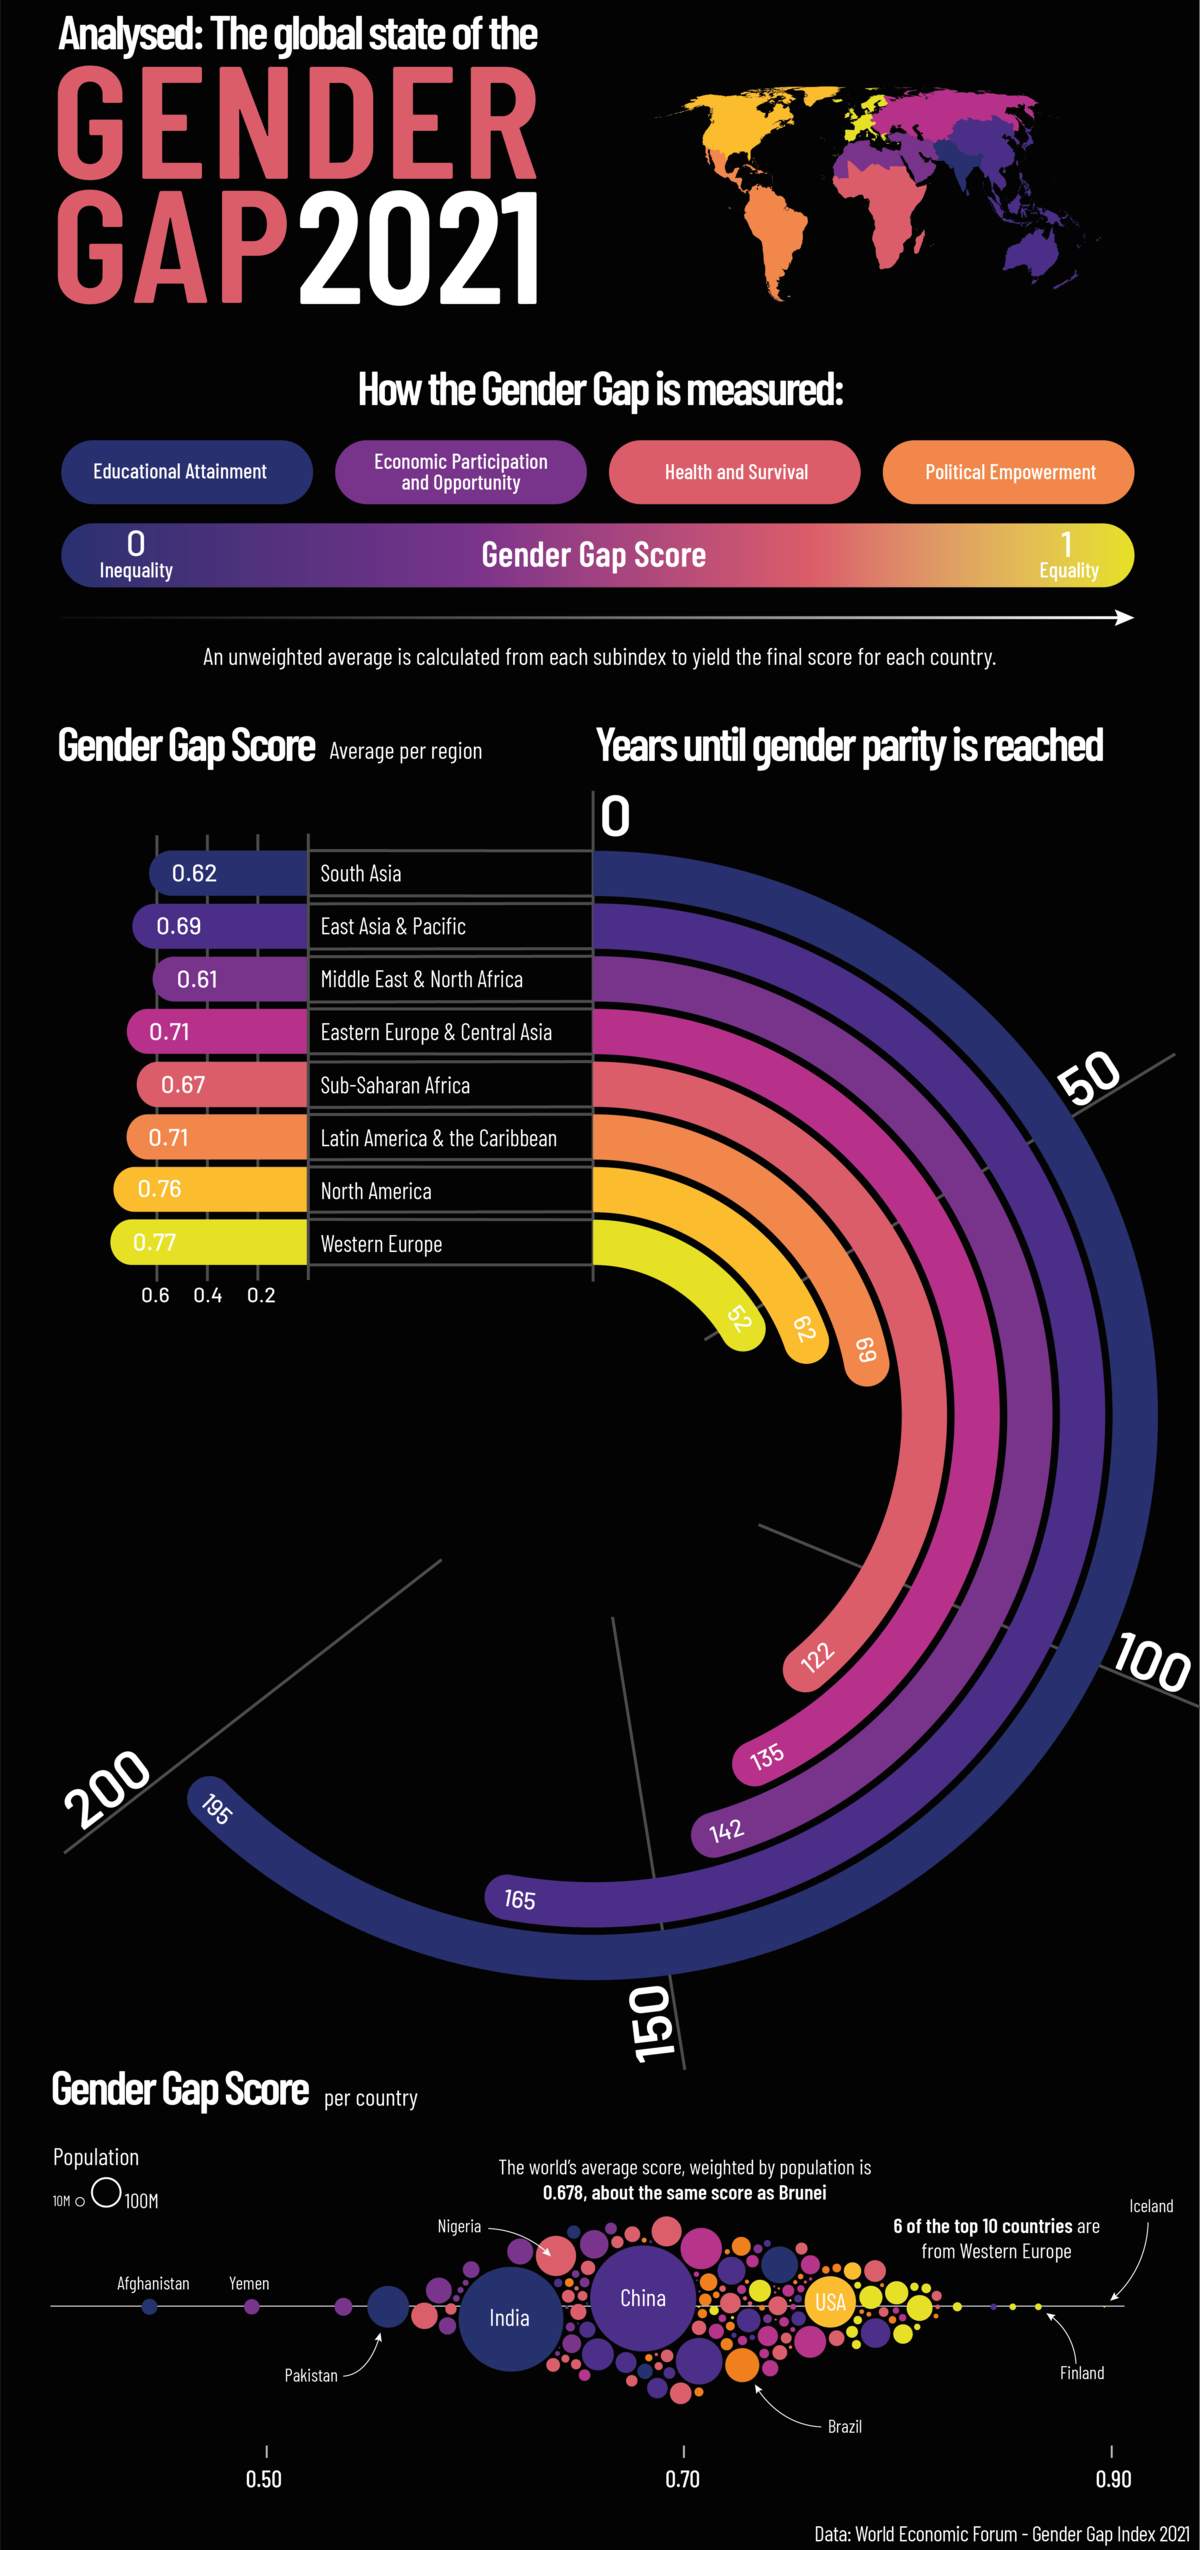
The Current State of the Global Gender Gap
As a global society, we still have a long way to go before we reach gender equality around the world.
According to the World Economic Forum’s (WEF) latest Global Gender Gap Report, it could take up to 135.6 years to close the global gender gap, based on the current rate of change.
This graphic by Sebastian Gräff gives a breakdown of gender equality worldwide, showing how long it will take before each region reaches gender parity.
How Gender Gap is Measured
In its 15th edition, the Global Gender Gap Report analyzes gender-based discrepancies across 156 different countries. To gauge each region’s gender gap, the report digs into four key areas:
- Economic Participation and Opportunity
- Educational Attainment
- Health and Survival
- Political Empowerment
Each subindex is given its own score, then an average across the four pillars is calculated to give each country a final score between zero (exceptionally unequal) and one (completely equal).
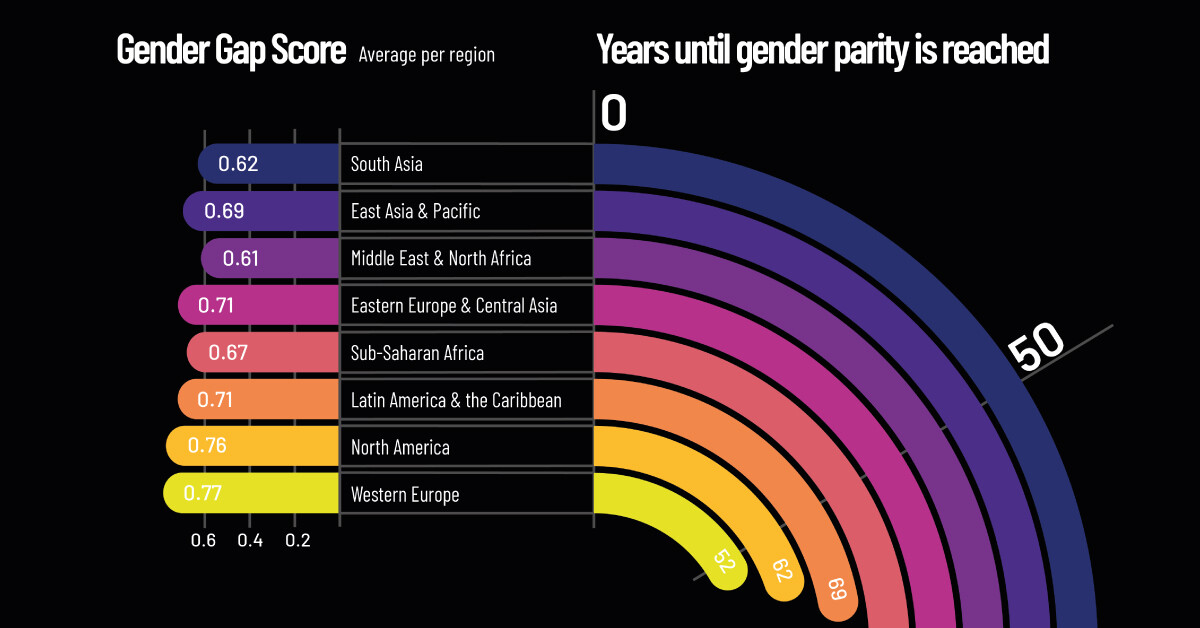
Regional Breakdown
Out of all the regions, Western Europe has the smallest gender gap, with a score of 0.78. At this rate, the gender gap in Western Europe could be closed in approximately 52.1 years, more than 83 years faster than the global estimate.
| Rank | Region | Overall Gender Gap Index (2021) |
|---|---|---|
| 1 | Western Europe | 0.77 |
| 2 | North America | 0.76 |
| 3 | Latin America and the Caribbean | 0.71 |
| 4 | Eastern Europe and Central Asia | 0.71 |
| 5 | East Asia and the Pacific | 0.69 |
| 6 | Sub-Saharan Africa | 0.67 |
| 7 | South Asia | 0.62 |
| 8 | Middle East and North Africa | 0.61 |
| Global Average | 0.69 |
Western Europe scores particularly high in educational attainment (1.0) and health and survival (0.97). Here’s a look at the category breakdown for each region:
| Region | Economic Participation and Opportunity | Educational Attainment | Health and Survival | Political Empowerment |
|---|---|---|---|---|
| Western Europe | 0.70 | 1.00 | 0.97 | 0.44 |
| North America | 0.75 | 1.00 | 0.97 | 0.33 |
| Latin America and the Caribbean | 0.64 | 1.00 | 0.98 | 0.27 |
| Eastern Europe and Central Asia | 0.74 | 1.00 | 0.98 | 0.14 |
| East Asia and the Pacific | 0.70 | 0.98 | 0.95 | 0.14 |
| Sub-Saharan Africa | 0.66 | 0.85 | 0.97 | 0.21 |
| South Asia | 0.34 | 0.93 | 0.94 | 0.28 |
| Middle East and North Africa | 0.41 | 0.94 | 0.97 | 0.12 |
| Global Average | 0.62 | 0.96 | 0.97 | 0.22 |
But it might be surprising to see that political empowerment in Western Europe received a score of only 0.44. This is higher than the global average for political empowerment of 0.21, but still indicative of a large gender gap in this area.
Globally, political empowerment tended to receive the lowest scores in the report, as women are grossly underrepresented in politics. A study by the Council of Foreign Relations revealed that out of 195 different countries’ national cabinets, only 14 countries had at least 50% of their ministerial positions held by women.
Economic participation and opportunity is the second weakest category, with a global average score of 0.58. A good example of how this gap manifests itself is in entrepreneurship and business, where women still struggle to find investors and gain access to venture capital. Further, on average, women continue to make less money than men. According to the UN, women across the globe make approximately 77 cents for every dollar earned by men.
The Economic Benefit of Gender Equality
Research shows that empowering women in the workforce is in everyone’s best interest. Closing the gender gap in the global workforce could lead to a boost of more than $28 trillion to the global economy.
Yet across the globe, COVID-19 has created new challenges that have hindered our progress towards gender equality. This is partly because some of the sectors that have been impacted the most by COVID-19 restrictions, such as hospitality, food services, and personal care, are largely dominated by female workers.
As we continue to recover from the impact of COVID-19, world leaders will face numerous policy challenges, including how to build back better, creating more opportunities for women to thrive in the global economy.

This article was published as a part of Visual Capitalist's Creator Program, which features data-driven visuals from some of our favorite Creators around the world.


Misc
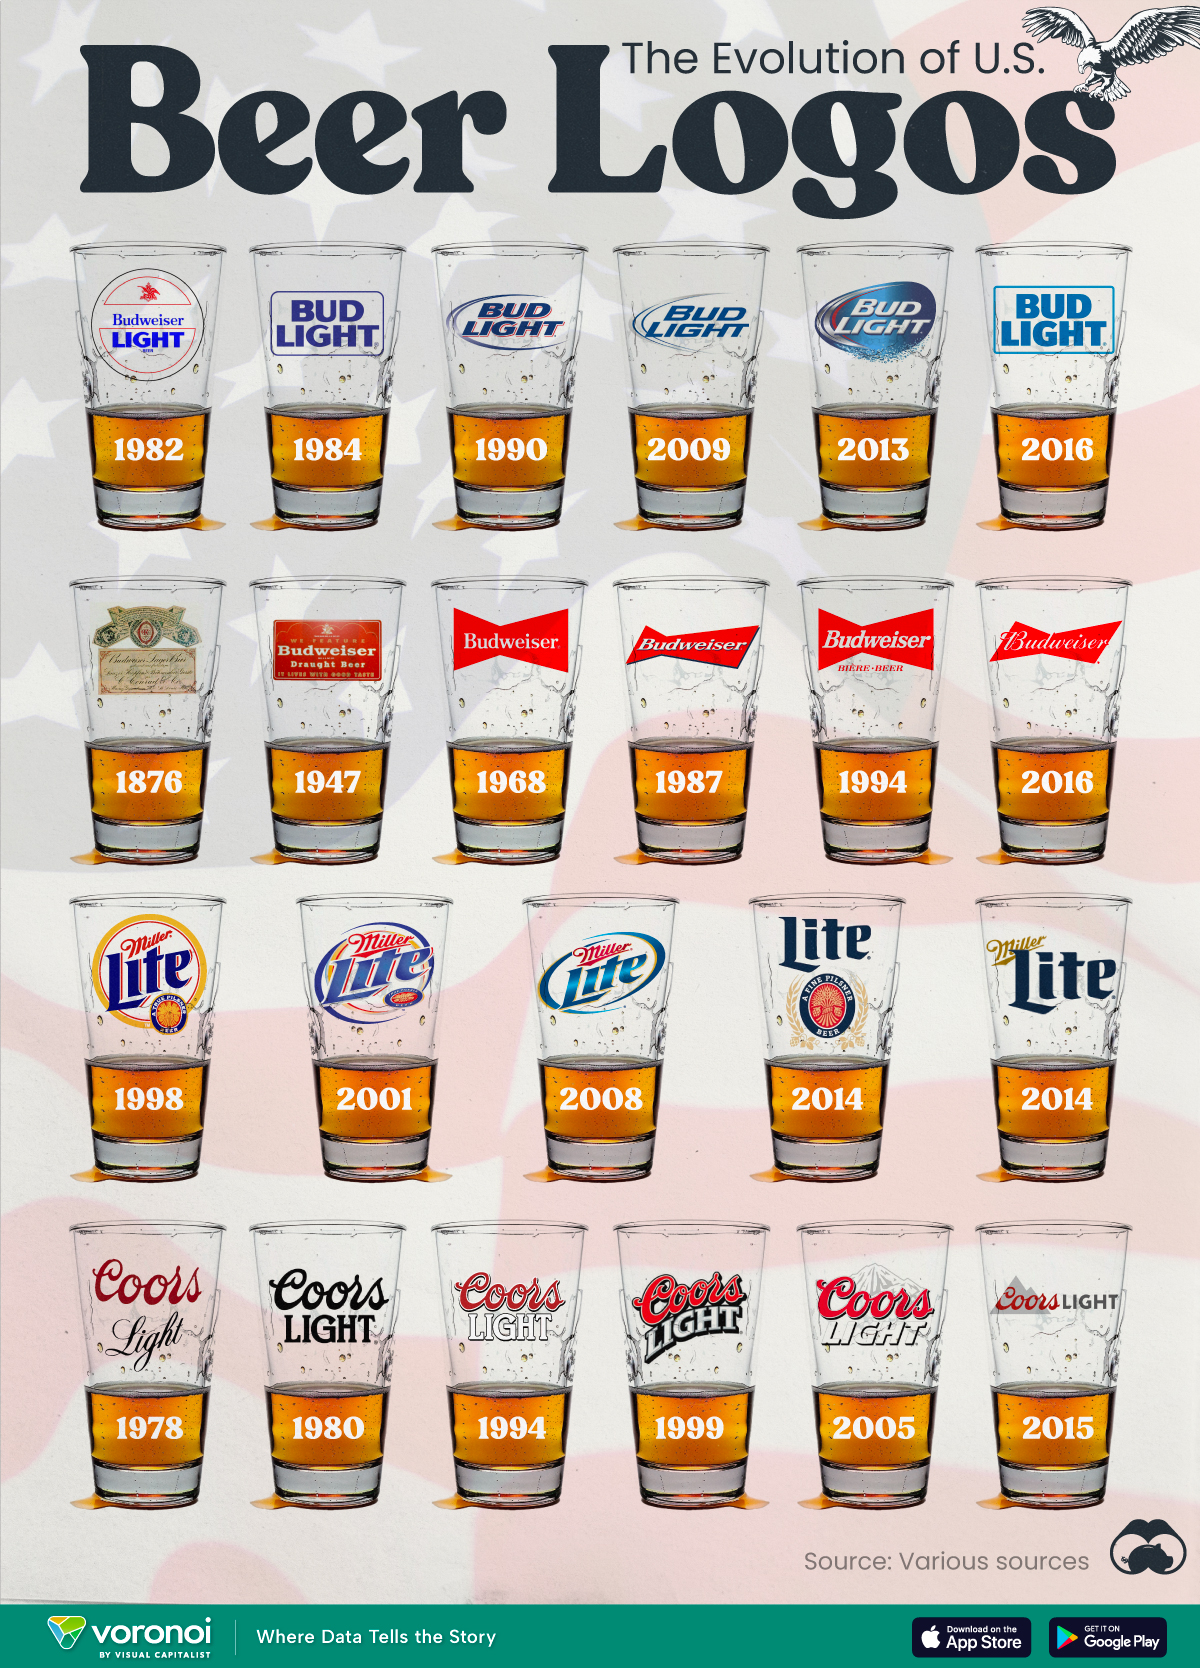
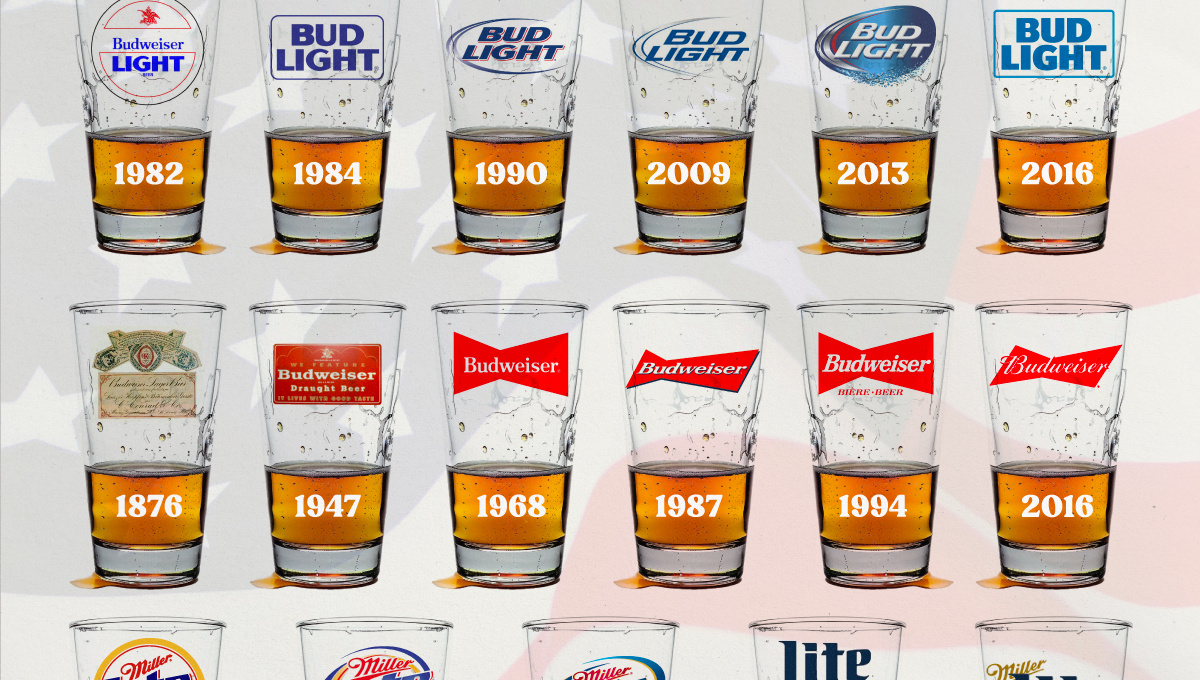
The Evolution of U.S. Beer Logos
In this graphic, we analyze the evolution of popular U.S. beer logos like Budweiser, Coors Light, Bud Light, and more.
The Evolution of U.S. Beer Logos
This was originally posted on our Voronoi app. Download the app for free on iOS or Android and discover incredible data-driven charts from a variety of trusted sources.
Despite selling a popular product, beer companies have to be creative to stand out in a competitive market.
In this graphic, we analyze the evolution of some U.S. beer logos based on various sources. We chose brands based on a mixture of criteria, including popularity (based on YouGov surveys), availability of logo assets, and those with interesting developments.
Bud Light Back to the ’80s
Despite recent backlash and calls for a boycott after sending a commemorative can to transgender influencer Dylan Mulvaney, Bud Light remains one of America’s best-selling beers.
The brand of light beer, owned by the Anheuser-Busch company, has switched from its more circular logo with italic letters adopted in the 1990s back to the Bud Light badge of the 1980s. It is composed of heavy uppercase lettering, written in two levels in a shade of blue with the inscription placed on a solid white background and enclosed in a thin rectangular frame.
Miller Lite Goes Old School
After following a similar approach to Bud Light’s branding throughout the 2000s, Miller Lite decided to undergo a major rebranding in 2014.
The company returned to its 1970s roots, once again combining a white can with its original blue, gold, and red logo. The redesign was largely considered a success, given that Miller Lite sales immediately increased following the change.
A Symbol of American Brewing
The oldest brand on our U.S. beer list, the Budweiser logo, has undergone more than 15 changes over the years.
The design of two connected triangles represents a red bow tie, as a symbol of American brewing.
The colors of the Budweiser logo include a vibrant red, which helps the logo stand out and be easily recognizable from a distance. Studies also suggest that the color red stimulates appetite. Meanwhile, the white inscription symbolizes purity and cleanliness.
Curious to learn more about the beer market? Check out this graphic about global beer consumption.

-

 Money6 days ago
Charted: Which Country Has the Most Billionaires in 2024?
-

 Energy2 weeks ago
Ranked: The Top 10 EV Battery Manufacturers in 2023
-

 Countries2 weeks ago
Countries With the Largest Happiness Gains Since 2010
-

 Economy2 weeks ago
VC+: Get Our Key Takeaways From the IMF’s World Economic Outlook
-

 Demographics2 weeks ago
The Countries That Have Become Sadder Since 2010
-

 Money2 weeks ago
Charted: Who Has Savings in This Economy?
-

 Technology1 week ago
Visualizing AI Patents by Country
-

 Economy1 week ago
Economic Growth Forecasts for G7 and BRICS Countries in 2024