Culture
The History of the FIFA Women’s World Cup
Article/Editing:
Click to view a higher resolution version of this graphic.
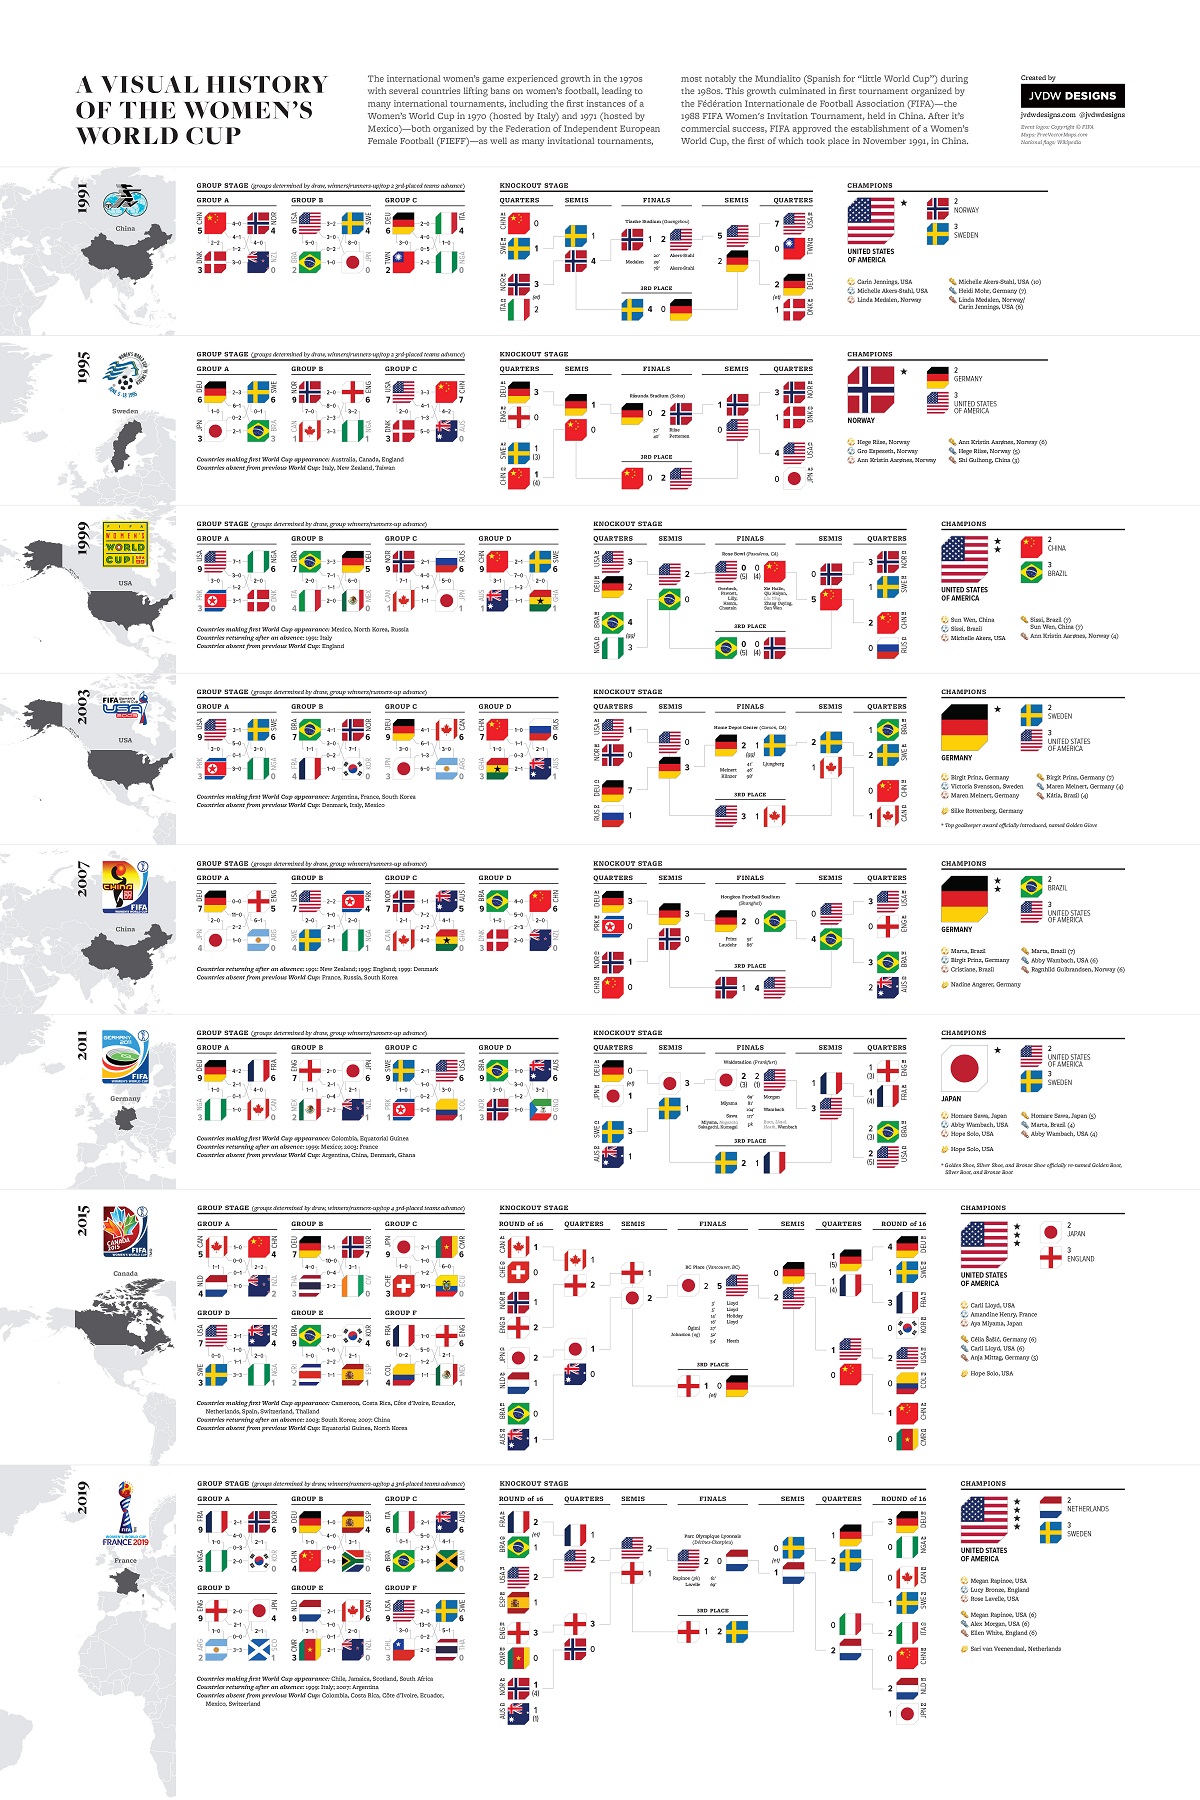
FIFA Women’s World Cup Timeline: 1991‒2019
The ninth edition of the FIFA Women’s World Cup that kicked off this summer in Australia and New Zealand is expected to break records.
For the first time, 32 teams are competing at the premier international event for women’s soccer, up from 24 teams in the two prior editions. And according to FIFA, the tournament is already on pace to become the most attended women’s sports event in history, with over a million tickets already sold.
Eight countries are making their debut in the tournament after qualifying for the first time:
- 🇵🇭 Philippines
- 🇮🇪 Ireland
- 🇿🇲 Zambia
- 🇭🇹 Haiti
- 🇻🇳 Vietnam
- 🇵🇹 Portugal
- 🇵🇦 Panama
- 🇲🇦 Morocco
How has the tournament grown?
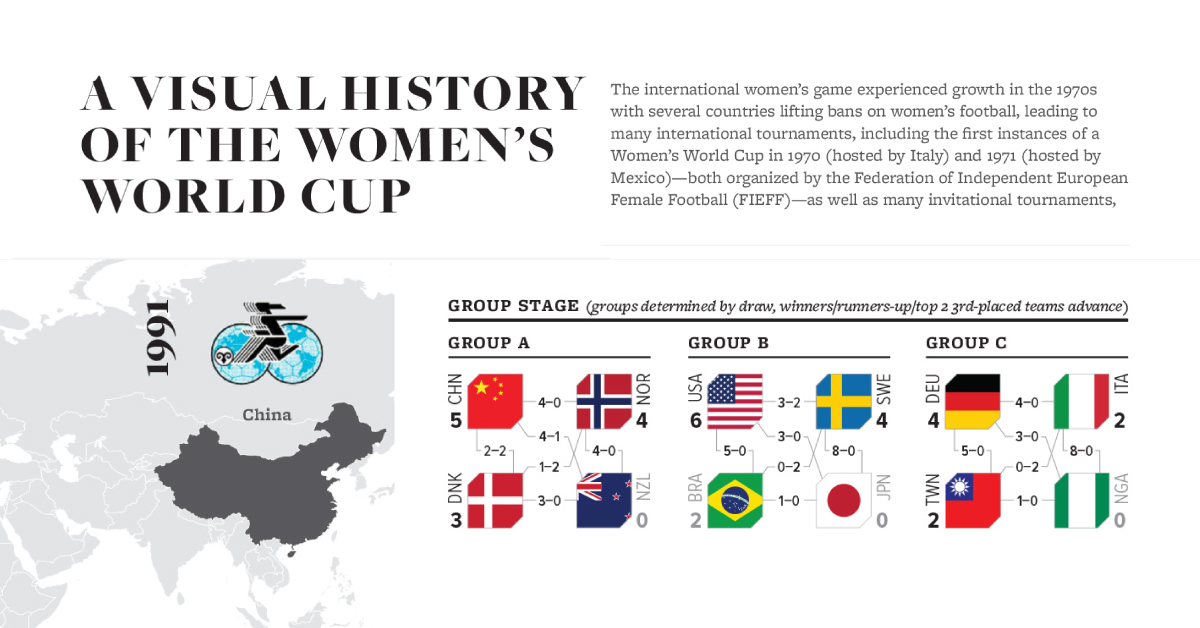
This graphic created by JVDW Designs explores the timeline of this tournament, from its origins with only 12 teams in 1991 to expansions during the 21st century.
The Origins of Women’s Soccer
Though there are reports of women’s soccer matches as early as the 1700s, the sport started to grow in popularity in 1895 thanks to the British Ladies’ Football Club (BLFC), one of the first women’s soccer clubs.
Despite receiving no support from soccer associations in the UK, the club held its inaugural match in London and then went on tour. They received a lot of attention in the press, both due to the sport itself and debates in Victorian England over women’s rights.

After gaining in popularity over the next decades and even drawing bigger crowds than men’s matches, England’s governing soccer association retaliated by banning women’s soccer in 1921. The stated reason was that “the game of football is quite unsuitable for females and ought not to be encouraged.”
Other countries followed suit over time, sidelining women’s soccer from France to Brazil. It wasn’t until the success of the 1966 Men’s World Cup in England, which set records for attendance and was the first to be broadcast to other continents, that England and then other countries in Europe re-established women’s soccer due to increased interest.
The FIFA Women’s World Cup
After multiple international tournaments in the 1970s and 1980s, FIFA finally organized the inaugural FIFA Women’s World Cup in China in 1991.
At the outset, the athletes participating in the Women’s World Cup were not treated as professionals. In her 2019 book, sports journalist Caitlyn Murray details that uniforms were sometimes hand-me-downs from men’s teams, and accommodations during travel were far from luxurious. Notably, the tournament also lacked prize money until 2007.
In total, 35 different national teams have participated in at least one of the eight tournaments held through 2019. Here is the full list, with host countries noted in bold:
| Country | Women's World Cups Attended |
|---|---|
| 🇺🇸 United States | 1991, 1995,1999, 2003, 2007, 2011, 2015, 2019 |
| 🇸🇪 Sweden | 1991, 1995, 1999, 2003, 2007, 2011, 2015, 2019 |
| 🇧🇷 Brazil | 1991, 1995, 1999, 2003, 2007, 2011, 2015, 2019 |
| 🇳🇴 Norway | 1991, 1995, 1999, 2003, 2007, 2011, 2015, 2019 |
| 🇩🇪 Germany | 1991, 1995, 1999, 2003, 2007, 2011, 2015, 2019 |
| 🇯🇵 Japan | 1991, 1995, 1999, 2003, 2007, 2011, 2015, 2019 |
| 🇳🇬 Nigeria | 1991, 1995, 1999, 2003, 2007, 2011, 2015, 2019 |
| 🇨🇳 China | 1991, 1995, 1999, 2003, 2007, 2015, 2019 |
| 🇨🇦 Canada | 1995, 1999, 2003, 2007, 2011, 2015, 2019 |
| 🇦🇺 Australia | 1995, 1999, 2003, 2007, 2011, 2015, 2019 |
| 🇳🇿 New Zealand | 1991, 2007, 2011, 2015, 2019 |
| 🏴 England | 1995, 2007, 2011, 2015, 2019 |
| 🇩🇰 Denmark | 1991, 1995, 1999, 2007 |
| 🇰🇵 North Korea | 1999, 2003, 2007, 2011 |
| 🇫🇷 France | 2003, 2011, 2015, 2019 |
| 🇮🇹 Italy | 1991, 1999, 2019 |
| 🇲🇽 Mexico | 1999, 2011, 2015 |
| 🇦🇷 Argentina | 2003, 2007, 2019 |
| 🇰🇷 South Korea | 2003, 2015, 2019 |
| 🇷🇺 Russia | 1999, 2003 |
| 🇨🇴 Colombia | 2011, 2015 |
| 🇨🇲 Cameroon | 2015, 2019 |
| 🇳🇱 Netherlands | 2015, 2019 |
| 🇪🇸 Spain | 2015, 2019 |
| 🇹🇭 Thailand | 2015, 2019 |
| 🇹🇼 Taiwan | 1991 |
| 🇬🇶 Equatorial Guinea | 2011 |
| 🇨🇷 Costa Rica | 2015 |
| 🇨🇮 Côte d'Ivoire | 2015 |
| 🇪🇨 Ecuador | 2015 |
| 🇨🇭 Switzerland | 2015 |
| 🇨🇱 Chile | 2019 |
| 🇯🇲 Jamaica | 2019 |
| 🏴 Scotland | 2019 |
| 🇿🇦 South Africa | 2019 |
From the onset, the U.S. emerged as dominant forces in the women’s game. They won the inaugural official tournament in 1991 and are one of just seven countries that have qualified for each edition of the Women’s World Cup from 1991 to 2019.
In total, the American side has won four FIFA Women’s World Cups so far. Throughout the tournament’s history, they’ve never finished lower than third place.
| Country | Championships |
|---|---|
| 🇺🇸 United States | 4 |
| 🇩🇪 Germany | 2 |
| 🇳🇴 Norway | 1 |
| 🇯🇵 Japan | 1 |
The all-time leading World Cup goal scorer, however, comes from Brazil. Marta Vieira da Silva, or “Queen Marta,” etched her name in history by scoring an impressive 17 goals across five World Cups for Brazil, surpassing the men’s World Cup goalscoring record of 16 goals.
As the ninth edition unfolds, the tournament’s growth and global appeal continue to soar. With an even brighter future in the cards for women’s soccer, the question remains: who will come out on top in the 2023 Women’s World Cup?

This article was published as a part of Visual Capitalist's Creator Program, which features data-driven visuals from some of our favorite Creators around the world.


Culture
The World’s Top Media Franchises by All-Time Revenue
From Pokémon to Hello Kitty, some media franchises are globally recognizable. How do media franchises compare in terms of all-time revenue?
Global Media Franchises by All-Time Revenue
This was originally posted on our Voronoi app. Download the app for free on iOS or Android and discover incredible data-driven charts from a variety of trusted sources.
From Pikachu to Hello Kitty, some media franchises become so big that their iconic characters are recognizable to nearly everyone in the world. But how exactly do these mega media franchises make their money, and how do they compare in terms of all-time revenue?
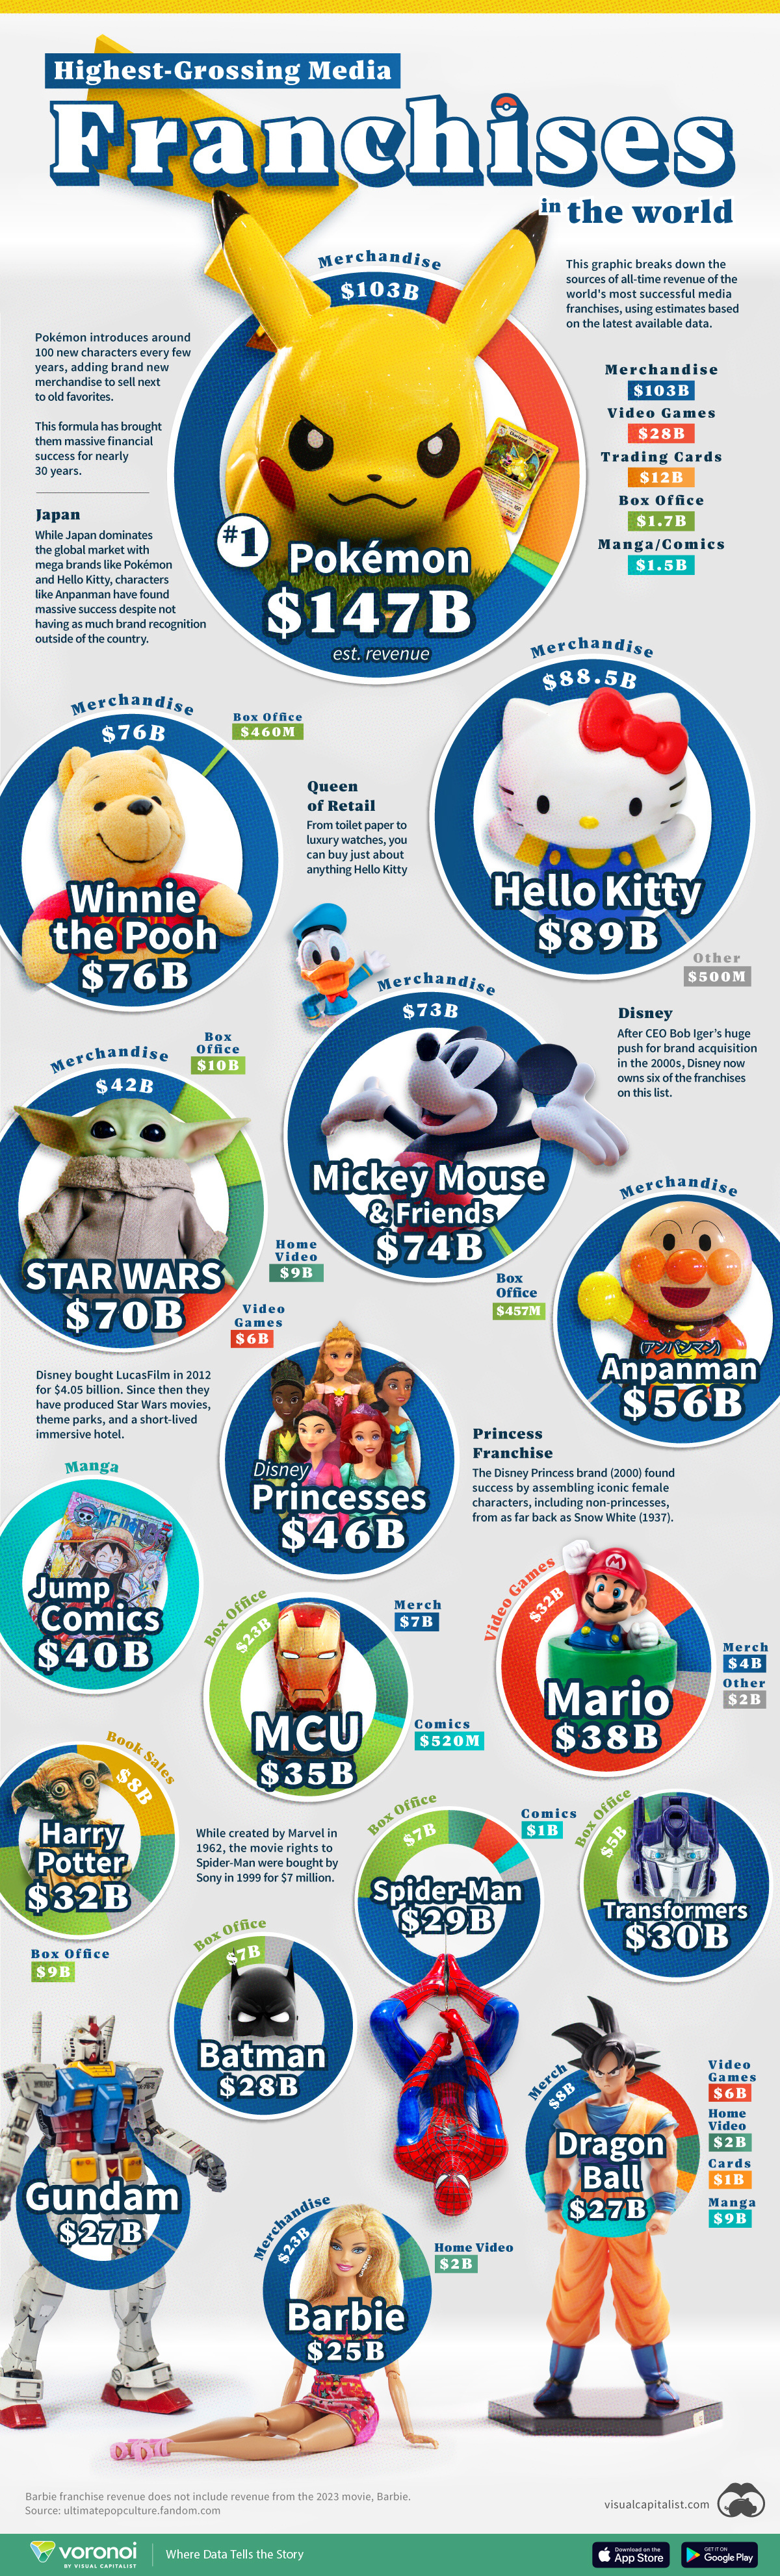
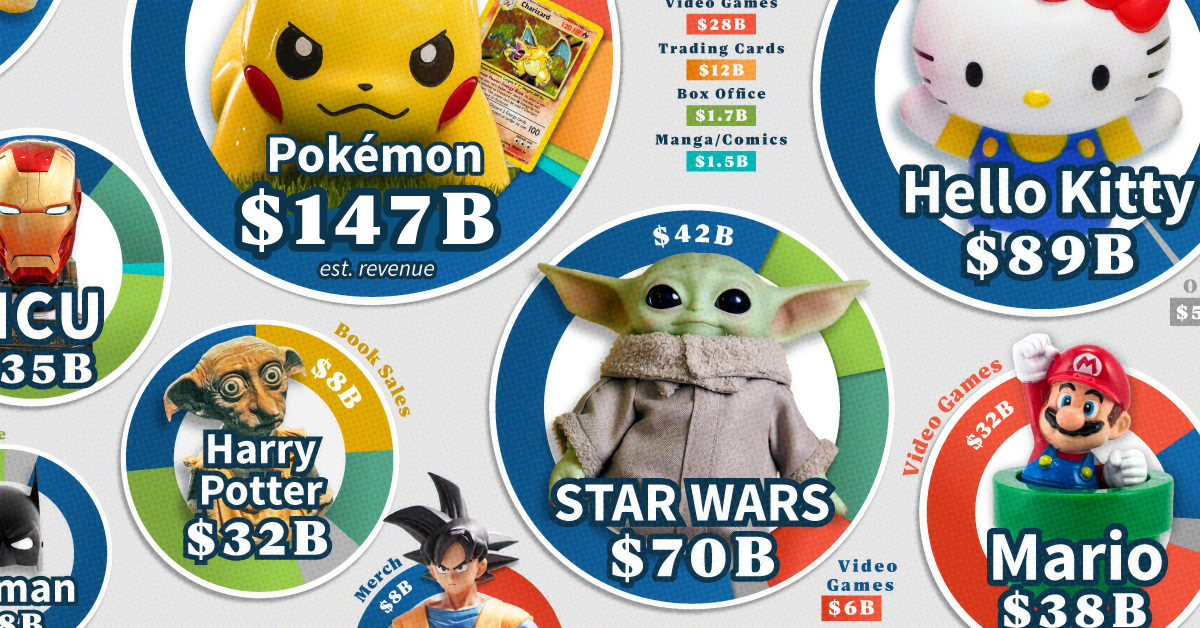
This graphic visualizes and ranks the world’s largest media franchises by their all-time revenue, showing the main revenue sources for each media franchise using data from Fandom.
Japan’s Media Franchises Reign
With more than half of the media franchises in this graphic originating from Japan, the Asian country dominates when it comes to modern popular media franchises.
The country has produced some of the biggest media franchises which span across mediums, whether it’s video games with Pokémon and Mario, or comics, animated series, and toys with franchises like Dragon Ball and Transformers.
| Media Franchise | Total Estimated Revenue | Merchandise Revenue | Video Games Revenue | Trading Cards Revenue | Box Office Revenue | Manga/Comics Revenue | Book Sales Revenue | Home Video Revenue | Other Revenue |
|---|---|---|---|---|---|---|---|---|---|
| Pokémon | $147.0B | $102.9B | $27.6B | $12.1B | $1.8B | $1.5B | - | $0.9B | - |
| Hello Kitty | $89.0B | $88.5B | - | - | - | $0.02B | - | - | - |
| Winnie the Pooh | $76.0B | $76.2B | - | - | $0.5B | - | - | - | - |
| Mickey Mouse & Friends | $74.0B | $73.4B | - | - | $0.5B | $0.0005B | - | - | - |
| Star Wars | $70.0B | $42.2B | $6.0B | - | $10.3B | - | $1.8B | $9.1B | $0.3B |
| Anpanman | $56.0B | $56.4B | - | - | $0.1B | - | - | - | $0.03B |
| Disney Princess | $46.0B | $46.3B | - | - | - | - | - | - | - |
| Jump Comics (Shōnen Jump) | $40.0B | - | $0.2B | - | - | $39.8B | - | - | - |
| Mario | $38.0B | $4.3B | $32.4B | - | $0.0B | $1.6B | - | - | - |
| Marvel Cinematic Universe (MCU) | $35.0B | $12.5B | - | - | $22.6B | $0.001B | - | - | - |
| Harry Potter | $32.0B | $12.3B | $1.6B | - | $9.9B | - | $7.7B | - | $1.1B |
| Transformers | $30.0B | $12.2B | - | - | $4.9B | - | - | - | $0.9B |
| Spider-Man | $29.0B | $15.9B | $1.7B | - | $7.2B | $1.1B | - | $2.2B | $1.4B |
| Batman | $28.0B | $21.3B | - | - | $6.1B | - | - | $1.2B | $0.3B |
| Dragon Ball | $27.0B | $7.7B | $6.2B | $1.0B | $0.8B | $9.2B | - | $2.1B | $0.05B |
| Gundam | $26.9B | $26.4B | - | - | - | $0.2B | - | - | $0.3B |
| Barbie* | $24.7B | $22.7B | - | - | $0.01B | - | - | $2.0B | - |
*Barbie’s revenue does not include revenue from the 2023 movie Barbie.
Even Japanese media franchises which have had less international exposure and revenue, like Anpanman and Jump Comics, have netted tens of billions in revenue mostly from their domestic popularity.
Besides Japan, Disney is the other dominant force when it comes to global media franchises, with all of the 10 largest franchises either hailing from Japan or owned by Disney.
Disney’s Major Media Acquisitions
Over the past two decades, Disney has built up a significant catalog of major media franchises through two key multi-billion dollar acquisitions.
Disney’s acquisitions of Marvel Entertainment for $4.4 billion in 2009 and Lucasfilm for $4.05 billion in 2012 added massive media franchises to their portfolio like Star Wars, the Marvel Cinematic Universe, and Spider-Man.
While Sony bought the movie rights to Spider-Man for just $7 million from Marvel in 1999, Disney owns the rights to Spider-Man in all other forms, including merchandising, television, and comics.
Movies Make their Comeback for Media Franchises
This past decade has seen various popular media franchises take another stab at expanding into the medium of movies and TV shows, this time finding significant success.
Whether it’s animated movies like The Super Mario Bros. Movie or live-action adaptations like Barbie or Netflix’s series of Jump Comics properties like One Piece, these film forays have been successful in revenue terms and in expanding their franchise fanbases.
On top of this, companies like Nintendo are tapping into their franchises to expand beyond movies, with Mario now also the leading mascot for the Super Nintendo World theme park area which has locations at both Universal Studios Japan and Hollywood.

-

 Economy7 days ago
VC+: Get Our Key Takeaways From the IMF’s World Economic Outlook
-

 Maps2 weeks ago
The Largest Earthquakes in the New York Area (1970-2024)
-

 Green2 weeks ago
Ranked: The Countries With the Most Air Pollution in 2023
-

 Green2 weeks ago
Ranking the Top 15 Countries by Carbon Tax Revenue
-

 Markets2 weeks ago
U.S. Debt Interest Payments Reach $1 Trillion
-

 Mining2 weeks ago
Gold vs. S&P 500: Which Has Grown More Over Five Years?
-

 Energy2 weeks ago
The World’s Biggest Nuclear Energy Producers
-

 Misc2 weeks ago
How Hard Is It to Get Into an Ivy League School?