Markets
Survey Results: Will Global Stock Markets Crash in 2023?
Article/Editing:
Survey Results: Will Global Stock Markets Crash in 2023?
For the upcoming year, expert predictions have ranged from extreme optimism to not-so-subtle nervousness, especially when it comes to gauging the health of the global economy.
This chart from Gilbert Fontana skips past expert predictions, and looks directly at those of citizens in multiple countries around the world.
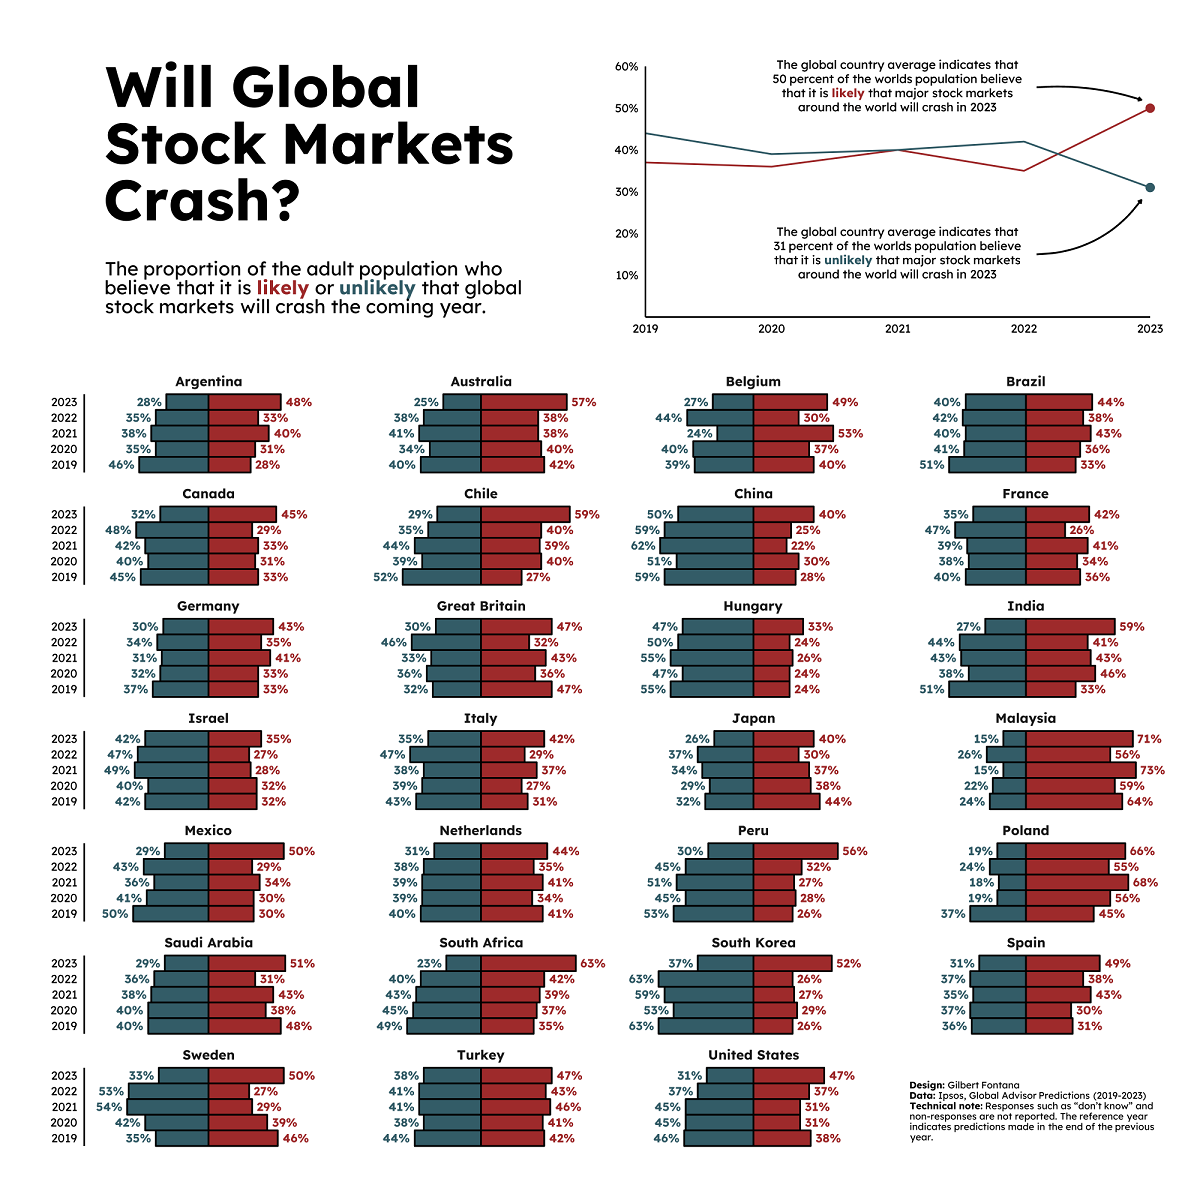
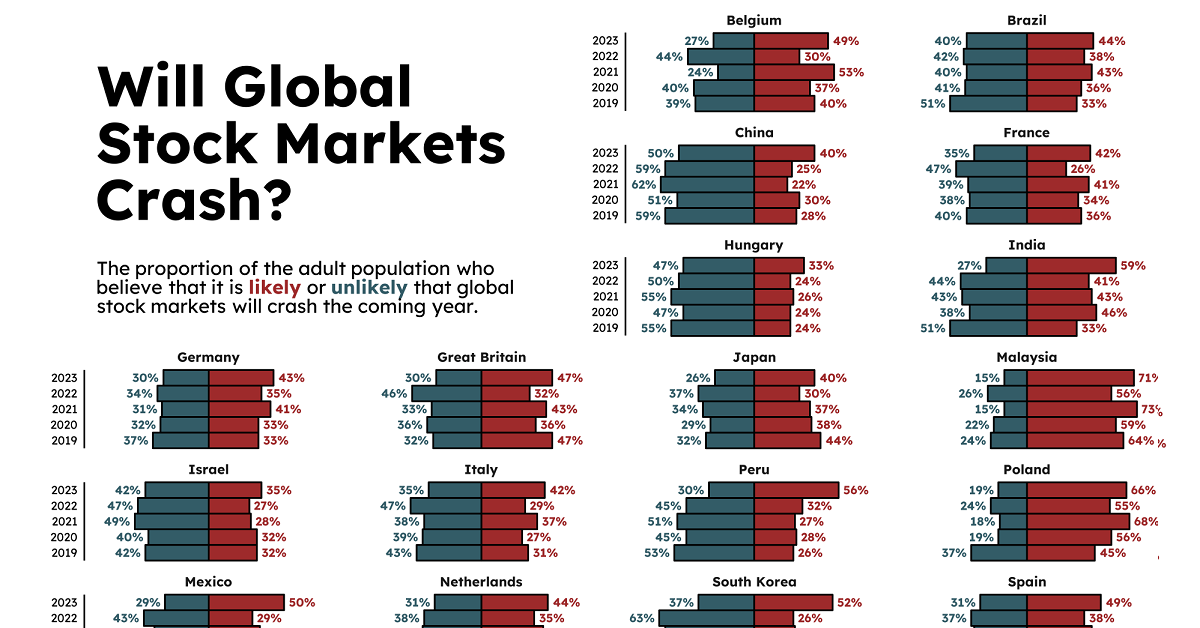
Using data from the Ipsos Global Advisor Predictions surveys from 2019‒2023, the chart plots the percentage of average citizens that think global stock markets will crash in the upcoming year.
Methodology
The annual reports used to generate the charts draw from a 36-country survey of more than 24,000 adults. Each country shown had at least 500 individuals sampled, with countries in the G7 and other major economies including China, Brazil, and South Korea having approximately 1,000 individuals sampled.
Specifically, respondents were asked a question on whether “major stock markets around the world will crash” in the following year, and were asked to respond either “likely” or “unlikely”.
Responses were collected at the end of the previous year in question. For example, for 2023, survey data was collected in October and November 2022. Responses of uncertainty or non-answers weren’t included in the chart above.
And across the board, each country’s data was also weighted to accurately reflect its demographic profile according to recent census data.
Stock Markets Crash Predictions By Country
When looking forward to 2023, most of the respondents from around the world felt that the likelihood of global stock markets crashing was more likely than unlikely.
| Market Crash Predictions by Country | Likely (2023) | Unlikely (2023) |
|---|---|---|
| 🇦🇷 Argentina | 48% | 28% |
| 🇦🇺 Australia | 57% | 25% |
| 🇧🇪 Belgium | 49% | 27% |
| 🇧🇷 Brazil | 44% | 40% |
| 🇨🇦 Canada | 45% | 32% |
| 🇨🇱 Chile | 59% | 29% |
| 🇨🇳 China | 40% | 50% |
| 🇫🇷 France | 42% | 35% |
| 🇩🇪 Germany | 43% | 30% |
| 🇬🇧 Great Britain (United Kingdom) | 47% | 30% |
| 🇭🇺 Hungary | 33% | 47% |
| 🇮🇳 India | 59% | 27% |
| 🇮🇱 Israel | 35% | 42% |
| 🇮🇹 Italy | 42% | 35% |
| 🇯🇵 Japan | 40% | 26% |
| 🇲🇾 Malaysia | 71% | 15% |
| 🇲🇽 Mexico | 50% | 29% |
| 🇳🇱 Netherlands | 44% | 31% |
| 🇵🇪 Peru | 56% | 30% |
| 🇵🇱 Poland | 66% | 19% |
| 🇸🇦 Saudi Arabia | 51% | 29% |
| 🇿🇦 South Africa | 63% | 23% |
| 🇰🇷 South Korea | 52% | 37% |
| 🇪🇸 Spain | 49% | 31% |
| 🇸🇪 Sweden | 50% | 33% |
| 🇹🇷 Turkey | 47% | 38% |
| 🇺🇸 United States | 47% | 31% |
| 🌎 Global Average | 50% | 31% |
In 24 of the 27 countries sampled, citizens thought it was more likely than not that global stock markets would crash in 2023. This includes the entire G7, with 40–47% of each member’s citizens responding “likely” compared to 26–35% responding “unlikely.”
The most pessimistic responses came from Malaysia, Poland, and South Africa, where more than 60% of respondents thought it was likely that markets would crash in 2023. Malaysian citizens led the way with 71% viewing a 2023 crash as likely.
The only three countries where citizens believed a 2023 stock market crash was less likely were China, Israel, and Hungary. China had the highest “unlikely” response rate at 50%, while in Hungary, just 33% of respondents responded “likely” compared to 47% responding unlikely.
Changing Stock Market Sentiments
When comparing 2023 responses to those from 2019, we can see that the last five years have brought uncertainty and pessimism to most countries:
| Change in Market Crash Predictions | % Likely Change (2019-2023) | % Unlikely Change (2019-2023) |
|---|---|---|
| 🇦🇷 Argentina | +20 pp | -18 pp |
| 🇦🇺 Australia | +15 pp | -15 pp |
| 🇧🇪 Belgium | +09 pp | -12 pp |
| 🇧🇷 Brazil | +11 pp | -11 pp |
| 🇨🇦 Canada | +12 pp | -13 pp |
| 🇨🇱 Chile | +32 pp | -23 pp |
| 🇨🇳 China | +12 pp | -09 pp |
| 🇫🇷 France | +06 pp | -05 pp |
| 🇩🇪 Germany | +10 pp | -07 pp |
| 🇬🇧 Great Britain (United Kingdom) | 0 pp | -02 pp |
| 🇭🇺 Hungary | +09 pp | -08 pp |
| 🇮🇳 India | +26 pp | -24 pp |
| 🇮🇱 Israel | +03 pp | 0 pp |
| 🇮🇹 Italy | +11 pp | -08 pp |
| 🇯🇵 Japan | -04 pp | -06 pp |
| 🇲🇾 Malaysia | +07 pp | -09 pp |
| 🇲🇽 Mexico | +20 pp | -21 pp |
| 🇳🇱 Netherlands | +03 pp | -09 pp |
| 🇵🇪 Peru | +30 pp | -23 pp |
| 🇵🇱 Poland | +21 pp | -18 pp |
| 🇸🇦 Saudi Arabia | +03 pp | -11 pp |
| 🇿🇦 South Africa | +28 pp | -26 pp |
| 🇰🇷 South Korea | +26 pp | -26 pp |
| 🇪🇸 Spain | +18 pp | -05 pp |
| 🇸🇪 Sweden | +04 pp | -02 pp |
| 🇹🇷 Turkey | +05 pp | -06 pp |
| 🇺🇸 United States | +09 pp | -15 pp |
| 🌎 Global Average | +13 pp | -13 pp |
Responses of global stock markets likely crashing rose in 25 of the 27 countries, with 8 countries increasing by more than 20 percentage points (pp). Notably, neighbors Chile and Peru had the highest increases at 32 pp and 30 pp respectively.
But neighboring sentiments didn’t track worldwide. For example, while South Korea had one of the biggest increases in “likely” responses towards stock markets crashing at 26 pp, Japan was the only country that responded in a lower likelihood by 4 pp.
While global sentiment is becoming increasingly pessimistic, we can also see that previous year’s predictions didn’t always pan out. So the question remains, what will 2023 really bring?

This article was published as a part of Visual Capitalist's Creator Program, which features data-driven visuals from some of our favorite Creators around the world.


Markets
Visualized: Interest Rate Forecasts for Advanced Economies
In this graphic, we show the IMF’s interest rate forecast for the U.S., Europe, the UK, and Japan for the next five years ahead.
Interest Rate Projections for Advanced Economies
While U.S. inflation cooled in the second half of last year, price pressures returned in 2024, leading investors to rethink how soon central bankers will cut rates.
Despite the recent increase, the interest rate forecast for many economies looks optimistic, thanks to subdued energy price shocks and abating supply chain disruptions. Still, short-term risks remain, including persistently high services inflation clouding the outlook.
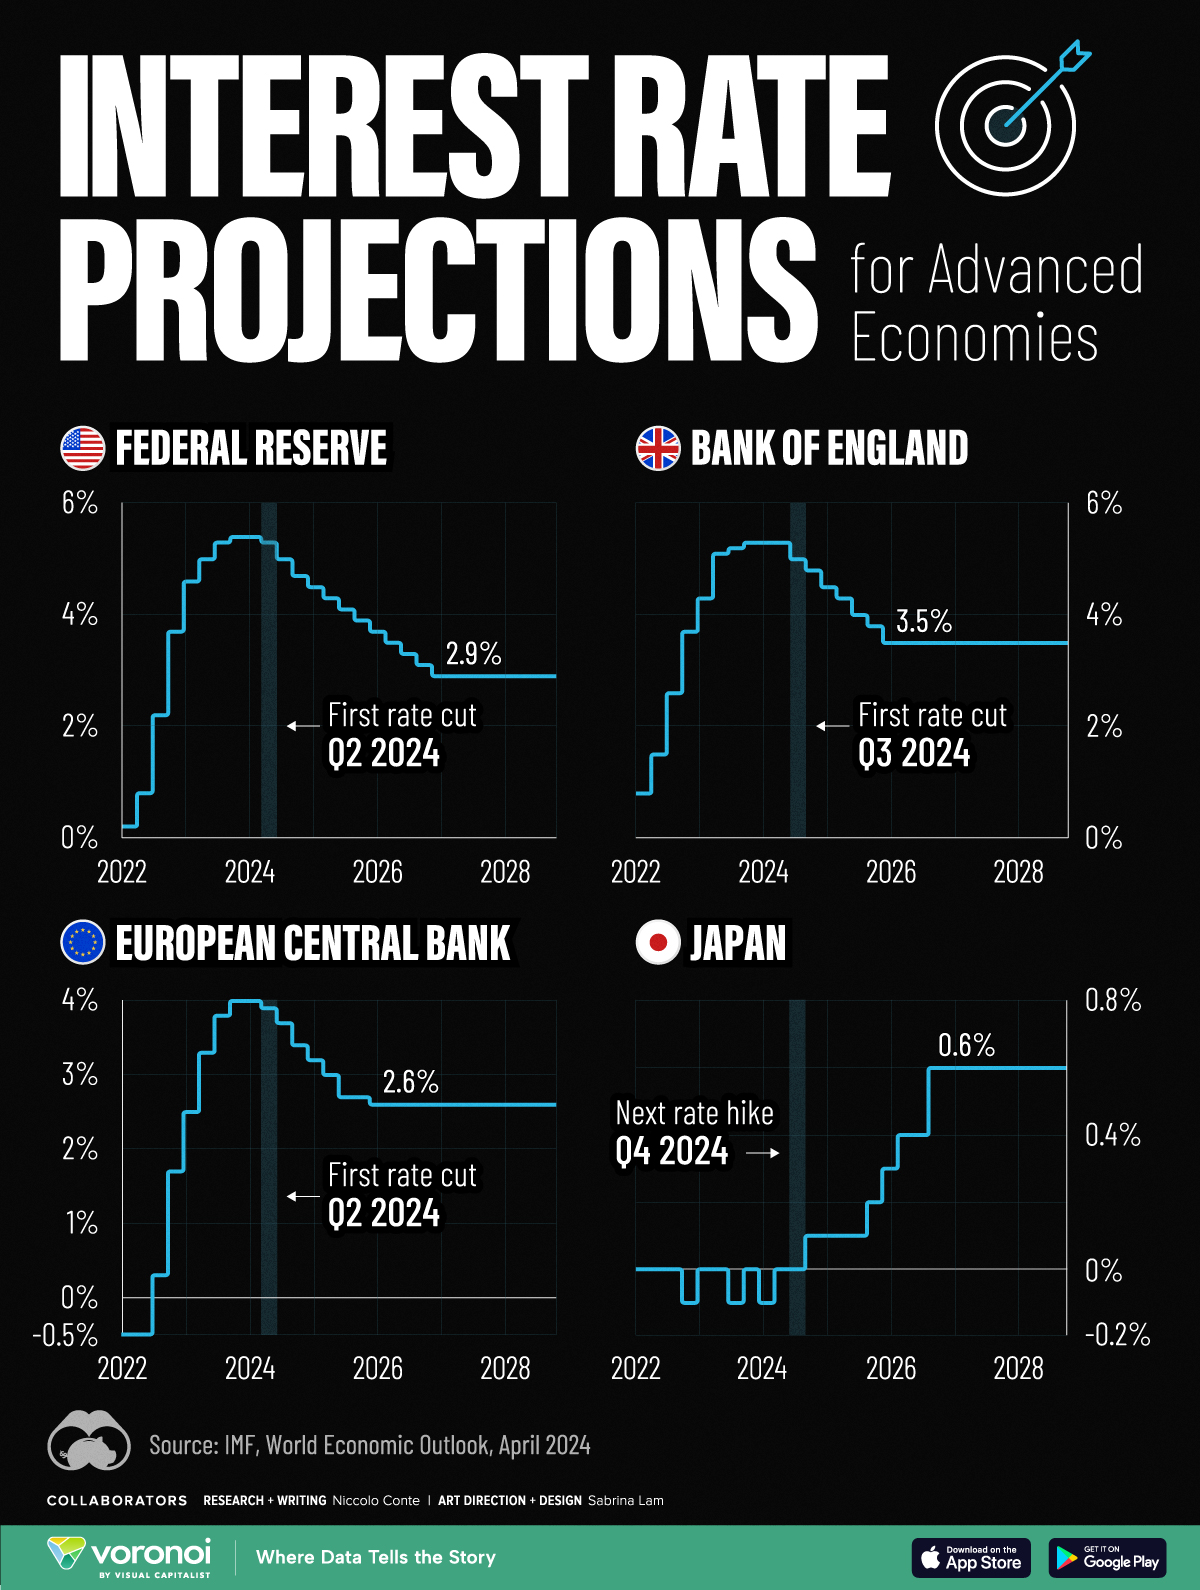
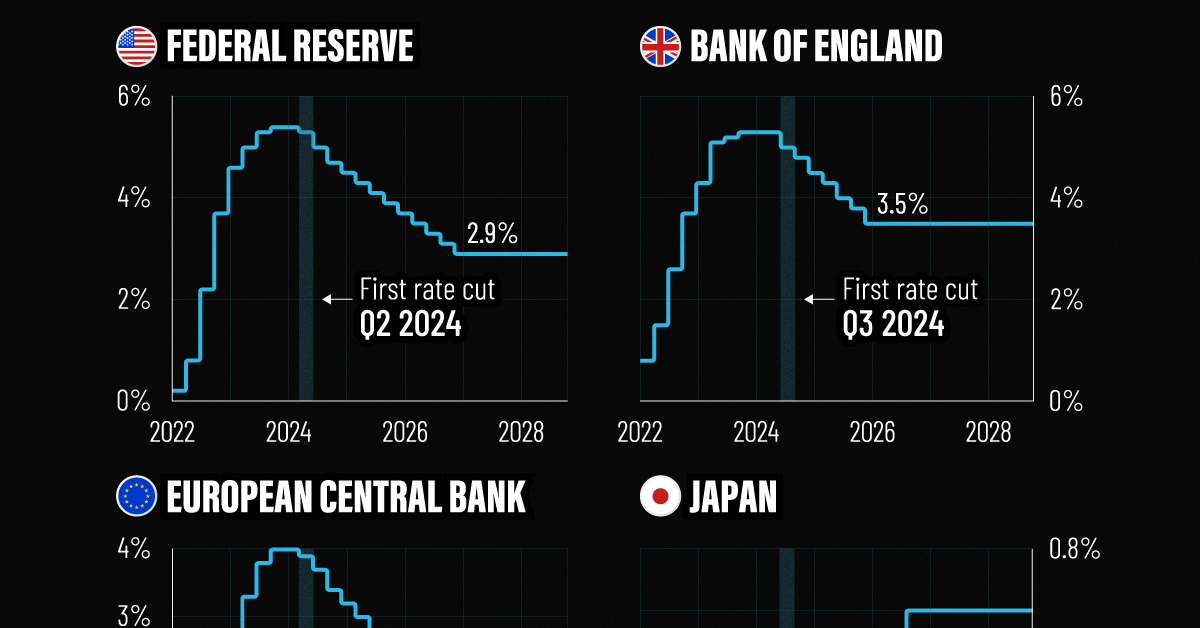
This graphic shows the interest rate forecast for advanced economies, based on the International Monetary Fund’s (IMF) 2024 World Economic Outlook.
Get the Key Insights of the IMF’s World Economic Outlook
Want a visual breakdown of the insights from the IMF’s 2024 World Economic Outlook report?
This visual is part of a special dispatch of the key takeaways exclusively for VC+ members.
Get the full dispatch of charts by signing up to VC+.
A Closer Look at the IMF Interest Rate Forecast
Below, we show the projected path of interest rates based on the IMF’s latest data:
| Federal Reserve | Bank of England | ECB | Bank of Japan | |
|---|---|---|---|---|
| Q1 2024 | 5.4% | 4.0% | -0.1% | 5.3% |
| Q2 2024 | 5.3% | 3.9% | 0.0% | 5.3% |
| Q3 2024 | 5.0% | 3.7% | 0.0% | 5.0% |
| Q4 2024 | 4.7% | 3.4% | 0.1% | 4.8% |
| Q1 2025 | 4.5% | 3.2% | 0.1% | 4.5% |
| Q2 2025 | 4.3% | 3.0% | 0.1% | 4.3% |
| Q3 2025 | 4.1% | 2.7% | 0.1% | 4.0% |
| Q4 2025 | 3.9% | 2.7% | 0.2% | 3.8% |
| Q1 2026 | 3.7% | 2.6% | 0.3% | 3.5% |
| Q2 2026 | 3.5% | 2.6% | 0.4% | 3.5% |
| Q3 2026 | 3.3% | 2.6% | 0.4% | 3.5% |
| Q4 2026 | 3.1% | 2.6% | 0.6% | 3.5% |
| Q1 2027 | 2.9% | 2.6% | 0.6% | 3.5% |
| Q2 2027 | 2.9% | 2.6% | 0.6% | 3.5% |
| Q3 2027 | 2.9% | 2.6% | 0.6% | 3.5% |
| Q4 2027 | 2.9% | 2.6% | 0.6% | 3.5% |
| Q1 2028 | 2.9% | 2.6% | 0.6% | 3.5% |
| Q2 2028 | 2.9% | 2.6% | 0.6% | 3.5% |
| Q3 2028 | 2.9% | 2.6% | 0.6% | 3.5% |
| Q4 2028 | 2.9% | 2.6% | 0.6% | 3.5% |
As we can see, the U.S. is forecast to see its first rate cut in the second quarter of 2024.
Broadly speaking, rates will be cut very gradually, with two additional rate cuts anticipated for this year. By 2027, interest rates are projected to fall to 2.9% after a series of moderate rate cuts as inflation dissipates.
Like the U.S., the European Central Bank is forecast to cut rates in the second quarter of 2024, with rates set to fall to 2.6% by 2026. While inflation has cooled at a faster rate across Europe compared to the U.S., GDP growth is also projected to be more muted. This year, the IMF projects that GDP across the euro area will increase just 0.8% versus 2.7% for the U.S. economy.
In the UK, monetary easing is projected to move more gradually, with the first cut projected for the third quarter of this year. Growth across the UK economy is projected to be tepid for 2024, weighed down by the impact of higher rates, lower productivity, and sluggish investment growth.
Rates Rising Slowly in Japan
After years of enduring negative interest rates, Japan raised its short-term policy rate to 0.0-0.1% in March 2024.
This was due in part to a promising inflation outlook over the coming years. The IMF projects that the next rate hike will take place in the fourth quarter of 2024, as it moves away from a multi-decade battle with deflation.
Get the Full Analysis of the IMF’s Outlook on VC+
This visual is part of an exclusive special dispatch for VC+ members which breaks down the key takeaways from the IMF’s 2024 World Economic Outlook.
For the full set of charts and analysis, sign up for VC+.

-

 Wealth6 days ago
Charted: Which City Has the Most Billionaires in 2024?
-

 Mining2 weeks ago
Gold vs. S&P 500: Which Has Grown More Over Five Years?
-

 Uranium2 weeks ago
The World’s Biggest Nuclear Energy Producers
-

 Education2 weeks ago
How Hard Is It to Get Into an Ivy League School?
-

 Debt2 weeks ago
How Debt-to-GDP Ratios Have Changed Since 2000
-

 Sports2 weeks ago
The Highest Earning Athletes in Seven Professional Sports
-

 Science2 weeks ago
Visualizing the Average Lifespans of Mammals
-

 Brands1 week ago
How Tech Logos Have Evolved Over Time