Markets
Survey Results: Will Global Stock Markets Crash in 2023?
Article/Editing:
Survey Results: Will Global Stock Markets Crash in 2023?
For the upcoming year, expert predictions have ranged from extreme optimism to not-so-subtle nervousness, especially when it comes to gauging the health of the global economy.
This chart from Gilbert Fontana skips past expert predictions, and looks directly at those of citizens in multiple countries around the world.
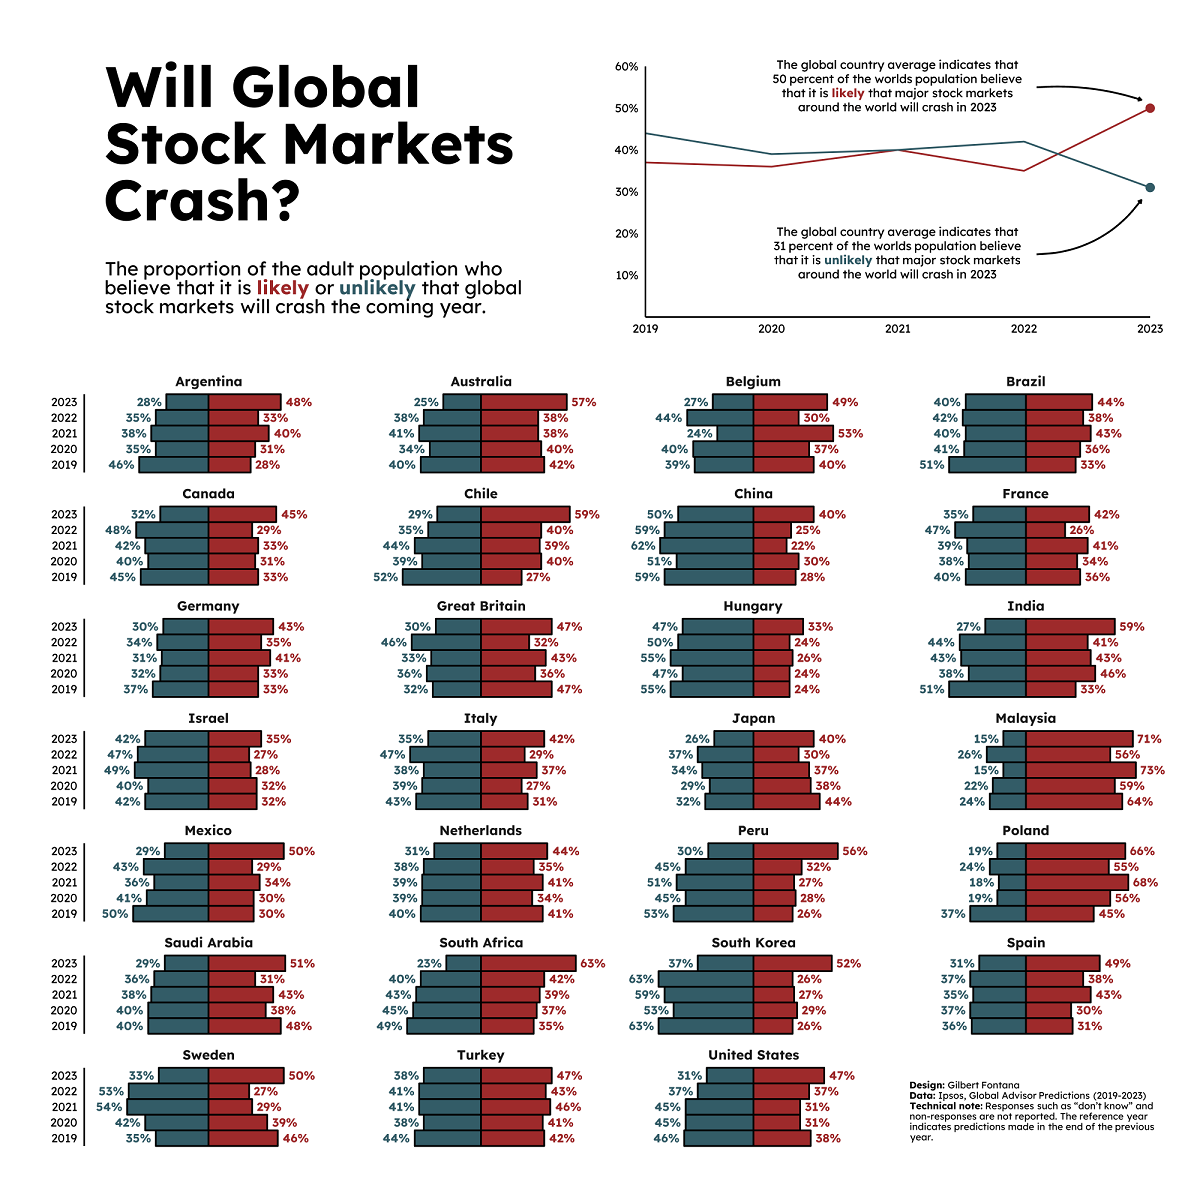
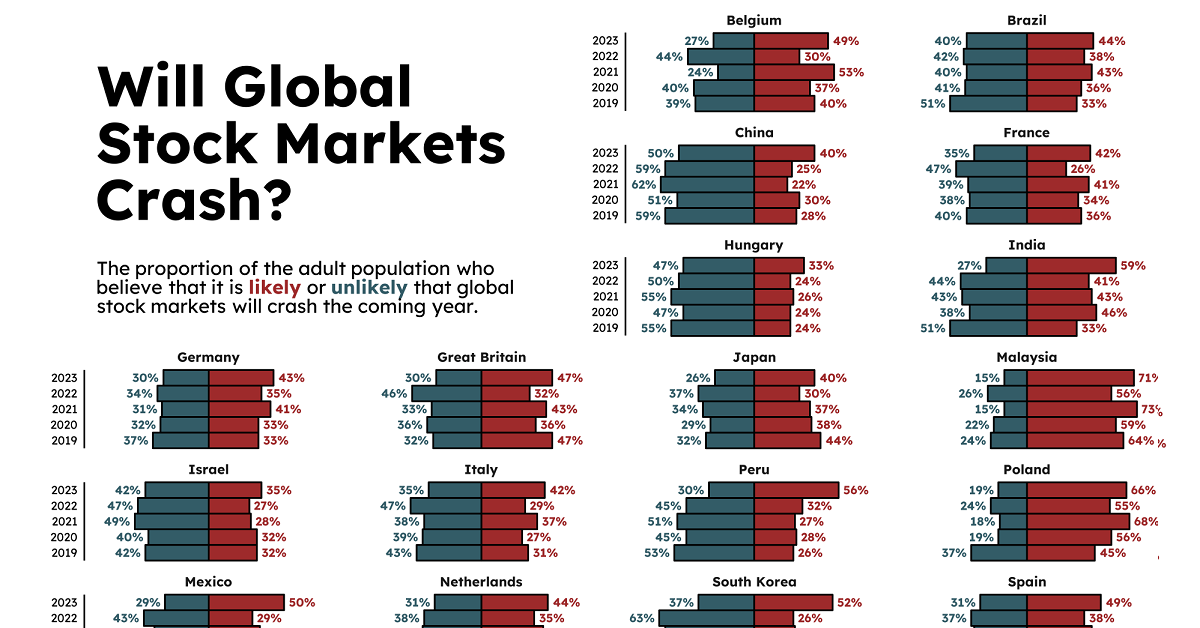
Using data from the Ipsos Global Advisor Predictions surveys from 2019‒2023, the chart plots the percentage of average citizens that think global stock markets will crash in the upcoming year.
Methodology
The annual reports used to generate the charts draw from a 36-country survey of more than 24,000 adults. Each country shown had at least 500 individuals sampled, with countries in the G7 and other major economies including China, Brazil, and South Korea having approximately 1,000 individuals sampled.
Specifically, respondents were asked a question on whether “major stock markets around the world will crash” in the following year, and were asked to respond either “likely” or “unlikely”.
Responses were collected at the end of the previous year in question. For example, for 2023, survey data was collected in October and November 2022. Responses of uncertainty or non-answers weren’t included in the chart above.
And across the board, each country’s data was also weighted to accurately reflect its demographic profile according to recent census data.
Stock Markets Crash Predictions By Country
When looking forward to 2023, most of the respondents from around the world felt that the likelihood of global stock markets crashing was more likely than unlikely.
| Market Crash Predictions by Country | Likely (2023) | Unlikely (2023) |
|---|---|---|
| 🇦🇷 Argentina | 48% | 28% |
| 🇦🇺 Australia | 57% | 25% |
| 🇧🇪 Belgium | 49% | 27% |
| 🇧🇷 Brazil | 44% | 40% |
| 🇨🇦 Canada | 45% | 32% |
| 🇨🇱 Chile | 59% | 29% |
| 🇨🇳 China | 40% | 50% |
| 🇫🇷 France | 42% | 35% |
| 🇩🇪 Germany | 43% | 30% |
| 🇬🇧 Great Britain (United Kingdom) | 47% | 30% |
| 🇭🇺 Hungary | 33% | 47% |
| 🇮🇳 India | 59% | 27% |
| 🇮🇱 Israel | 35% | 42% |
| 🇮🇹 Italy | 42% | 35% |
| 🇯🇵 Japan | 40% | 26% |
| 🇲🇾 Malaysia | 71% | 15% |
| 🇲🇽 Mexico | 50% | 29% |
| 🇳🇱 Netherlands | 44% | 31% |
| 🇵🇪 Peru | 56% | 30% |
| 🇵🇱 Poland | 66% | 19% |
| 🇸🇦 Saudi Arabia | 51% | 29% |
| 🇿🇦 South Africa | 63% | 23% |
| 🇰🇷 South Korea | 52% | 37% |
| 🇪🇸 Spain | 49% | 31% |
| 🇸🇪 Sweden | 50% | 33% |
| 🇹🇷 Turkey | 47% | 38% |
| 🇺🇸 United States | 47% | 31% |
| 🌎 Global Average | 50% | 31% |
In 24 of the 27 countries sampled, citizens thought it was more likely than not that global stock markets would crash in 2023. This includes the entire G7, with 40–47% of each member’s citizens responding “likely” compared to 26–35% responding “unlikely.”
The most pessimistic responses came from Malaysia, Poland, and South Africa, where more than 60% of respondents thought it was likely that markets would crash in 2023. Malaysian citizens led the way with 71% viewing a 2023 crash as likely.
The only three countries where citizens believed a 2023 stock market crash was less likely were China, Israel, and Hungary. China had the highest “unlikely” response rate at 50%, while in Hungary, just 33% of respondents responded “likely” compared to 47% responding unlikely.
Changing Stock Market Sentiments
When comparing 2023 responses to those from 2019, we can see that the last five years have brought uncertainty and pessimism to most countries:
| Change in Market Crash Predictions | % Likely Change (2019-2023) | % Unlikely Change (2019-2023) |
|---|---|---|
| 🇦🇷 Argentina | +20 pp | -18 pp |
| 🇦🇺 Australia | +15 pp | -15 pp |
| 🇧🇪 Belgium | +09 pp | -12 pp |
| 🇧🇷 Brazil | +11 pp | -11 pp |
| 🇨🇦 Canada | +12 pp | -13 pp |
| 🇨🇱 Chile | +32 pp | -23 pp |
| 🇨🇳 China | +12 pp | -09 pp |
| 🇫🇷 France | +06 pp | -05 pp |
| 🇩🇪 Germany | +10 pp | -07 pp |
| 🇬🇧 Great Britain (United Kingdom) | 0 pp | -02 pp |
| 🇭🇺 Hungary | +09 pp | -08 pp |
| 🇮🇳 India | +26 pp | -24 pp |
| 🇮🇱 Israel | +03 pp | 0 pp |
| 🇮🇹 Italy | +11 pp | -08 pp |
| 🇯🇵 Japan | -04 pp | -06 pp |
| 🇲🇾 Malaysia | +07 pp | -09 pp |
| 🇲🇽 Mexico | +20 pp | -21 pp |
| 🇳🇱 Netherlands | +03 pp | -09 pp |
| 🇵🇪 Peru | +30 pp | -23 pp |
| 🇵🇱 Poland | +21 pp | -18 pp |
| 🇸🇦 Saudi Arabia | +03 pp | -11 pp |
| 🇿🇦 South Africa | +28 pp | -26 pp |
| 🇰🇷 South Korea | +26 pp | -26 pp |
| 🇪🇸 Spain | +18 pp | -05 pp |
| 🇸🇪 Sweden | +04 pp | -02 pp |
| 🇹🇷 Turkey | +05 pp | -06 pp |
| 🇺🇸 United States | +09 pp | -15 pp |
| 🌎 Global Average | +13 pp | -13 pp |
Responses of global stock markets likely crashing rose in 25 of the 27 countries, with 8 countries increasing by more than 20 percentage points (pp). Notably, neighbors Chile and Peru had the highest increases at 32 pp and 30 pp respectively.
But neighboring sentiments didn’t track worldwide. For example, while South Korea had one of the biggest increases in “likely” responses towards stock markets crashing at 26 pp, Japan was the only country that responded in a lower likelihood by 4 pp.
While global sentiment is becoming increasingly pessimistic, we can also see that previous year’s predictions didn’t always pan out. So the question remains, what will 2023 really bring?

This article was published as a part of Visual Capitalist's Creator Program, which features data-driven visuals from some of our favorite Creators around the world.


Economy
Economic Growth Forecasts for G7 and BRICS Countries in 2024
The IMF has released its economic growth forecasts for 2024. How do the G7 and BRICS countries compare?


G7 & BRICS Real GDP Growth Forecasts for 2024
The International Monetary Fund’s (IMF) has released its real gross domestic product (GDP) growth forecasts for 2024, and while global growth is projected to stay steady at 3.2%, various major nations are seeing declining forecasts.
This chart visualizes the 2024 real GDP growth forecasts using data from the IMF’s 2024 World Economic Outlook for G7 and BRICS member nations along with Saudi Arabia, which is still considering an invitation to join the bloc.
Get the Key Insights of the IMF’s World Economic Outlook
Want a visual breakdown of the insights from the IMF’s 2024 World Economic Outlook report?
This visual is part of a special dispatch of the key takeaways exclusively for VC+ members.
Get the full dispatch of charts by signing up to VC+.
Mixed Economic Growth Prospects for Major Nations in 2024
Economic growth projections by the IMF for major nations are mixed, with the majority of G7 and BRICS countries forecasted to have slower growth in 2024 compared to 2023.
Only three BRICS-invited or member countries, Saudi Arabia, the UAE, and South Africa, have higher projected real GDP growth rates in 2024 than last year.
| Group | Country | Real GDP Growth (2023) | Real GDP Growth (2024P) |
|---|---|---|---|
| G7 | 🇺🇸 U.S. | 2.5% | 2.7% |
| G7 | 🇨🇦 Canada | 1.1% | 1.2% |
| G7 | 🇯🇵 Japan | 1.9% | 0.9% |
| G7 | 🇫🇷 France | 0.9% | 0.7% |
| G7 | 🇮🇹 Italy | 0.9% | 0.7% |
| G7 | 🇬🇧 UK | 0.1% | 0.5% |
| G7 | 🇩🇪 Germany | -0.3% | 0.2% |
| BRICS | 🇮🇳 India | 7.8% | 6.8% |
| BRICS | 🇨🇳 China | 5.2% | 4.6% |
| BRICS | 🇦🇪 UAE | 3.4% | 3.5% |
| BRICS | 🇮🇷 Iran | 4.7% | 3.3% |
| BRICS | 🇷🇺 Russia | 3.6% | 3.2% |
| BRICS | 🇪🇬 Egypt | 3.8% | 3.0% |
| BRICS-invited | 🇸🇦 Saudi Arabia | -0.8% | 2.6% |
| BRICS | 🇧🇷 Brazil | 2.9% | 2.2% |
| BRICS | 🇿🇦 South Africa | 0.6% | 0.9% |
| BRICS | 🇪🇹 Ethiopia | 7.2% | 6.2% |
| 🌍 World | 3.2% | 3.2% |
China and India are forecasted to maintain relatively high growth rates in 2024 at 4.6% and 6.8% respectively, but compared to the previous year, China is growing 0.6 percentage points slower while India is an entire percentage point slower.
On the other hand, four G7 nations are set to grow faster than last year, which includes Germany making its comeback from its negative real GDP growth of -0.3% in 2023.
Faster Growth for BRICS than G7 Nations
Despite mostly lower growth forecasts in 2024 compared to 2023, BRICS nations still have a significantly higher average growth forecast at 3.6% compared to the G7 average of 1%.
While the G7 countries’ combined GDP is around $15 trillion greater than the BRICS nations, with continued higher growth rates and the potential to add more members, BRICS looks likely to overtake the G7 in economic size within two decades.
BRICS Expansion Stutters Before October 2024 Summit
BRICS’ recent expansion has stuttered slightly, as Argentina’s newly-elected president Javier Milei declined its invitation and Saudi Arabia clarified that the country is still considering its invitation and has not joined BRICS yet.
Even with these initial growing pains, South Africa’s Foreign Minister Naledi Pandor told reporters in February that 34 different countries have submitted applications to join the growing BRICS bloc.
Any changes to the group are likely to be announced leading up to or at the 2024 BRICS summit which takes place October 22-24 in Kazan, Russia.
Get the Full Analysis of the IMF’s Outlook on VC+
This visual is part of an exclusive special dispatch for VC+ members which breaks down the key takeaways from the IMF’s 2024 World Economic Outlook.
For the full set of charts and analysis, sign up for VC+.

-

 Debt1 week ago
How Debt-to-GDP Ratios Have Changed Since 2000
-

 Markets2 weeks ago
Ranked: The World’s Top Flight Routes, by Revenue
-

 Countries2 weeks ago
Population Projections: The World’s 6 Largest Countries in 2075
-

 Markets2 weeks ago
The Top 10 States by Real GDP Growth in 2023
-

 Demographics2 weeks ago
The Smallest Gender Wage Gaps in OECD Countries
-

 United States2 weeks ago
Where U.S. Inflation Hit the Hardest in March 2024
-

 Green2 weeks ago
Top Countries By Forest Growth Since 2001
-

 United States2 weeks ago
Ranked: The Largest U.S. Corporations by Number of Employees