Misc
Visualizing Two Decades of Reported Hate Crimes in the U.S.
Article/Editing:
var divElement = document.getElementById(‘viz1657269922717’); var vizElement = divElement.getElementsByTagName(‘object’)[0]; vizElement.style.width=’1200px’;vizElement.style.height=’1107px’; var scriptElement = document.createElement(‘script’); scriptElement.src = ‘https://public.tableau.com/javascripts/api/viz_v1.js’; vizElement.parentNode.insertBefore(scriptElement, vizElement);
Open the large interactive version here
Open the large interactive version here
Visualizing Two Decades of Reported Hate Crimes in the U.S.
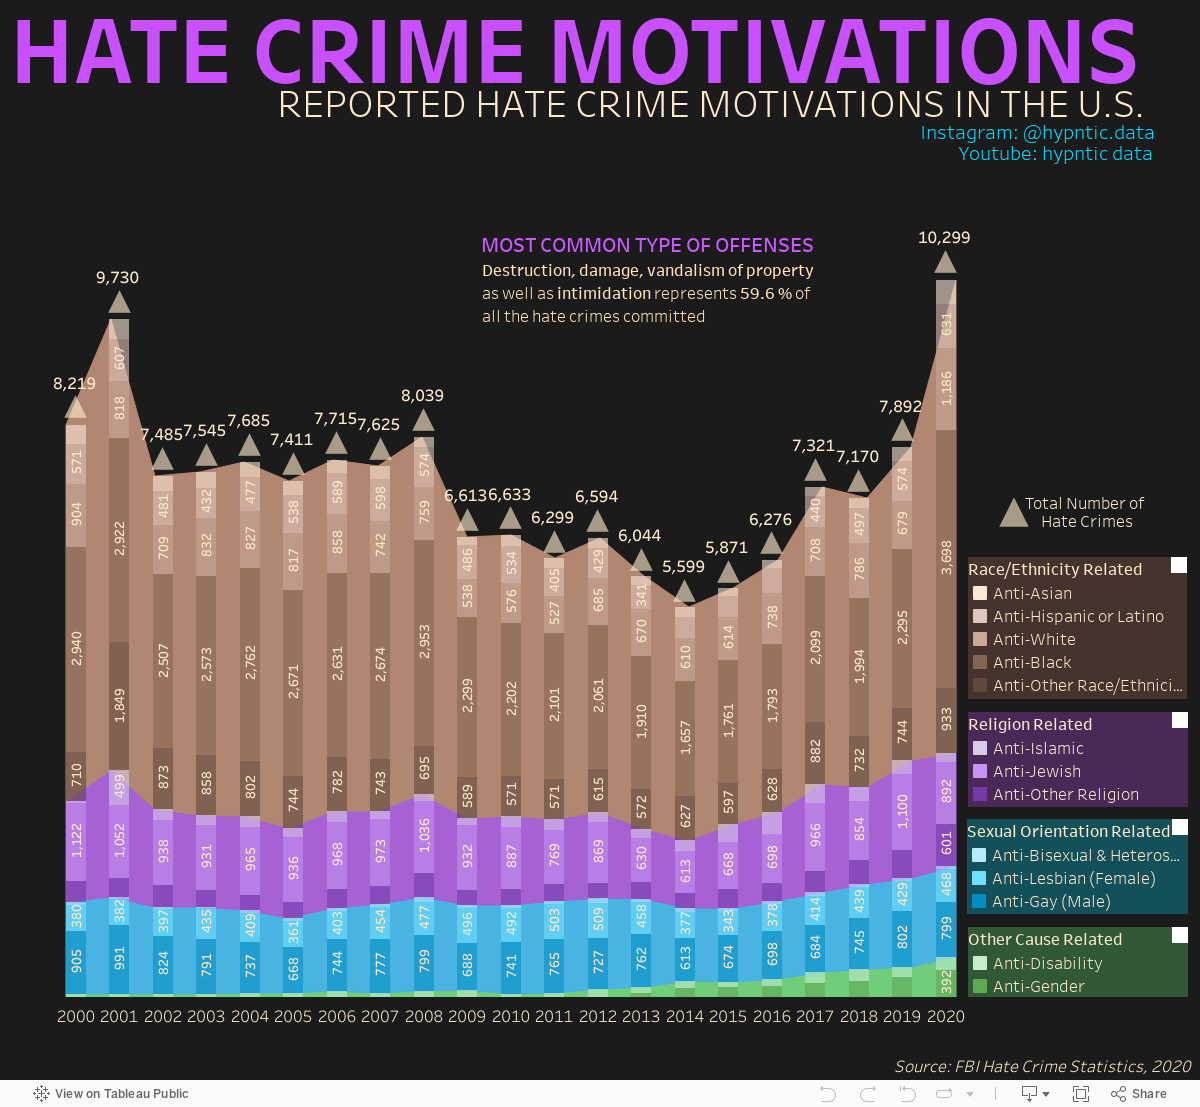
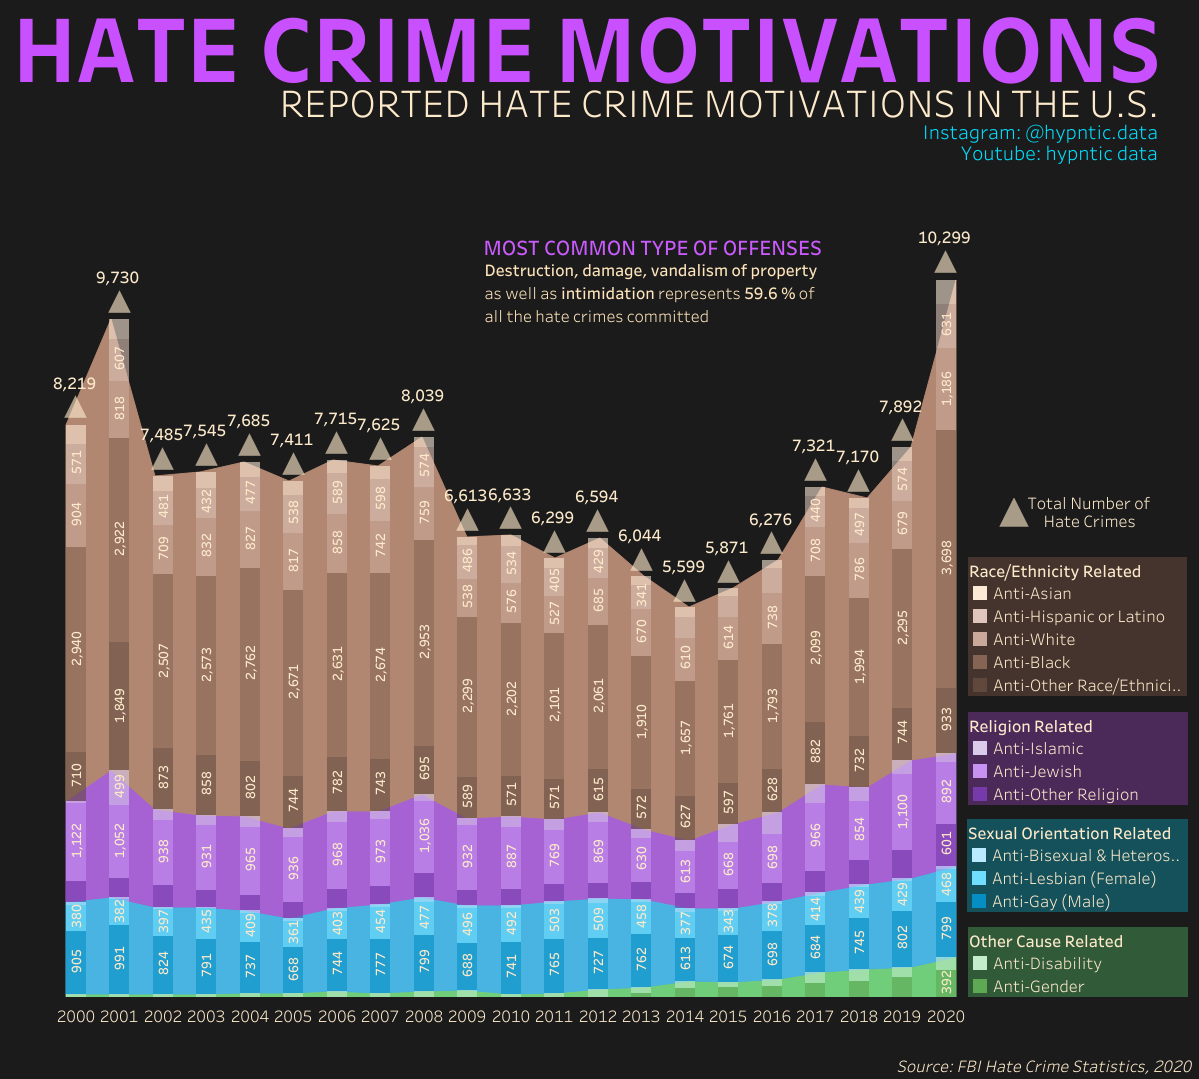
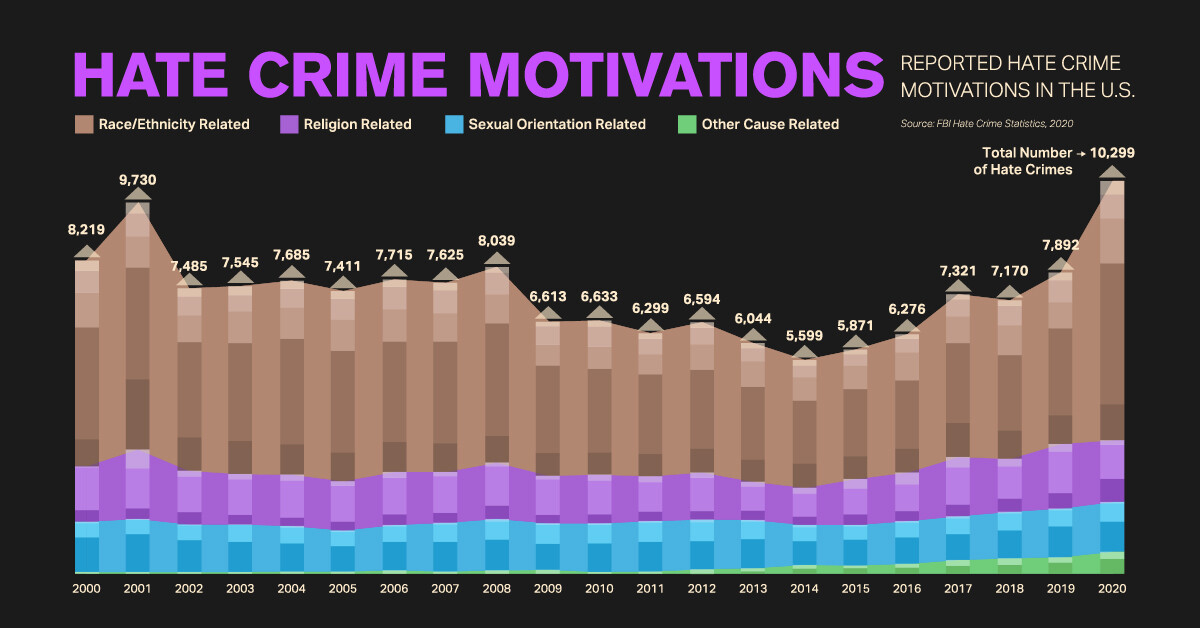
Across the U.S., thousands of hate crimes are committed each year, with many different motivating biases.
In 2020 alone, more than 10,000 unique hate crime incidents were reported to the Federal Bureau of Investigation (FBI)—and it’s likely that thousands more were committed that didn’t get reported to law enforcement.
What are the most commonly reported motivating biases, and how have hate crime rates evolved over the years? This graphic uses data from the FBI to visualize two decades of reported hate crime incidents across America.
What is Considered a Hate Crime?
Before diving in, it’s important to determine what constitutes a hate crime.
According to the U.S. Department of Justice, a hate crime is a crime that’s “committed on the basis of the victim’s perceived or actual race, color, religion, national origin, sexual orientation, gender, gender identity, or disability.”
These types of crimes are a threat to society, as they have a broader impact on communities than other types of crimes do. This is because hate crimes can foster fear and intimidate large groups of people or marginalized communities, making them feel unwelcome, unsafe, or othered.
Hate Crimes on the Rise
Hate crimes have been rising across the U.S. in nearly every year since 2014. By 2020, reported crimes across America reached record-level highs not seen in over two decades.
| Year | Number of Reported Incidents | % Change (y-o-y) |
|---|---|---|
| 2001 | 9730 | 18.4% |
| 2002 | 7485 | -23.1% |
| 2003 | 7545 | 0.8% |
| 2004 | 7685 | 1.9% |
| 2005 | 7411 | -3.6% |
| 2006 | 7715 | 4.1% |
| 2007 | 7625 | -1.2% |
| 2008 | 8039 | 5.4% |
| 2009 | 6613 | -17.7% |
| 2010 | 6633 | 0.3% |
| 2011 | 6299 | -5.0% |
| 2012 | 6594 | 4.7% |
| 2013 | 6044 | -8.3% |
| 2014 | 5599 | -7.4% |
| 2015 | 5871 | 4.9% |
| 2016 | 6276 | 6.9% |
| 2017 | 7321 | 16.7% |
| 2018 | 7170 | -2.1% |
| 2019 | 7892 | 10.1% |
| 2020 | 10299 | 30.5% |
And sadly, these figures are likely a vast undercount. Law enforcement submit this data to the FBI of their own volition, and in 2020, thousands of agencies did not submit their crime statistics.
Race-Related Hate Crimes are Most Common
Historically, the most reported hate crimes in the U.S. are related to race. In 2020, about 66% of incidents were motivated by discrimination against the victim’s race or ethnicity.
| Type of Bias | Total Number of Crimes (2020) | % of Total |
|---|---|---|
| Race/Ethnicity | 6793 | 66.0% |
| Religion | 1626 | 15.8% |
| Sexual Orientation | 1311 | 12.7% |
| Other | 569 | 5.5% |
| Total | 10299 | -- |
While race is the most commonly reported hate crime, incidents related to gender and gender identity are on the rise—in 2020, there was a 9% increase in gender-related incidents, and a 34% increase in gender identity-related incidents, compared to 2019 figures.

This article was published as a part of Visual Capitalist's Creator Program, which features data-driven visuals from some of our favorite Creators around the world.


VC+
VC+: Get Our Key Takeaways From the IMF’s World Economic Outlook
A sneak preview of the exclusive VC+ Special Dispatch—your shortcut to understanding IMF’s World Economic Outlook report.

Have you read IMF’s latest World Economic Outlook yet? At a daunting 202 pages, we don’t blame you if it’s still on your to-do list.
But don’t worry, you don’t need to read the whole April release, because we’ve already done the hard work for you.
To save you time and effort, the Visual Capitalist team has compiled a visual analysis of everything you need to know from the report—and our VC+ Special Dispatch is available exclusively to VC+ members. All you need to do is log into the VC+ Archive.
If you’re not already subscribed to VC+, make sure you sign up now to access the full analysis of the IMF report, and more (we release similar deep dives every week).
For now, here’s what VC+ members get to see.
Your Shortcut to Understanding IMF’s World Economic Outlook
With long and short-term growth prospects declining for many countries around the world, this Special Dispatch offers a visual analysis of the key figures and takeaways from the IMF’s report including:
- The global decline in economic growth forecasts
- Real GDP growth and inflation forecasts for major nations in 2024
- When interest rate cuts will happen and interest rate forecasts
- How debt-to-GDP ratios have changed since 2000
- And much more!

Get the Full Breakdown in the Next VC+ Special Dispatch
VC+ members can access the full Special Dispatch by logging into the VC+ Archive, where you can also check out previous releases.
Make sure you join VC+ now to see exclusive charts and the full analysis of key takeaways from IMF’s World Economic Outlook.
Don’t miss out. Become a VC+ member today.
What You Get When You Become a VC+ Member
VC+ is Visual Capitalist’s premium subscription. As a member, you’ll get the following:
- Special Dispatches: Deep dive visual briefings on crucial reports and global trends
- Markets This Month: A snappy summary of the state of the markets and what to look out for
- The Trendline: Weekly curation of the best visualizations from across the globe
- Global Forecast Series: Our flagship annual report that covers everything you need to know related to the economy, markets, geopolitics, and the latest tech trends
- VC+ Archive: Hundreds of previously released VC+ briefings and reports that you’ve been missing out on, all in one dedicated hub
You can get all of the above, and more, by joining VC+ today.

-

 Debt1 week ago
How Debt-to-GDP Ratios Have Changed Since 2000
-

 Markets2 weeks ago
Ranked: The World’s Top Flight Routes, by Revenue
-

 Countries2 weeks ago
Population Projections: The World’s 6 Largest Countries in 2075
-

 Markets2 weeks ago
The Top 10 States by Real GDP Growth in 2023
-

 Demographics2 weeks ago
The Smallest Gender Wage Gaps in OECD Countries
-

 United States2 weeks ago
Where U.S. Inflation Hit the Hardest in March 2024
-

 Green2 weeks ago
Top Countries By Forest Growth Since 2001
-

 United States2 weeks ago
Ranked: The Largest U.S. Corporations by Number of Employees