Technology
What is the Greatest Cybersecurity Threat: Insiders or Outsiders?
In a short two years, it is safe to say that the prospect of cybercrime has suddenly shifted to be a top concern for many decision makers around the world.
It started with the explosive hacks that rocked companies like Sony, JP Morgan, Target, and other well-known brands. More recently, it was the release of thousands of hacked emails from the DNC and John Podesta, along with the allegations of Russian hacking, that has led the news cycle.
As a result, it is not surprising that much of today’s narrative on cybercrime is centered around the devastating potential of external threats to countries or businesses. The reality is, however, that there is a whole other side of things to consider.
Are Insiders or Outsiders the Greatest Cybersecurity Threat?
While external threats like cybercriminals or hackers are an ongoing concern for organizations, it is actually malicious insider attacks that tend to cause the most damage on average (in terms of costs).
Today’s infographic from Digital Guardian explains the differences, methods, and typical costs associated with each kind of cybersecurity threat.
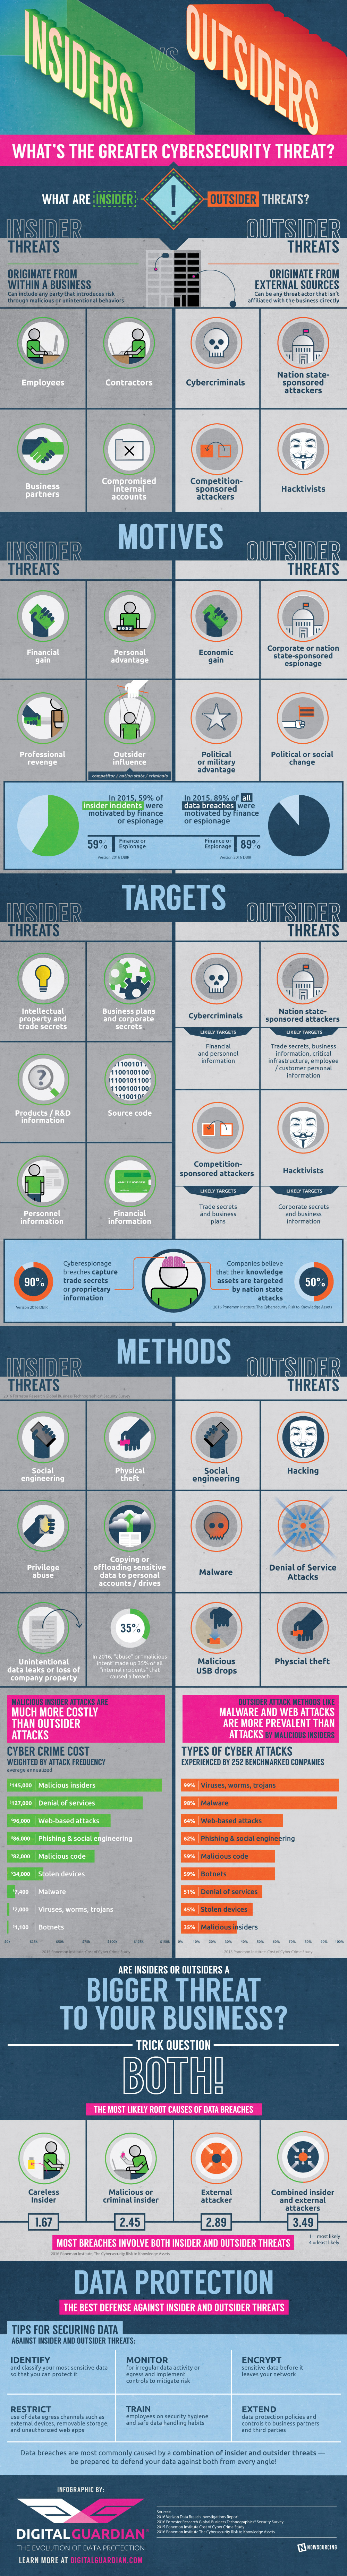
Is it insiders or outsiders that pose the greatest threat to organizations? The answer seems to be both, and for very different reasons.
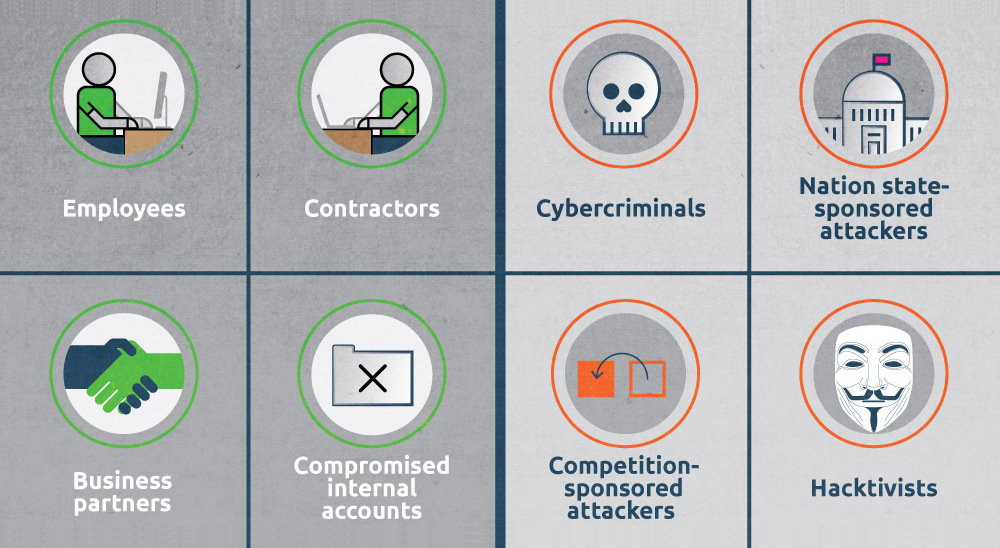
Insiders or Outsiders?
Outside threats such as cybercriminals, nation state-sponsored attacks, competition-sponsored attacks, and hacktivists are certainly more sophisticated in their approaches, but they also lack the credentials and information that insiders may hold. For that reason, the most likely root cause of data breaches involve both insider and outsider threats together.
Strictly in terms of costs, it’s malicious insider attacks that pose the biggest cybersecurity threat to organizations. When weighted for attack frequency, the average annualized cost of such an attack is $144,542 per year according to the Ponemon Institute.
This puts it above DoS attacks, but by a relatively small margin:
| Type of cyberattack | Avg. cost per attack, weighted by frequency |
|---|---|
| Malicious insiders | $144,542 |
| Denial of services | $126,545 |
| Web-based attacks | $96,424 |
| Phishing & social engineering | $85,959 |
| Malicious code | $81,500 |
| Stolen devices | $33,565 |
| Malware | $7,378 |
| Viruses, worms, trojans | $1,900 |
| Botnets | $1,075 |


Technology
All of the Grants Given by the U.S. CHIPS Act
Intel, TSMC, and more have received billions in subsidies from the U.S. CHIPS Act in 2024.


All of the Grants Given by the U.S. CHIPS Act
This was originally posted on our Voronoi app. Download the app for free on iOS or Android and discover incredible data-driven charts from a variety of trusted sources.
This visualization shows which companies are receiving grants from the U.S. CHIPS Act, as of April 25, 2024. The CHIPS Act is a federal statute signed into law by President Joe Biden that authorizes $280 billion in new funding to boost domestic research and manufacturing of semiconductors.
The grant amounts visualized in this graphic are intended to accelerate the production of semiconductor fabrication plants (fabs) across the United States.
Data and Company Highlights
The figures we used to create this graphic were collected from a variety of public news sources. The Semiconductor Industry Association (SIA) also maintains a tracker for CHIPS Act recipients, though at the time of writing it does not have the latest details for Micron.
| Company | Federal Grant Amount | Anticipated Investment From Company |
|---|---|---|
| 🇺🇸 Intel | $8,500,000,000 | $100,000,000,000 |
| 🇹🇼 TSMC | $6,600,000,000 | $65,000,000,000 |
| 🇰🇷 Samsung | $6,400,000,000 | $45,000,000,000 |
| 🇺🇸 Micron | $6,100,000,000 | $50,000,000,000 |
| 🇺🇸 GlobalFoundries | $1,500,000,000 | $12,000,000,000 |
| 🇺🇸 Microchip | $162,000,000 | N/A |
| 🇬🇧 BAE Systems | $35,000,000 | N/A |
BAE Systems was not included in the graphic due to size limitations
Intel’s Massive Plans
Intel is receiving the largest share of the pie, with $8.5 billion in grants (plus an additional $11 billion in government loans). This grant accounts for 22% of the CHIPS Act’s total subsidies for chip production.
From Intel’s side, the company is expected to invest $100 billion to construct new fabs in Arizona and Ohio, while modernizing and/or expanding existing fabs in Oregon and New Mexico. Intel could also claim another $25 billion in credits through the U.S. Treasury Department’s Investment Tax Credit.
TSMC Expands its U.S. Presence
TSMC, the world’s largest semiconductor foundry company, is receiving a hefty $6.6 billion to construct a new chip plant with three fabs in Arizona. The Taiwanese chipmaker is expected to invest $65 billion into the project.
The plant’s first fab will be up and running in the first half of 2025, leveraging 4 nm (nanometer) technology. According to TrendForce, the other fabs will produce chips on more advanced 3 nm and 2 nm processes.
The Latest Grant Goes to Micron
Micron, the only U.S.-based manufacturer of memory chips, is set to receive $6.1 billion in grants to support its plans of investing $50 billion through 2030. This investment will be used to construct new fabs in Idaho and New York.

-

 Energy1 week ago
The World’s Biggest Nuclear Energy Producers
-

 Money2 weeks ago
Which States Have the Highest Minimum Wage in America?
-

 Technology2 weeks ago
Ranked: Semiconductor Companies by Industry Revenue Share
-

 Markets2 weeks ago
Ranked: The World’s Top Flight Routes, by Revenue
-

 Countries2 weeks ago
Population Projections: The World’s 6 Largest Countries in 2075
-

 Markets2 weeks ago
The Top 10 States by Real GDP Growth in 2023
-

 Demographics2 weeks ago
The Smallest Gender Wage Gaps in OECD Countries
-

 United States2 weeks ago
Where U.S. Inflation Hit the Hardest in March 2024