Misc
The World’s Largest Megaprojects
Before a megaproject gets the nod to go ahead, a very unique set of circumstances must first be considered.
There is no blueprint or shortcut for building a world-changing megaproject. In fact, each one must be designed and built from the ground up, often amidst considerable amounts of red tape and criticism. Builders of megaprojects embrace the unknown, even when faced with incredible amounts of risk and massive cost overruns.
At the same time, successful megaprojects can accomplish things that have never been done before. They can be pinnacles of human achievement, and spectacles such as the International Space Station and the U.S. Interstate Highway System have already changed the world.
The World’s Largest Megaprojects
This infographic from Futurism details nine of the world’s largest megaprojects currently in construction.
They range from giant $64 billion theme parks (Dubailand) to massive canals that will take 48 years to build (South-North Water Transfer Project in China).
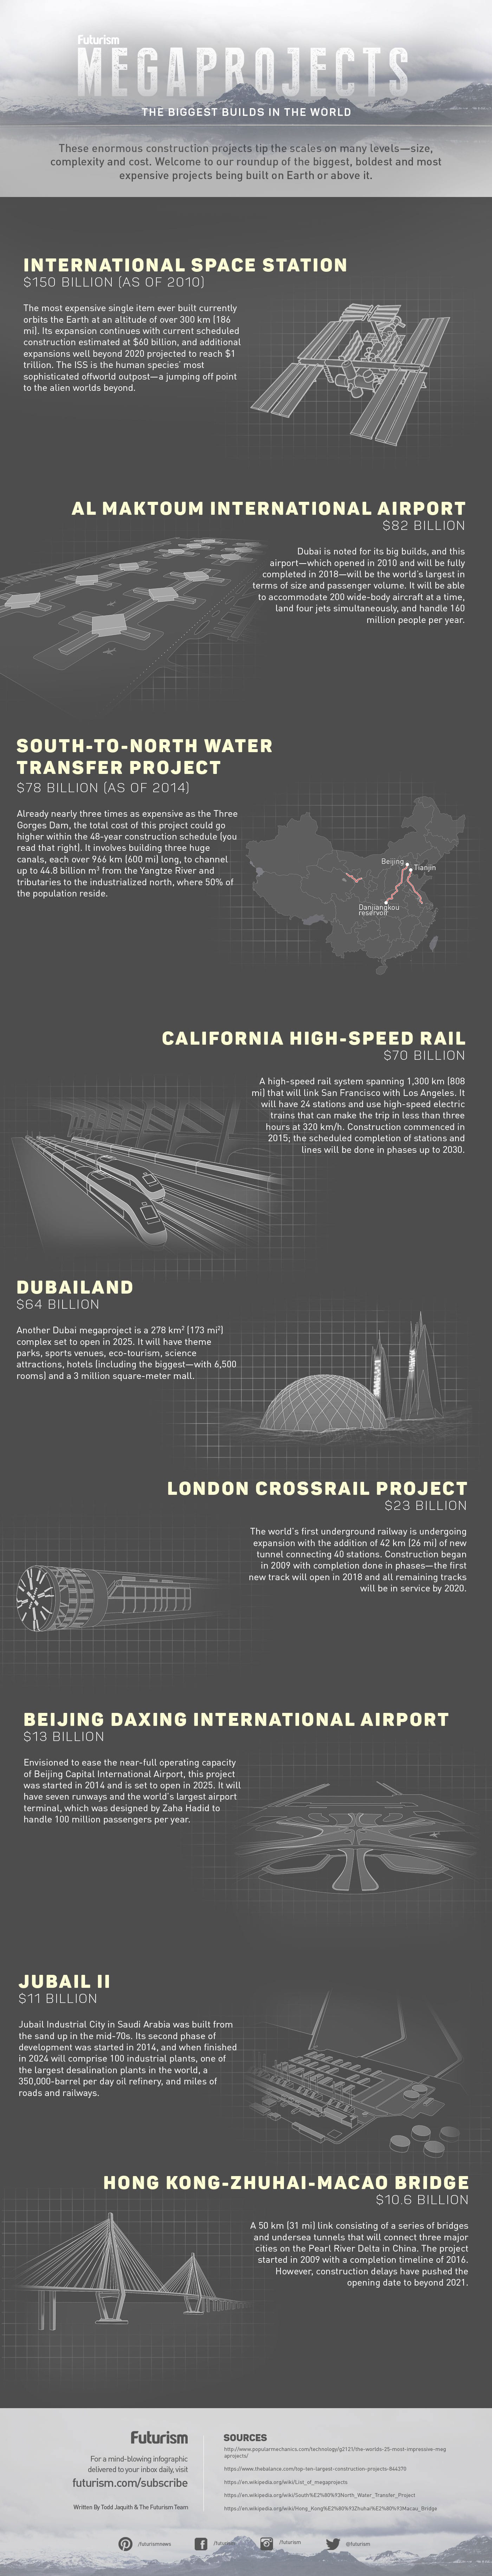
Here are the nine largest megaprojects in construction right now, in order from most to least expensive:
1. International Space Station – $150 billion (as of 2010)
The most expensive single item ever built. Expansions beyond 2020 are estimated to eventually cost $1 trillion.
2. Al Maktoum International Airport – $82 billion
This airport in Dubai will be fully operational by 2018. It will be the world’s largest in terms of size and passenger volume – so big that four jets will be able to land simultaneously.
3. South-to-North Water Transfer Project – $78 billion (as of 2014)
Thought the Three Gorges Dam was massive? This other Chinese megaproject is already nearly three times as expensive – it aims to divert water from the Yangtze River using three huge canals to bring it to the north of the country.
4. California High-Speed Rail – $70 billion
Spanning 1,300 km (808 mi), this will link San Francisco to Los Angeles.
5. Dubailand – $64 billion
This mega theme park project will open in 2025 in Dubai. It will also have the world’s largest hotel (6,500 rooms), sports venues, eco-tourism, science attractions, and a giant mall.
6. London Crossrail Project – $23 billion
London is expanding its underground system, with 42 km (26 mi) of new tunnels to connect 40 stations. Everything will be complete by 2020.
7. Beijing Daxing International Airport – $13 billion
Opening in 2025, this airport megaproject will have seven runways and the largest terminal in the world. It will help ease the load on nearby Beijing Capital International Airport.
8. Jubail II – $11 billion
The second phase of development of the Jubail Industrial City in Saudi Arabia will add 100 industrial plants, an oil refinery, and one of the bigger desalination plants in the world.
9. Hong Kong-Zhuhai-Macao Bridge – $10.6 billion
A series of bridges and undersea tunnels to link the three major cities on the Pearl River Delta in China. Ultimately, it will be 50 km (31 mi) of links, opening sometime beyond 2021.


VC+
VC+: Get Our Key Takeaways From the IMF’s World Economic Outlook
A sneak preview of the exclusive VC+ Special Dispatch—your shortcut to understanding IMF’s World Economic Outlook report.

Have you read IMF’s latest World Economic Outlook yet? At a daunting 202 pages, we don’t blame you if it’s still on your to-do list.
But don’t worry, you don’t need to read the whole April release, because we’ve already done the hard work for you.
To save you time and effort, the Visual Capitalist team has compiled a visual analysis of everything you need to know from the report—and our VC+ Special Dispatch is available exclusively to VC+ members. All you need to do is log into the VC+ Archive.
If you’re not already subscribed to VC+, make sure you sign up now to access the full analysis of the IMF report, and more (we release similar deep dives every week).
For now, here’s what VC+ members get to see.
Your Shortcut to Understanding IMF’s World Economic Outlook
With long and short-term growth prospects declining for many countries around the world, this Special Dispatch offers a visual analysis of the key figures and takeaways from the IMF’s report including:
- The global decline in economic growth forecasts
- Real GDP growth and inflation forecasts for major nations in 2024
- When interest rate cuts will happen and interest rate forecasts
- How debt-to-GDP ratios have changed since 2000
- And much more!

Get the Full Breakdown in the Next VC+ Special Dispatch
VC+ members can access the full Special Dispatch by logging into the VC+ Archive, where you can also check out previous releases.
Make sure you join VC+ now to see exclusive charts and the full analysis of key takeaways from IMF’s World Economic Outlook.
Don’t miss out. Become a VC+ member today.
What You Get When You Become a VC+ Member
VC+ is Visual Capitalist’s premium subscription. As a member, you’ll get the following:
- Special Dispatches: Deep dive visual briefings on crucial reports and global trends
- Markets This Month: A snappy summary of the state of the markets and what to look out for
- The Trendline: Weekly curation of the best visualizations from across the globe
- Global Forecast Series: Our flagship annual report that covers everything you need to know related to the economy, markets, geopolitics, and the latest tech trends
- VC+ Archive: Hundreds of previously released VC+ briefings and reports that you’ve been missing out on, all in one dedicated hub
You can get all of the above, and more, by joining VC+ today.

-

 Mining1 week ago
Gold vs. S&P 500: Which Has Grown More Over Five Years?
-

 Markets2 weeks ago
Ranked: The Most Valuable Housing Markets in America
-

 Money2 weeks ago
Which States Have the Highest Minimum Wage in America?
-

 AI2 weeks ago
Ranked: Semiconductor Companies by Industry Revenue Share
-

 Markets2 weeks ago
Ranked: The World’s Top Flight Routes, by Revenue
-

 Countries2 weeks ago
Population Projections: The World’s 6 Largest Countries in 2075
-

 Markets2 weeks ago
The Top 10 States by Real GDP Growth in 2023
-

 Demographics2 weeks ago
The Smallest Gender Wage Gaps in OECD Countries