Technology
A Visual Breakdown of Global Music Consumption
Article/Editing:
A Visual Breakdown of Global Music Consumption
To maximize any chance of success in the music business, aspiring artists must gain an understanding of how music is consumed and how that is changing alongside technology.
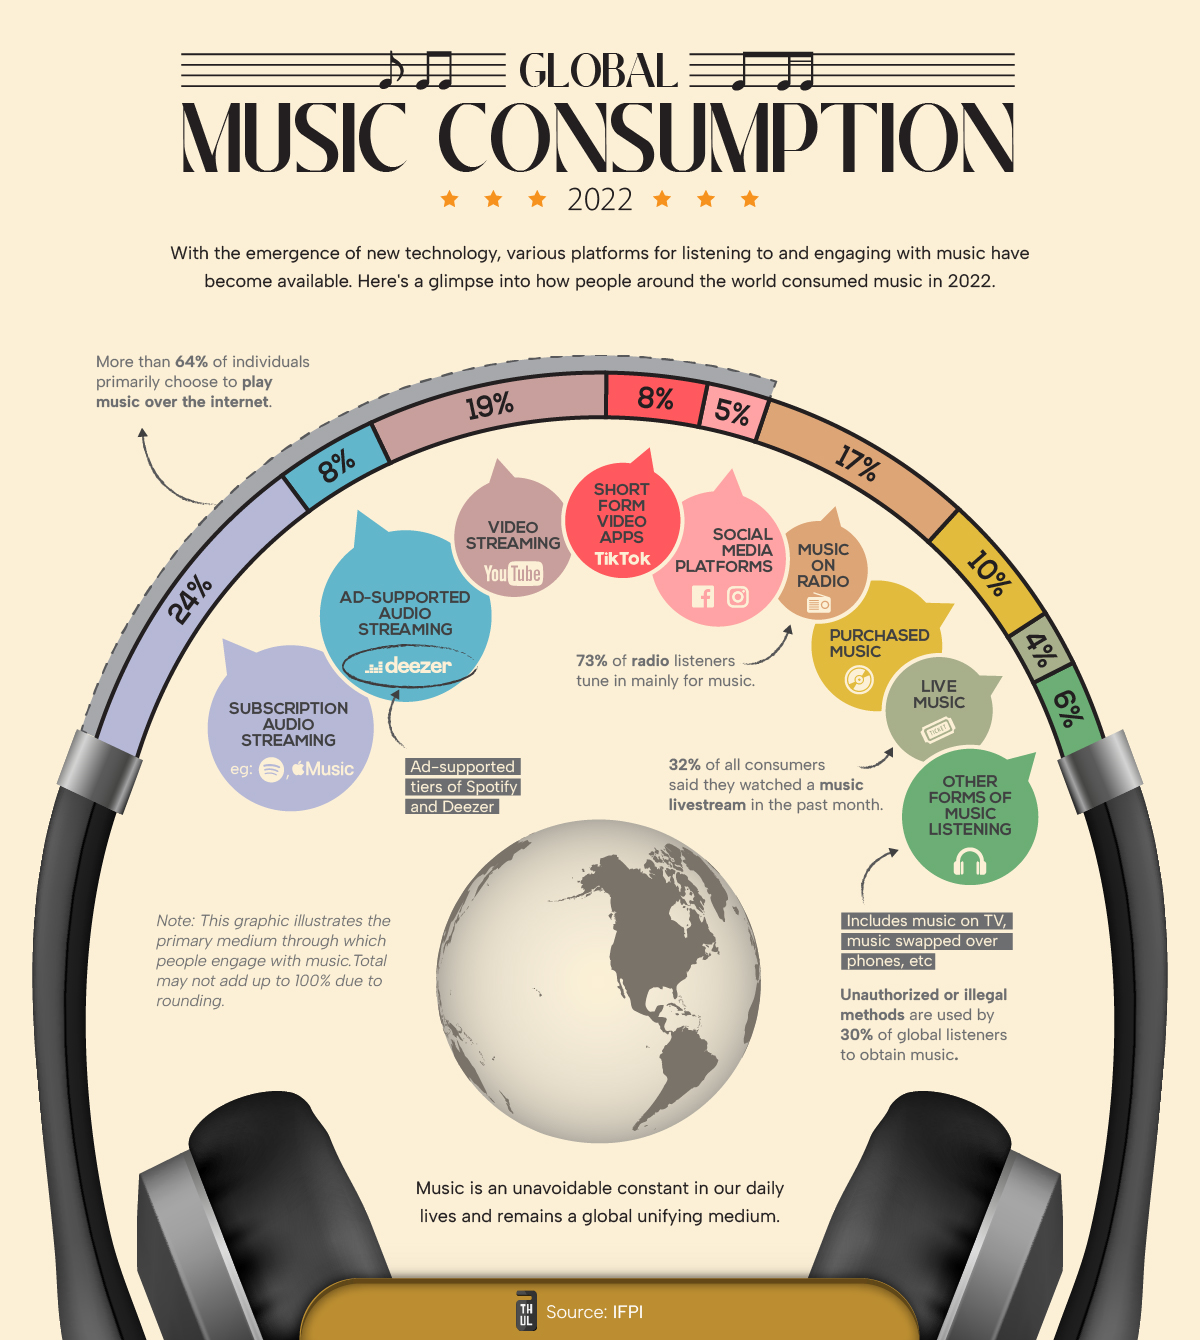
This graphic from Athul Alexander highlights global music consumption habits. Data is from 2022 and is sourced from a survey of over 44,000 people from 22 countries by IFPI that asked people their primary mode for consuming music.
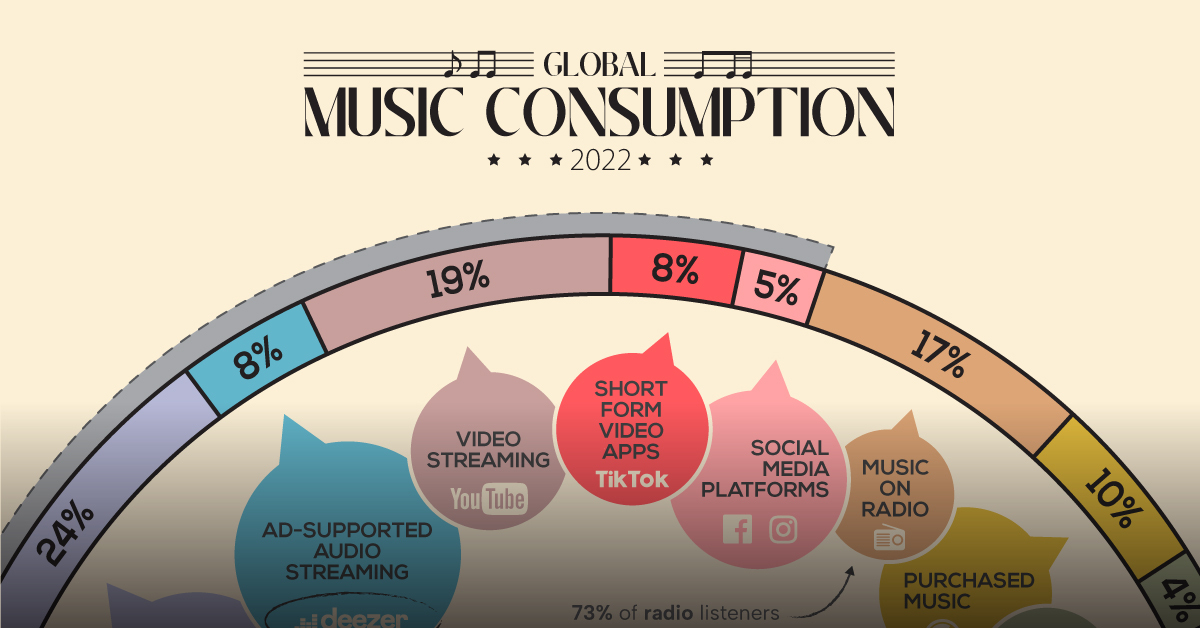
As of 2022, paid subscription services (i.e. Apple Music, Spotify) are the most preferred option for listeners, accounting for nearly one-fourth of main platform share.
| Rank | Service | Share | Examples |
|---|---|---|---|
| 1 | Paid Audio Streaming | 24% | Spotify, Apple Music |
| 2 | Video Streaming | 19% | YouTube |
| 3 | Radio | 17% | |
| 4 | Purchased Music | 10% | Vinyls, CDs, purchased digital albums |
| 5 | Ad-Supported Audio Streaming | 8% | Amazon, Deezer |
| 6 | Short-form Videos | 8% | TikTok |
| 7 | Social Media Videos | 5% | Facebook, Instagram |
| 8 | Live Music | 4% | concerts, livestreams |
| 9 | Other | 6% | music on TV, phone-to-phone transfers |
Short-form video platforms like TikTok, with an 8% share of primary music listeners, are a fast-growing medium. Several young artists have found initial success and traction using these platforms over the past few years.
And though video “killed the radio star,” it hasn’t killed listening to music on the radio. A healthy, 17% of respondents picked radio as their primary avenue for listening to music.
Streaming Supremacy and Virality
There’s no doubt that the internet has revolutionized how music is being consumed.
Including all video and music streaming, internet-based music consumption was the primary choice for 64% of respondents. That’s not even accounting for livestreams or music purchased through the internet.
| Platform | Share |
|---|---|
| Internet-based | 64% |
| Non-Internet Based | 37% |
This internet-heavy metric is being reflected on the business side as well, with 75% of the music industry’s revenues in the U.S. coming from streaming.
However, for artists, streaming revenue is usually the third-biggest earner after live performances and sales.
But utilizing streaming to its fullest potential keeps modern artists in the loop. For example, Beyoncé was one of the first artists to utilize streaming platforms to release an album completely unannounced in 2013, a marketing move that has been replicated many times since.
Source: IFPI
Data note: IFPI surveyed over 44,000 people from 22 countries, asking them about their primary mode of consuming music. They exclude India and China from their global figures to prevent the size of the population from influencing the global weighted average. Percentages may also not add up to 100 because of rounded figures.

This article was published as a part of Visual Capitalist's Creator Program, which features data-driven visuals from some of our favorite Creators around the world.


Technology
All of the Grants Given by the U.S. CHIPS Act
Intel, TSMC, and more have received billions in subsidies from the U.S. CHIPS Act in 2024.


All of the Grants Given by the U.S. CHIPS Act
This was originally posted on our Voronoi app. Download the app for free on iOS or Android and discover incredible data-driven charts from a variety of trusted sources.
This visualization shows which companies are receiving grants from the U.S. CHIPS Act, as of April 25, 2024. The CHIPS Act is a federal statute signed into law by President Joe Biden that authorizes $280 billion in new funding to boost domestic research and manufacturing of semiconductors.
The grant amounts visualized in this graphic are intended to accelerate the production of semiconductor fabrication plants (fabs) across the United States.
Data and Company Highlights
The figures we used to create this graphic were collected from a variety of public news sources. The Semiconductor Industry Association (SIA) also maintains a tracker for CHIPS Act recipients, though at the time of writing it does not have the latest details for Micron.
| Company | Federal Grant Amount | Anticipated Investment From Company |
|---|---|---|
| 🇺🇸 Intel | $8,500,000,000 | $100,000,000,000 |
| 🇹🇼 TSMC | $6,600,000,000 | $65,000,000,000 |
| 🇰🇷 Samsung | $6,400,000,000 | $45,000,000,000 |
| 🇺🇸 Micron | $6,100,000,000 | $50,000,000,000 |
| 🇺🇸 GlobalFoundries | $1,500,000,000 | $12,000,000,000 |
| 🇺🇸 Microchip | $162,000,000 | N/A |
| 🇬🇧 BAE Systems | $35,000,000 | N/A |
BAE Systems was not included in the graphic due to size limitations
Intel’s Massive Plans
Intel is receiving the largest share of the pie, with $8.5 billion in grants (plus an additional $11 billion in government loans). This grant accounts for 22% of the CHIPS Act’s total subsidies for chip production.
From Intel’s side, the company is expected to invest $100 billion to construct new fabs in Arizona and Ohio, while modernizing and/or expanding existing fabs in Oregon and New Mexico. Intel could also claim another $25 billion in credits through the U.S. Treasury Department’s Investment Tax Credit.
TSMC Expands its U.S. Presence
TSMC, the world’s largest semiconductor foundry company, is receiving a hefty $6.6 billion to construct a new chip plant with three fabs in Arizona. The Taiwanese chipmaker is expected to invest $65 billion into the project.
The plant’s first fab will be up and running in the first half of 2025, leveraging 4 nm (nanometer) technology. According to TrendForce, the other fabs will produce chips on more advanced 3 nm and 2 nm processes.
The Latest Grant Goes to Micron
Micron, the only U.S.-based manufacturer of memory chips, is set to receive $6.1 billion in grants to support its plans of investing $50 billion through 2030. This investment will be used to construct new fabs in Idaho and New York.

-

 Culture7 days ago
The World’s Top Media Franchises by All-Time Revenue
-

 Science2 weeks ago
Visualizing the Average Lifespans of Mammals
-

 Brands2 weeks ago
How Tech Logos Have Evolved Over Time
-

 Energy2 weeks ago
Ranked: The Top 10 EV Battery Manufacturers in 2023
-

 Countries2 weeks ago
Countries With the Largest Happiness Gains Since 2010
-

 Economy2 weeks ago
VC+: Get Our Key Takeaways From the IMF’s World Economic Outlook
-

 Demographics2 weeks ago
The Countries That Have Become Sadder Since 2010
-

 Money2 weeks ago
Charted: Who Has Savings in This Economy?