Markets
Top Heavy: Countries by Share of the Global Economy


Countries by Share of the Global Economy
As 2022 comes to a close we can recap many historic milestones of the year, like the Earth’s population hitting 8 billion and the global economy surpassing $100 trillion.
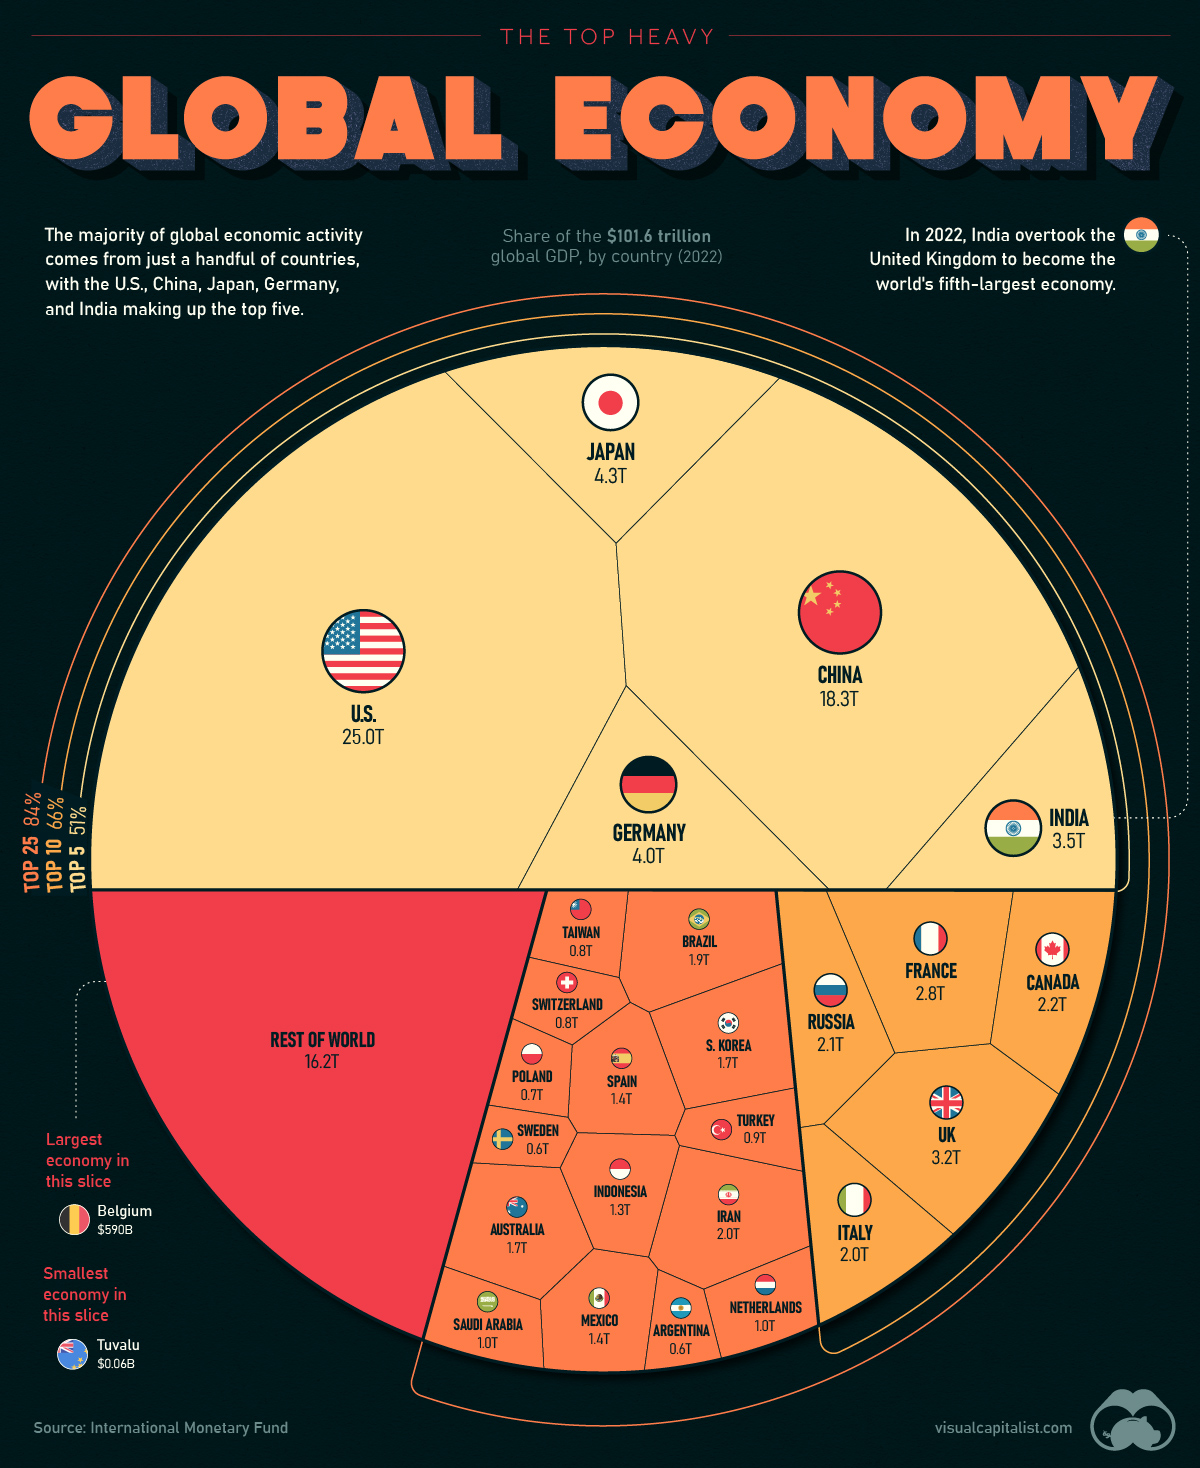
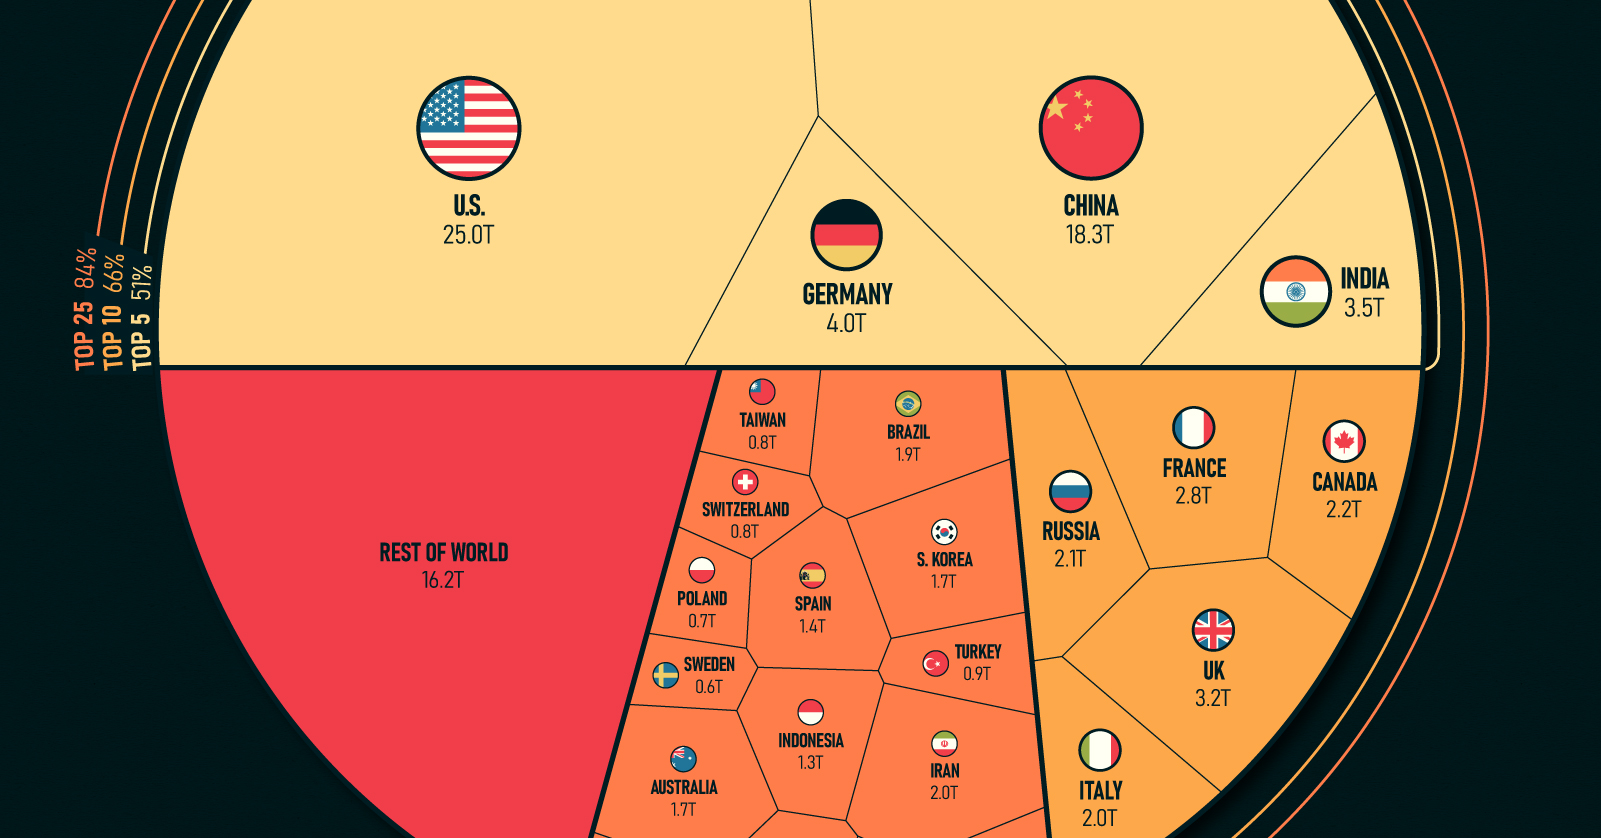
In this chart, we visualize the world’s GDP using data from the IMF, showcasing the biggest economies and the share of global economic activity that they make up.
The GDP Heavyweights
The global economy can be thought of as a pie, with the size of each slice representing the share of global GDP contributed by each country. Currently, the largest slices of the pie are held by the United States, China, Japan, Germany, and India, which together account for more than half of global GDP.
Here’s a look at every country’s share of the world’s $101.6 trillion economy:
| Rank | Country | GDP (Billions, USD) |
|---|---|---|
| #1 | 🇺🇸 United States | $25,035.2 |
| #2 | 🇨🇳 China | $18,321.2 |
| #3 | 🇯🇵 Japan | $4,300.6 |
| #4 | 🇩🇪 Germany | $4,031.1 |
| #5 | 🇮🇳 India | $3,468.6 |
| #6 | 🇬🇧 United Kingdom | $3,198.5 |
| #7 | 🇫🇷 France | $2,778.1 |
| #8 | 🇨🇦 Canada | $2,200.4 |
| #9 | 🇷🇺 Russia | $2,133.1 |
| #10 | 🇮🇹 Italy | $1,997.0 |
| #11 | 🇮🇷 Iran | $1,973.7 |
| #12 | 🇧🇷 Brazil | $1,894.7 |
| #13 | 🇰🇷 South Korea | $1,734.2 |
| #14 | 🇦🇺 Australia | $1,724.8 |
| #15 | 🇲🇽 Mexico | $1,424.5 |
| #16 | 🇪🇸 Spain | $1,389.9 |
| #17 | 🇮🇩 Indonesia | $1,289.4 |
| #18 | 🇸🇦 Saudi Arabia | $1,010.6 |
| #19 | 🇳🇱 Netherlands | $990.6 |
| #20 | 🇹🇷 Turkey | $853.5 |
| #21 | 🇹🇼 Taiwan | $828.7 |
| #22 | 🇨🇭 Switzerland | $807.4 |
| #23 | 🇵🇱 Poland | $716.3 |
| #24 | 🇦🇷 Argentina | $630.7 |
| #25 | 🇸🇪 Sweden | $603.9 |
| #26 | 🇧🇪 Belgium | $589.5 |
| #27 | 🇹🇭 Thailand | $534.8 |
| #28 | 🇮🇱 Israel | $527.2 |
| #29 | 🇮🇪 Ireland | $519.8 |
| #30 | 🇳🇴 Norway | $504.7 |
| #31 | 🇳🇬 Nigeria | $504.2 |
| #32 | 🇦🇪 United Arab Emirates | $503.9 |
| #33 | 🇪🇬 Egypt | $469.1 |
| #34 | 🇦🇹 Austria | $468.0 |
| #35 | 🇧🇩 Bangladesh | $460.8 |
| #36 | 🇲🇾 Malaysia | $434.1 |
| #37 | 🇸🇬 Singapore | $423.6 |
| #38 | 🇻🇳 Vietnam | $413.8 |
| #39 | 🇿🇦 South Africa | $411.5 |
| #40 | 🇵🇭 Philippines | $401.7 |
| #41 | 🇩🇰 Denmark | $386.7 |
| #42 | 🇵🇰 Pakistan | $376.5 |
| #43 | 🇭🇰 Hong Kong SAR | $368.4 |
| #44 | 🇨🇴 Colombia | $342.9 |
| #45 | 🇨🇱 Chile | $310.9 |
| #46 | 🇷🇴 Romania | $299.9 |
| #47 | 🇨🇿 Czech Republic | $295.6 |
| #48 | 🇮🇶 Iraq | $282.9 |
| #49 | 🇫🇮 Finland | $281.4 |
| #50 | 🇵🇹 Portugal | $255.9 |
| #51 | 🇳🇿 New Zealand | $242.7 |
| #52 | 🇵🇪 Peru | $239.3 |
| #53 | 🇰🇿 Kazakhstan | $224.3 |
| #54 | 🇬🇷 Greece | $222.0 |
| #55 | 🇶🇦 Qatar | $221.4 |
| #56 | 🇩🇿 Algeria | $187.2 |
| #57 | 🇭🇺 Hungary | $184.7 |
| #58 | 🇰🇼 Kuwait | $183.6 |
| #59 | 🇲🇦 Morocco | $142.9 |
| #60 | 🇦🇴 Angola | $124.8 |
| #61 | 🇵🇷 Puerto Rico | $118.7 |
| #62 | 🇪🇨 Ecuador | $115.5 |
| #63 | 🇰🇪 Kenya | $114.9 |
| #64 | 🇸🇰 Slovakia | $112.4 |
| #65 | 🇩🇴 Dominican Republic | $112.4 |
| #66 | 🇪🇹 Ethiopia | $111.2 |
| #67 | 🇴🇲 Oman | $109.0 |
| #68 | 🇬🇹 Guatemala | $91.3 |
| #69 | 🇧🇬 Bulgaria | $85.0 |
| #70 | 🇱🇺 Luxembourg | $82.2 |
| #71 | 🇻🇪 Venezuela | $82.1 |
| #72 | 🇧🇾 Belarus | $79.7 |
| #73 | 🇺🇿 Uzbekistan | $79.1 |
| #74 | 🇹🇿 Tanzania | $76.6 |
| #75 | 🇬🇭 Ghana | $76.0 |
| #76 | 🇹🇲 Turkmenistan | $74.4 |
| #77 | 🇱🇰 Sri Lanka | $73.7 |
| #78 | 🇺🇾 Uruguay | $71.2 |
| #79 | 🇵🇦 Panama | $71.1 |
| #80 | 🇦🇿 Azerbaijan | $70.1 |
| #81 | 🇭🇷 Croatia | $69.4 |
| #82 | 🇨🇮 Côte d'Ivoire | $68.6 |
| #83 | 🇨🇷 Costa Rica | $68.5 |
| #84 | 🇱🇹 Lithuania | $68.0 |
| #85 | 🇨🇩 Democratic Republic of the Congo | $63.9 |
| #86 | 🇷🇸 Serbia | $62.7 |
| #87 | 🇸🇮 Slovenia | $62.2 |
| #88 | 🇲🇲 Myanmar | $59.5 |
| #89 | 🇺🇬 Uganda | $48.4 |
| #90 | 🇯🇴 Jordan | $48.1 |
| #91 | 🇹🇳 Tunisia | $46.3 |
| #92 | 🇨🇲 Cameroon | $44.2 |
| #93 | 🇧🇭 Bahrain | $43.5 |
| #94 | 🇧🇴 Bolivia | $43.4 |
| #95 | 🇸🇩 Sudan | $42.8 |
| #96 | 🇵🇾 Paraguay | $41.9 |
| #97 | 🇱🇾 Libya | $40.8 |
| #98 | 🇱🇻 Latvia | $40.6 |
| #99 | 🇪🇪 Estonia | $39.1 |
| #100 | 🇳🇵 Nepal | $39.0 |
| #101 | 🇿🇼 Zimbabwe | $38.3 |
| #102 | 🇸🇻 El Salvador | $32.0 |
| #103 | 🇵🇬 Papua New Guinea | $31.4 |
| #104 | 🇭🇳 Honduras | $30.6 |
| #105 | 🇹🇹 Trinidad and Tobago | $29.3 |
| #106 | 🇰🇭 Cambodia | $28.3 |
| #107 | 🇮🇸 Iceland | $27.7 |
| #108 | 🇾🇪 Yemen | $27.6 |
| #109 | 🇸🇳 Senegal | $27.5 |
| #110 | 🇿🇲 Zambia | $27.0 |
| #111 | 🇨🇾 Cyprus | $26.7 |
| #112 | 🇬🇪 Georgia | $25.2 |
| #113 | 🇧🇦 Bosnia and Herzegovina | $23.7 |
| #114 | 🇲🇴 Macao SAR | $23.4 |
| #115 | 🇬🇦 Gabon | $22.2 |
| #116 | 🇭🇹 Haiti | $20.2 |
| #117 | 🇬🇳 Guinea | $19.7 |
| #118 | West Bank and Gaza | $18.8 |
| #119 | 🇧🇳 Brunei | $18.5 |
| #120 | 🇲🇱 Mali | $18.4 |
| #121 | 🇧🇫 Burkina Faso | $18.3 |
| #122 | 🇦🇱 Albania | $18.3 |
| #123 | 🇧🇼 Botswana | $18.0 |
| #124 | 🇲🇿 Mozambique | $17.9 |
| #125 | 🇦🇲 Armenia | $17.7 |
| #126 | 🇧🇯 Benin | $17.5 |
| #127 | 🇲🇹 Malta | $17.2 |
| #128 | 🇬🇶 Equatorial Guinea | $16.9 |
| #129 | 🇱🇦 Laos | $16.3 |
| #130 | 🇯🇲 Jamaica | $16.1 |
| #131 | 🇲🇳 Mongolia | $15.7 |
| #132 | 🇳🇮 Nicaragua | $15.7 |
| #133 | 🇲🇬 Madagascar | $15.1 |
| #134 | 🇬🇾 Guyana | $14.8 |
| #135 | 🇳🇪 Niger | $14.6 |
| #136 | 🇨🇬 Republic of Congo | $14.5 |
| #137 | 🇲🇰 North Macedonia | $14.1 |
| #138 | 🇲🇩 Moldova | $14.0 |
| #139 | 🇹🇩 Chad | $12.9 |
| #140 | 🇧🇸 The Bahamas | $12.7 |
| #141 | 🇳🇦 Namibia | $12.5 |
| #142 | 🇷🇼 Rwanda | $12.1 |
| #143 | 🇲🇼 Malawi | $11.6 |
| #144 | 🇲🇺 Mauritius | $11.5 |
| #145 | 🇲🇷 Mauritania | $10.1 |
| #146 | 🇹🇯 Tajikistan | $10.0 |
| #147 | 🇰🇬 Kyrgyzstan | $9.8 |
| #148 | 🇽🇰 Kosovo | $9.2 |
| #149 | 🇸🇴 Somalia | $8.4 |
| #150 | 🇹🇬 Togo | $8.4 |
| #151 | 🇲🇪 Montenegro | $6.1 |
| #152 | 🇲🇻 Maldives | $5.9 |
| #153 | 🇧🇧 Barbados | $5.8 |
| #154 | 🇫🇯 Fiji | $4.9 |
| #155 | 🇸🇸 South Sudan | $4.8 |
| #156 | 🇸🇿 Eswatini | $4.7 |
| #157 | 🇸🇱 Sierra Leone | $4.1 |
| #158 | 🇱🇷 Liberia | $3.9 |
| #159 | 🇩🇯 Djibouti | $3.7 |
| #160 | 🇧🇮 Burundi | $3.7 |
| #161 | 🇦🇼 Aruba | $3.5 |
| #162 | 🇦🇩 Andorra | $3.3 |
| #163 | 🇸🇷 Suriname | $3.0 |
| #164 | 🇧🇹 Bhutan | $2.7 |
| #165 | 🇧🇿 Belize | $2.7 |
| #166 | 🇱🇸 Lesotho | $2.5 |
| #167 | 🇨🇫 Central African Republic | $2.5 |
| #168 | 🇹🇱 Timor-Leste | $2.4 |
| #169 | 🇪🇷 Eritrea | $2.4 |
| #170 | 🇬🇲 The Gambia | $2.1 |
| #171 | 🇨🇻 Cabo Verde | $2.1 |
| #172 | 🇸🇨 Seychelles | $2.0 |
| #173 | 🇱🇨 St. Lucia | $2.0 |
| #174 | 🇦🇬 Antigua and Barbuda | $1.7 |
| #175 | 🇬🇼 Guinea-Bissau | $1.6 |
| #176 | 🇸🇲 San Marino | $1.6 |
| #177 | 🇸🇧 Solomon Islands | $1.6 |
| #178 | 🇰🇲 Comoros | $1.2 |
| #179 | 🇬🇩 Grenada | $1.2 |
| #180 | 🇰🇳 St. Kitts and Nevis | $1.1 |
| #181 | 🇻🇺 Vanuatu | $1.0 |
| #182 | 🇻🇨 St. Vincent and the Grenadines | $1.0 |
| #183 | 🇼🇸 Samoa | $0.83 |
| #184 | 🇩🇲 Dominica | $0.60 |
| #185 | 🇸🇹 São Tomé and Príncipe | $0.51 |
| #186 | 🇹🇴 Tonga | $0.50 |
| #187 | 🇫🇲 Micronesia | $0.43 |
| #188 | 🇲🇭 Marshall Islands | $0.27 |
| #189 | 🇵🇼 Palau | $0.23 |
| #190 | 🇰🇮 Kiribati | $0.21 |
| #191 | 🇳🇷 Nauru | $0.13 |
| #192 | 🇹🇻 Tuvalu | $0.06 |
| #193 | 🇺🇦 Ukraine | Data not available |
| Total World GDP | $101,559.3 |
Just five countries make up more than half of the world’s entire GDP in 2022: the U.S., China, Japan, India, and Germany. Interestingly, India replaced the UK this year as a top five economy.
Adding on another five countries (the top 10) makes up 66% of the global economy, and the top 25 countries comprise 84% of global GDP.
The World’s Smallest Economies
The rest of the world — the remaining 167 nations — make up 16% of global GDP. Many of the smallest economies are islands located in Oceania.
Here’s a look at the 20 smallest economies in the world:
| Country | GDP (Billions, USD) |
|---|---|
| 🇹🇻 Tuvalu | $0.06 |
| 🇳🇷 Nauru | $0.13 |
| 🇰🇮 Kiribati | $0.21 |
| 🇵🇼 Palau | $0.23 |
| 🇲🇭 Marshall Islands | $0.27 |
| 🇫🇲 Micronesia | $0.43 |
| 🇹🇴 Tonga | $0.50 |
| 🇸🇹 São Tomé and Príncipe | $0.51 |
| 🇩🇲 Dominica | $0.60 |
| 🇼🇸 Samoa | $0.83 |
| 🇻🇨 St. Vincent and the Grenadines | $0.95 |
| 🇻🇺 Vanuatu | $0.98 |
| 🇰🇳 St. Kitts and Nevis | $1.12 |
| 🇬🇩 Grenada | $1.19 |
| 🇰🇲 Comoros | $1.24 |
| 🇸🇧 Solomon Islands | $1.60 |
| 🇸🇲 San Marino | $1.62 |
| 🇬🇼 Guinea-Bissau | $1.62 |
| 🇦🇬 Antigua and Barbuda | $1.69 |
| 🇱🇨 St. Lucia | $1.97 |
Tuvalu has the smallest GDP of any country at just $64 million. Tuvalu is one of a dozen nations with a GDP of less than one billion dollars.
The Global Economy in 2023
Heading into 2023, there is much economic uncertainty. Many experts are anticipating a brief recession, although opinions differ on the definition of “brief”.
Some experts believe that China will buck the trend of economic downturn. If this prediction comes true, the country could own an even larger slice of the global GDP pie in the near future.
See what hundreds of experts are predicting for 2023 with our Global Forecast Series.
Where does this data come from?
Source: IMF (International Monetary Fund)
Data note: Due to conflict and other issues, some countries are not included in this data set (e.g. Ukraine, Syria, Afghanistan). Major sources for GDP data differ widely on the size of Iran’s economy. It’s worth noting that this data from IMF ranks Iran’s GDP much higher than World Bank or the UN.


Markets
Visualizing Global Inflation Forecasts (2024-2026)
Here are IMF forecasts for global inflation rates up to 2026, highlighting a slow descent of price pressures amid resilient global growth.


Visualizing Global Inflation Forecasts (2024-2026)
Global inflation rates are gradually descending, but progress has been slow.
Today, the big question is if inflation will decline far enough to trigger easing monetary policy. So far, the Federal Reserve has held rates for nine months amid stronger than expected core inflation, which excludes volatile energy and food prices.
Yet looking further ahead, inflation forecasts from the International Monetary Fund (IMF) suggest that inflation will decline as price pressures ease, but the path of disinflation is not without its unknown risks.
This graphic shows global inflation forecasts, based on data from the April 2024 IMF World Economic Outlook.
Get the Key Insights of the IMF’s World Economic Outlook
Want a visual breakdown of the insights from the IMF’s 2024 World Economic Outlook report?
This visual is part of a special dispatch of the key takeaways exclusively for VC+ members.
Get the full dispatch of charts by signing up to VC+.
The IMF’s Inflation Outlook
Below, we show the IMF’s latest projections for global inflation rates through to 2026:
| Year | Global Inflation Rate (%) | Advanced Economies Inflation Rate (%) | Emerging Market and Developing Economies Inflation Rate (%) |
|---|---|---|---|
| 2019 | 3.5 | 1.4 | 5.1 |
| 2020 | 3.2 | 0.7 | 5.2 |
| 2021 | 4.7 | 3.1 | 5.9 |
| 2022 | 8.7 | 7.3 | 9.8 |
| 2023 | 6.8 | 4.6 | 8.3 |
| 2024 | 5.9 | 2.6 | 8.3 |
| 2025 | 4.5 | 2.0 | 6.2 |
| 2026 | 3.7 | 2.0 | 4.9 |
After hitting a peak of 8.7% in 2022, global inflation is projected to fall to 5.9% in 2024, reflecting promising inflation trends amid resilient global growth.
While inflation has largely declined due to falling energy and goods prices, persistently high services inflation poses challenges to mitigating price pressures. In addition, the IMF highlights the potential risk of an escalating conflict in the Middle East, which could lead to energy price shocks and higher shipping costs.
These developments could negatively affect inflation scenarios and prompt central banks to adopt tighter monetary policies. Overall, by 2026, global inflation is anticipated to decline to 3.7%—still notably above the 2% target set by several major economies.
Adding to this, we can see divergences in the path of inflation between advanced and emerging economies. While affluent nations are forecast to see inflation edge closer to the 2% target by 2026, emerging economies are projected to have inflation rates reach 4.9%—falling closer to their pre-pandemic averages.
Get the Full Analysis of the IMF’s Outlook on VC+
This visual is part of an exclusive special dispatch for VC+ members which breaks down the key takeaways from the IMF’s 2024 World Economic Outlook.
For the full set of charts and analysis, sign up for VC+.

-

 Culture7 days ago
The World’s Top Media Franchises by All-Time Revenue
-

 Science2 weeks ago
Visualizing the Average Lifespans of Mammals
-

 Brands2 weeks ago
How Tech Logos Have Evolved Over Time
-

 Energy2 weeks ago
Ranked: The Top 10 EV Battery Manufacturers in 2023
-

 Demographics2 weeks ago
Countries With the Largest Happiness Gains Since 2010
-

 Economy2 weeks ago
VC+: Get Our Key Takeaways From the IMF’s World Economic Outlook
-

 Demographics2 weeks ago
The Countries That Have Become Sadder Since 2010
-

 Money1 week ago
Charted: Who Has Savings in This Economy?