Energy
Copper: Driving the Green Energy Revolution

Copper: Driving the Green Energy Revolution
Copper is known as “man’s first metal”, and for over 10,000 years, it’s been used in applications ranging from architecture to coinage.
However, it was Michael Faraday’s discovery of electromagnetic induction in 1831 that turned demand on its head for the red metal. As the world used more and more electricity, copper became known as the obvious choice as an electrical conductor.
Every year, humans already gobble up around 28 million tonnes of the metal in uses mainly related to its electrical properties – and as we transition to a green energy paradigm, copper will be an even more vital ingredient to human progress than it is today.
Copper in Green Energy
Today’s infographic comes to us from Kutcho Copper, and it dives into copper’s applications with a focus on those in renewable energy.
Renewable energy systems consume approximately five times more copper than conventional power generation systems, making the metal essential for any successful transition to fossil fuel alternatives.
To understand why renewables are so copper intensive, consider that around two hundred 3-megawatt (MW) wind turbines are needed to replace one large steam coal or gas turbine.
Schroders, British asset manager
Looking at data per MW strengthens this case.
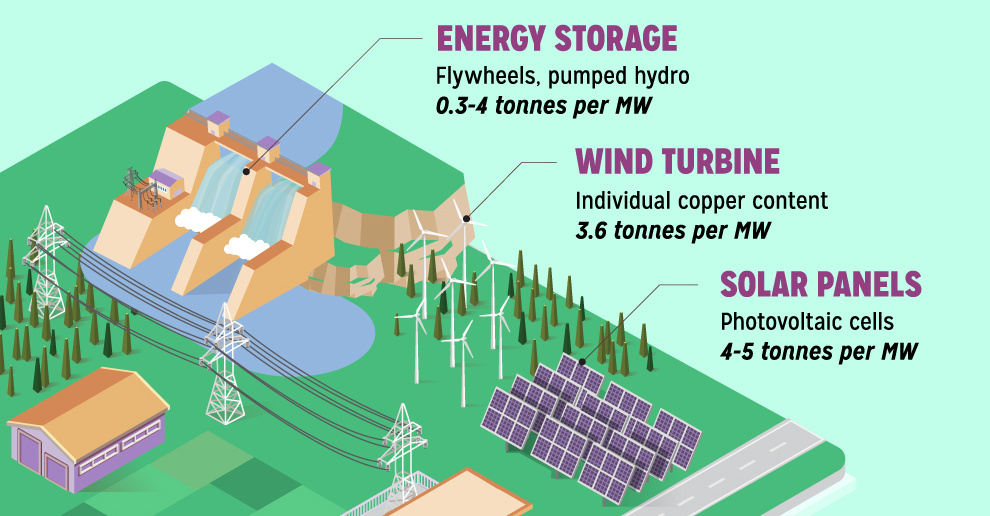
For every MW of wind power about 3.6 tonnes of copper is needed – and for every MW of photovoltaic solar capacity, about 4-5 tonnes of copper is required.
Further, roughly three times more copper is used for electric vehicles in comparison to conventional gas-powered vehicles. This alone could create a new major source of copper demand, and Schroders notes that if all 80 million new car sales were EVs today, that it would require 6 million tonnes of additional copper.
While this helps give a sense of perspective, let’s instead look at a less hypothetical case.
By 2035, Bloomberg projects a 43% penetration of EVs in the light-duty vehicle market, which will be roughly equal to 110 million cars. Using the above ratios, that’s about 3.6 million tonnes of extra copper demand – equal to about 15% of the current market.
New Copper Sources?
Despite more copper being needed for green applications, there are some questions around where this new metal may come from.
Copper projects are notoriously large-scale in size, and the pipeline of new projects is the lowest in a century. As a result, analysts are expecting that the long-anticipated supply crunch might come sooner than expected.

Who’s Building the Most Solar Energy?
This was originally posted on our Voronoi app. Download the app for free on iOS or Android and discover incredible data-driven charts from a variety of trusted sources.
In 2023, solar energy accounted for three-quarters of renewable capacity additions worldwide. Most of this growth occurred in Asia, the EU, and the U.S., continuing a trend observed over the past decade.
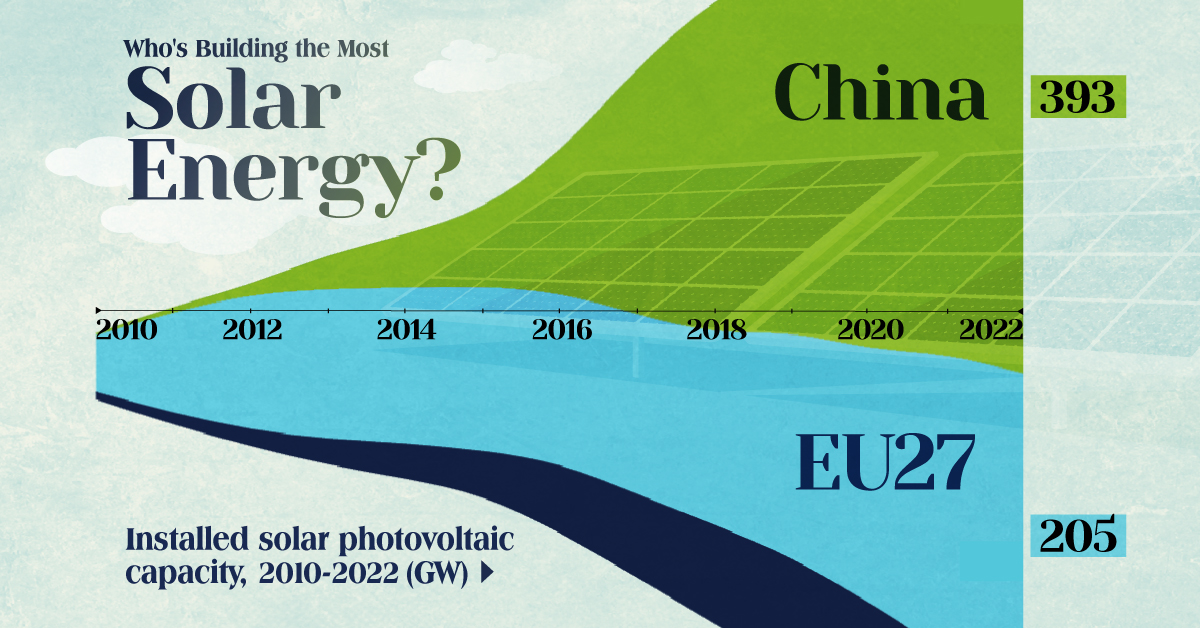
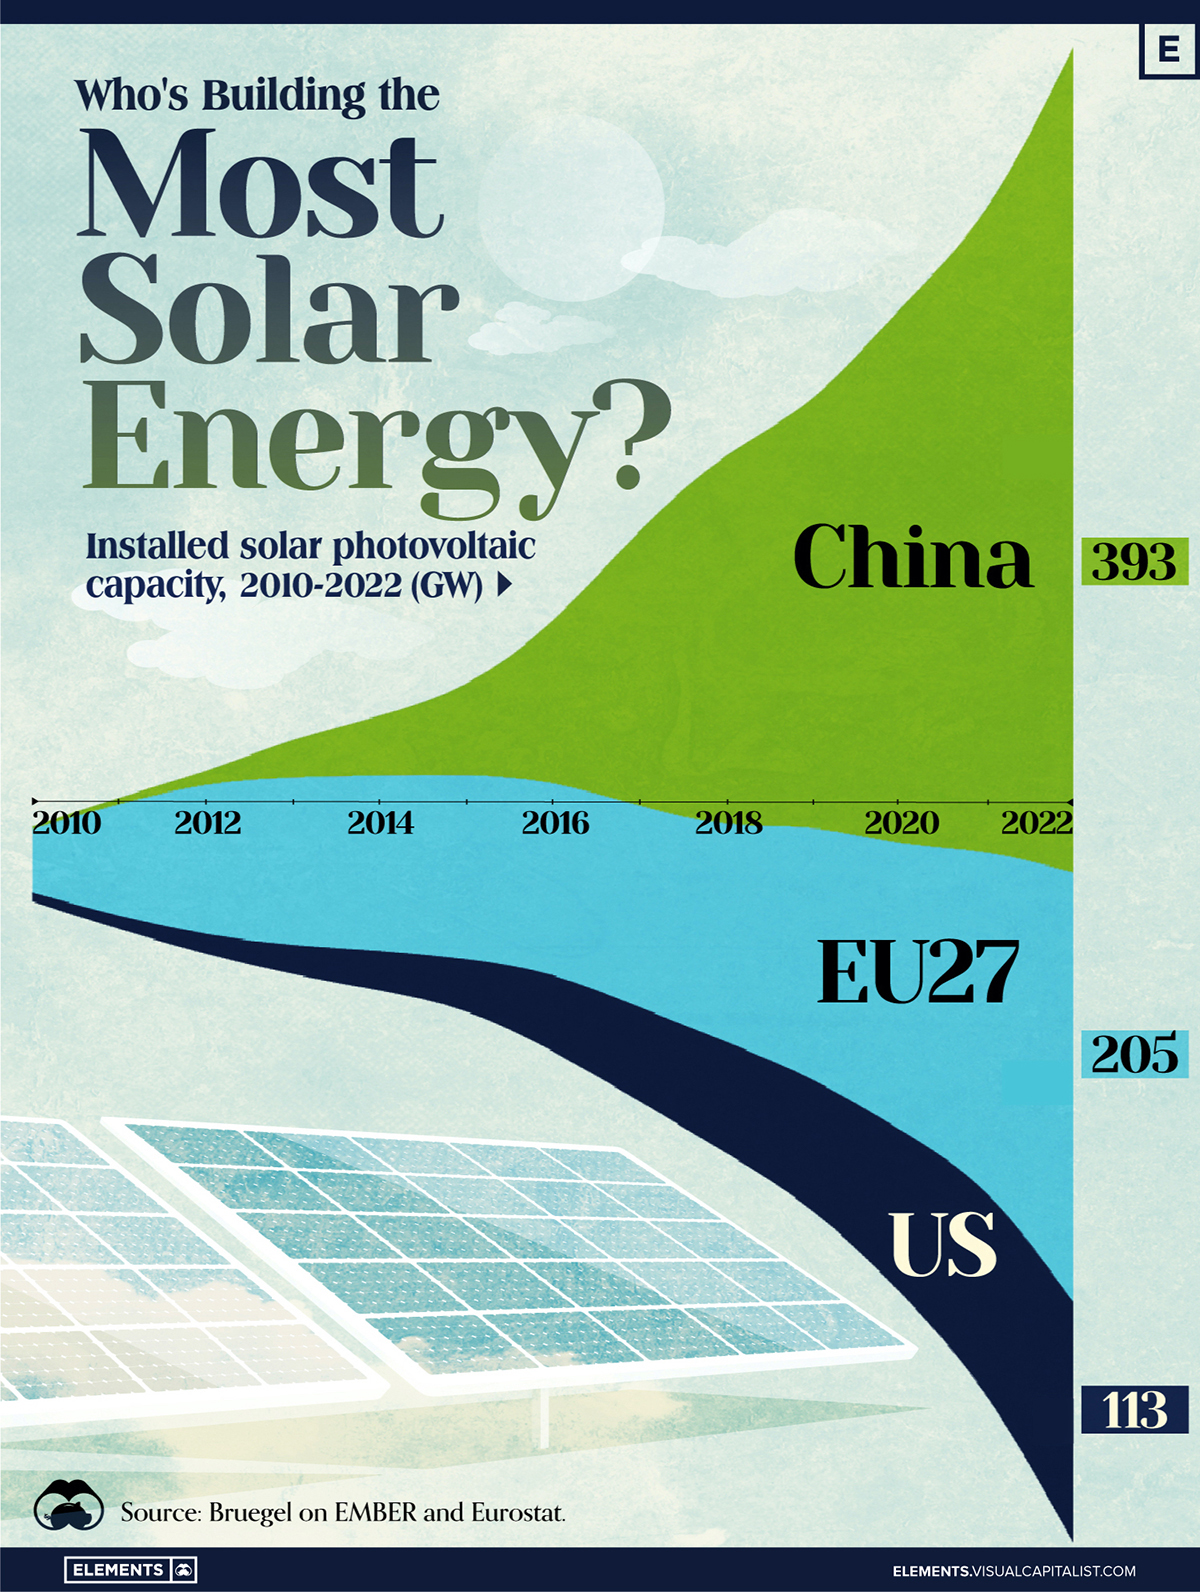
In this graphic, we illustrate the rise in installed solar photovoltaic (PV) capacity in China, the EU, and the U.S. between 2010 and 2022, measured in gigawatts (GW). Bruegel compiled the data..
Chinese Dominance
As of 2022, China’s total installed capacity stands at 393 GW, nearly double that of the EU’s 205 GW and surpassing the USA’s total of 113 GW by more than threefold in absolute terms.
| Installed solar capacity (GW) | China | EU27 | U.S. |
|---|---|---|---|
| 2022 | 393.0 | 205.5 | 113.0 |
| 2021 | 307.0 | 162.7 | 95.4 |
| 2020 | 254.0 | 136.9 | 76.4 |
| 2019 | 205.0 | 120.1 | 61.6 |
| 2018 | 175.3 | 104.0 | 52.0 |
| 2017 | 130.8 | 96.2 | 43.8 |
| 2016 | 77.8 | 91.5 | 35.4 |
| 2015 | 43.6 | 87.7 | 24.2 |
| 2014 | 28.4 | 83.6 | 18.1 |
| 2013 | 17.8 | 79.7 | 13.3 |
| 2012 | 6.7 | 71.1 | 8.6 |
| 2011 | 3.1 | 53.3 | 5.6 |
| 2010 | 1.0 | 30.6 | 3.4 |
Since 2017, China has shown a compound annual growth rate (CAGR) of approximately 25% in installed PV capacity, while the USA has seen a CAGR of 21%, and the EU of 16%.
Additionally, China dominates the production of solar power components, currently controlling around 80% of the world’s solar panel supply chain.
In 2022, China’s solar industry employed 2.76 million individuals, with manufacturing roles representing approximately 1.8 million and the remaining 918,000 jobs in construction, installation, and operations and maintenance.
The EU industry employed 648,000 individuals, while the U.S. reached 264,000 jobs.
According to the IEA, China accounts for almost 60% of new renewable capacity expected to become operational globally by 2028.
Despite the phasing out of national subsidies in 2020 and 2021, deployment of solar PV in China is accelerating. The country is expected to reach its national 2030 target for wind and solar PV installations in 2024, six years ahead of schedule.
-

 Markets6 days ago
The Most Valuable Companies in Major EU Economies
-

 Wealth2 weeks ago
Charted: Which City Has the Most Billionaires in 2024?
-

 Technology2 weeks ago
All of the Grants Given by the U.S. CHIPS Act
-

 Green2 weeks ago
The Carbon Footprint of Major Travel Methods
-

 United States1 week ago
Visualizing the Most Common Pets in the U.S.
-

 Culture1 week ago
The World’s Top Media Franchises by All-Time Revenue
-

 voronoi1 week ago
Best Visualizations of April on the Voronoi App
-

 Wealth1 week ago
Charted: Which Country Has the Most Billionaires in 2024?


