Mining
The History of North American Cooperation on Aluminum and Steel
As the global rhetoric around trade heats up, aluminum and steel are two metals that have been unexpectedly thrust into the international spotlight.
Both metals are getting considerable attention as journalists and pundits analyze how tariffs may impact international markets and trade relations. But in that coverage so far, one thing that may have been missed is the interesting history and context of these metals, especially within the framework of trade in North America.
Aluminum and Steel in North America
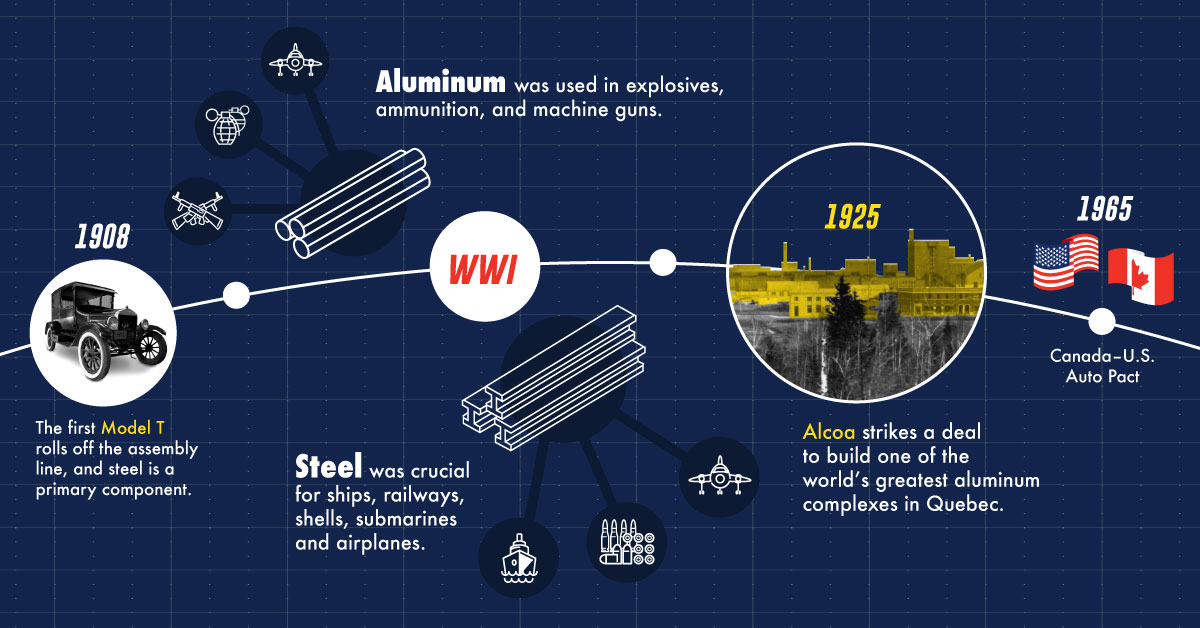
Today’s infographic tells the story of an ongoing North American partnership in these goods, and how this cooperation even helped U.S. and Canadian efforts in World War 2, as well as in addressing other issues of national security.

Aluminum and steel are metals that are not only essential for industry to thrive, but they are also needed to build infrastructure and to ensure national security.
Because of the importance of these metals, countries in North America have been cooperating for many decades to guarantee the best possible supply chains for both aluminum and steel.
The History: Aluminum and Steel
Here are some of the major events that involve the two metals, from the perspective of North American trade and cooperation.
1899
The Pittsburgh Reduction Company, later the Aluminum Company of America (Alcoa), begins construction of a power plant and aluminum smelter in Shawinigan Falls, Quebec.
1901
The company produces the first aluminum ever on Canadian soil.
1902
This Canadian division is renamed the Northern Aluminum Company
New Uses & WW1
1903
The Wright brothers use aluminum in their first plane at Kitty Hawk, North Carolina.
1908
The first Model T rolls off the assembly line, and steel is a primary component.
1910
The U.S. and Canadian steel industries surround the Great Lakes region. At this point the U.S., produces more steel than any other country in the world.
1913
The US passes the Underwood Tariff, a general reduction in tariff rates that affected Canadian exporters. Zero or near-zero tariffs were introduced for steel. (The Canadian Encylopedia)
1914
At this point, 80% of American-made cars had aluminum crank and gear cases.
World War I
The Great War breaks out. It’s the first ever “modern war”, and metals become strategically important in a way like never before. For the first three years, the U.S. helps the Allies – including Canada – which is already at war, by providing supplies.
Steel was crucial for ships, railways, shells, submarines and airplanes. Meanwhile, aluminum was used in explosives, ammunition, and machine guns – and the Liberty V12 engine, which powered Allied planes, was 1/3 aluminum.
During this stretch, America produced three times as much steel as Germany and Austria. By the end of the war, military usage of aluminum is sucking up 90% of all North American production.
Interwar Period
1919
After the war, the interruption of European aluminum shipments to North America drives up Northern Aluminum sales to the United States. In 1919, U.S. aluminum imports from Northern Aluminum totals 5,643 tons, while all European producers add up to 2,360 tons.
1925
After aluminum gains post-war acceptance from consumers, Alcoa uses this new momentum to strike a deal to build one of the world’s greatest aluminum complexes in Quebec on the Saguenay River.
These facilities become the base for Northern Aluminum, which changes its name to the Aluminum Company of Canada (Alcan). By 1927, the area includes an entire new company town (Arvida), a 27,000 ton smelter, and a hydro power plant. This complex would eventually become the world’s largest aluminum production site for WWII.
1929
The “Roaring Twenties” saw consumer culture take off, with autos and appliances flying off the shelves. Steel and aluminum demand continues to soar.
World War II
1940
Canada and the U.S. establish the Permanent Joint Board on Defense, still in operation today. Near the same time, the Canadian-American defense industrial alliance, known as the Defense Production Sharing Program, is also established.
1941
Canada and the U.S. agree to coordinate production of war materials to reduce duplication, and to allow each country to specialize, with The Hyde Park Declaration of 1941.
The principles of this declaration recognize North America as a single, integrated defense industrial base.
1942
Canada builds the Bagotville airbase to protect the aluminum complex and hydro plants of the Saguenay region, which were crucial in supplying American and Canadian forces. A Hawker Hurricane squadron is permanently stationed, to protect the area.
1945
The Saguenay facilities were so prolific that Canada supplied 40% of the Allies’ total aluminum production.
“The record proves that in peaceful commerce the combined efforts of our countries can produce outstanding results. Our trade with each other is far greater than that of any other two nations on earth.” – Harry Truman, 33rd U.S. President, 1947
Cold War & North American Integration
1952
The U.S. focuses on Canadian resources after the President’s Materials Policy Commission warns of future shortages of various metals, which could make the U.S. dependent on insecure foreign sources during times of conflict.
1956
Canada and the U.S. sign the Defense Production Sharing Agreement, which aims to maintain a balance in trade for defense products. At this point, Canada relies on the U.S. for military technology – and the U.S. relies on Canada for important military inputs.
1959
The St. Lawrence Seaway opens, providing ocean-going vessels access to Canadian and U.S. ports on the Great Lakes. This facilitates the shipping of iron ore, steel, and aluminum.
1965
The Canada-U.S. Auto Pact allows for the integration of the Canadian and US auto industries in a shared North American market. This paves the way for iron ore, steel, and aluminum trade.
1989
The U.S. and Canada sign a free trade agreement, which eventually gets rolled into NAFTA in 1994.
Modern Aluminum and Steel Trade
Today
The U.S. and Canada are each other’s best international customer for a variety of goods – including steel and aluminum.


Lithium
Ranked: The Top 10 EV Battery Manufacturers in 2023
Asia dominates this ranking of the world’s largest EV battery manufacturers in 2023.


The Top 10 EV Battery Manufacturers in 2023
This was originally posted on our Voronoi app. Download the app for free on iOS or Android and discover incredible data-driven charts from a variety of trusted sources.
Despite efforts from the U.S. and EU to secure local domestic supply, all major EV battery manufacturers remain based in Asia.
In this graphic we rank the top 10 EV battery manufacturers by total battery deployment (measured in megawatt-hours) in 2023. The data is from EV Volumes.
Chinese Dominance
Contemporary Amperex Technology Co. Limited (CATL) has swiftly risen in less than a decade to claim the title of the largest global battery group.
The Chinese company now has a 34% share of the market and supplies batteries to a range of made-in-China vehicles, including the Tesla Model Y, SAIC’s MG4/Mulan, and various Li Auto models.
| Company | Country | 2023 Production (megawatt-hour) | Share of Total Production |
|---|---|---|---|
| CATL | 🇨🇳 China | 242,700 | 34% |
| BYD | 🇨🇳 China | 115,917 | 16% |
| LG Energy Solution | 🇰🇷 Korea | 108,487 | 15% |
| Panasonic | 🇯🇵 Japan | 56,560 | 8% |
| SK On | 🇰🇷 Korea | 40,711 | 6% |
| Samsung SDI | 🇰🇷 Korea | 35,703 | 5% |
| CALB | 🇨🇳 China | 23,493 | 3% |
| Farasis Energy | 🇨🇳 China | 16,527 | 2% |
| Envision AESC | 🇨🇳 China | 8,342 | 1% |
| Sunwoda | 🇨🇳 China | 6,979 | 1% |
| Other | - | 56,040 | 8% |
In 2023, BYD surpassed LG Energy Solution to claim second place. This was driven by demand from its own models and growth in third-party deals, including providing batteries for the made-in-Germany Tesla Model Y, Toyota bZ3, Changan UNI-V, Venucia V-Online, as well as several Haval and FAW models.
The top three battery makers (CATL, BYD, LG) collectively account for two-thirds (66%) of total battery deployment.
Once a leader in the EV battery business, Panasonic now holds the fourth position with an 8% market share, down from 9% last year. With its main client, Tesla, now sourcing batteries from multiple suppliers, the Japanese battery maker seems to be losing its competitive edge in the industry.
Overall, the global EV battery market size is projected to grow from $49 billion in 2022 to $98 billion by 2029, according to Fortune Business Insights.

-

 Mining1 week ago
Gold vs. S&P 500: Which Has Grown More Over Five Years?
-

 Markets2 weeks ago
Ranked: The Most Valuable Housing Markets in America
-

 Money2 weeks ago
Which States Have the Highest Minimum Wage in America?
-

 AI2 weeks ago
Ranked: Semiconductor Companies by Industry Revenue Share
-

 Markets2 weeks ago
Ranked: The World’s Top Flight Routes, by Revenue
-

 Countries2 weeks ago
Population Projections: The World’s 6 Largest Countries in 2075
-

 Markets2 weeks ago
The Top 10 States by Real GDP Growth in 2023
-

 Demographics2 weeks ago
The Smallest Gender Wage Gaps in OECD Countries