Datastream
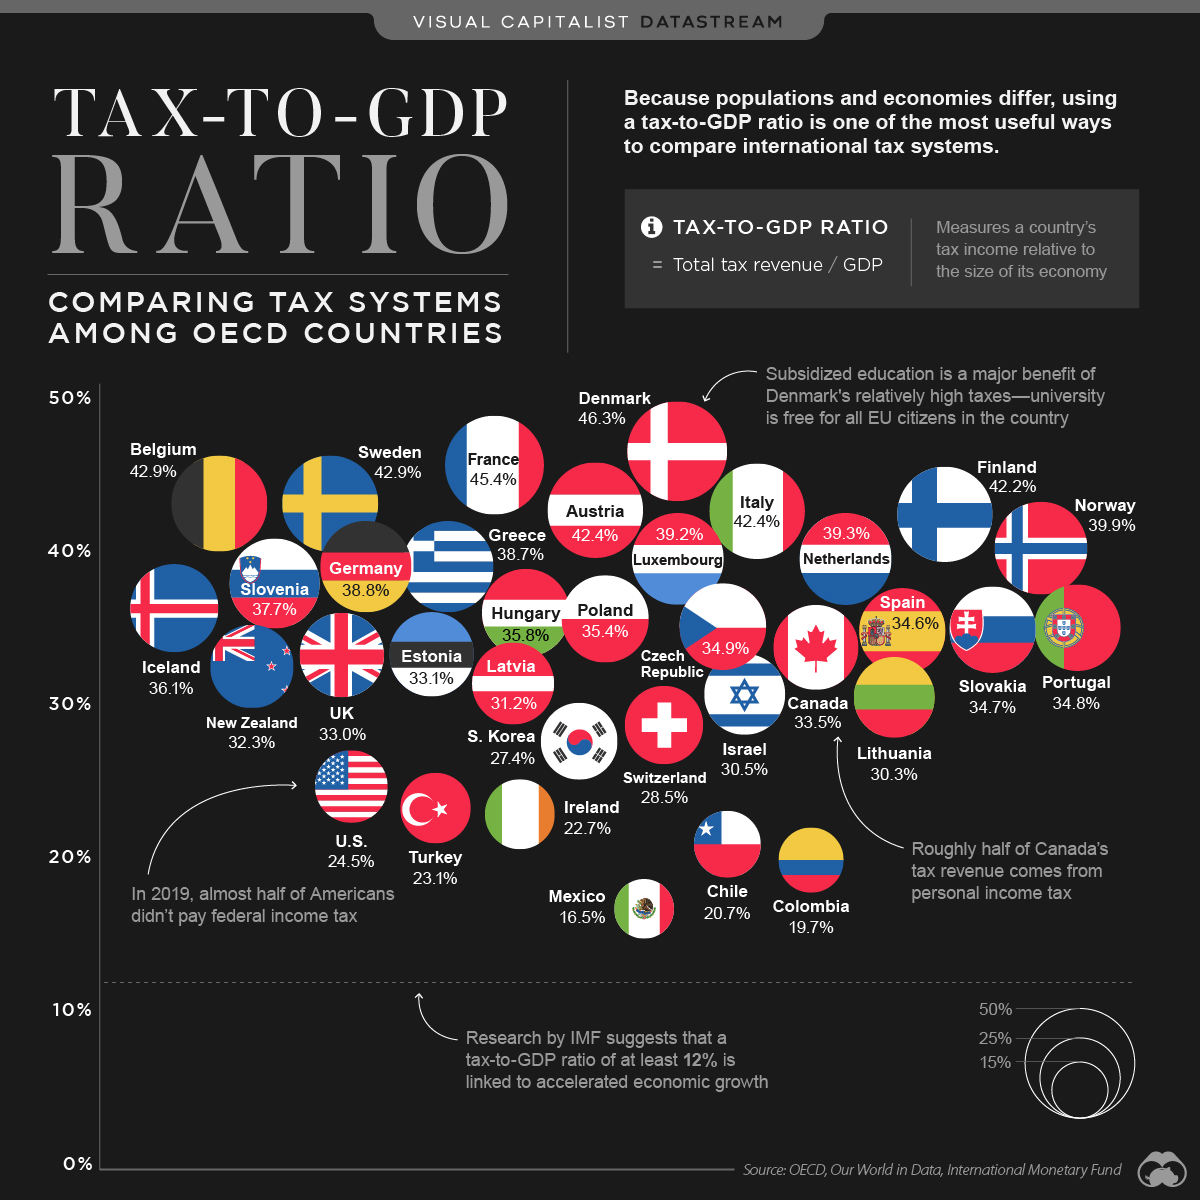
Tax-to-GDP Ratio: Comparing Tax Systems Around the World


The Briefing
- The tax-to-GDP ratio measures a country’s tax revenue, relative to the size of its economy (measured by its Gross Domestic Product, or GDP)
- A higher tax-to-GDP ratio means more money is going to government coffers, and in theory, public services like education and infrastructure
- Out of 35 OECD countries, Denmark has the highest tax-to-GDP ratio at 46.3%, while Mexico ranks last at 16.5%
Tax-to-GDP Ratio: Comparing Tax Systems Around the World
Taxes are an important source of revenue for most countries. In fact, taxes provide around 50% or more of government funds in almost every country in the world.
How does each country’s tax system compare to one another? This question is tricky to answer. Since countries’ populations and economies differ greatly, measuring total tax revenue is not the best way to compare international tax systems.
Instead, using a tax-to-GDP ratio is one of the more useful ways to compare tax systems around the world.
What is the Tax-to-GDP Ratio?
The tax-to-GDP ratio compares a country’s tax revenue to the size of its economy, which in this case is measured by its GDP.
The higher the ratio, the higher the proportion of money that goes to government coffers. If managed effectively, this can support the long-term health and prosperity of an economy. According to research conducted by the International Monetary Fund, countries should have a tax-to-GDP ratio of at least 12% in order to experience accelerated economic growth.
The countries that are part of the Organisation for Economic Co-operation and Development (OECD) all meet that threshold, with an average tax-to-GDP ratio of 33.8%.
Ranked: The Tax-to-GDP Ratios of OECD countries
The dataset used for this graphic looks at 35 of the 37 OECD countries, since recent data for Australia and Japan was not available.
| Rank | Country | Tax Revenue as % of GDP |
|---|---|---|
| 1 | 🇩🇰 Denmark | 46.3% |
| 2 | 🇫🇷 France | 45.4% |
| 3 | 🇧🇪 Belgium | 42.9% |
| 4 | 🇸🇪 Sweden | 42.9% |
| 5 | 🇦🇹 Austria | 42.4% |
| 6 | 🇮🇹 Italy | 42.4% |
| 7 | 🇫🇮 Finland | 42.2% |
| 8 | 🇳🇴 Norway | 39.9% |
| 9 | 🇳🇱 Netherlands | 39.3% |
| 10 | 🇱🇺 Luxembourg | 39.2% |
| 11 | 🇩🇪 Germany | 38.8% |
| 12 | 🇬🇷 Greece | 38.7% |
| 13 | 🇸🇮 Slovenia | 37.7% |
| 14 | 🇮🇸 Iceland | 36.1% |
| 15 | 🇭🇺 Hungary | 35.8% |
| 16 | 🇵🇱 Poland | 35.4% |
| 17 | 🇨🇿 Czech Republic | 34.9% |
| 18 | 🇵🇹 Portugal | 34.8% |
| 19 | 🇸🇰 Slovak Republic | 34.7% |
| 20 | 🇪🇸 Spain | 34.6% |
| 21 | 🇨🇦 Canada | 33.5% |
| 22 | 🇪🇪 Estonia | 33.1% |
| 23 | 🇬🇧 United Kingdom | 33.0% |
| 24 | 🇳🇿 New Zealand | 32.3% |
| 25 | 🇱🇻 Latvia | 31.2% |
| 26 | 🇮🇱 Israel | 30.5% |
| 27 | 🇱🇹 Lithuania | 30.3% |
| 28 | 🇨🇭 Switzerland | 28.5% |
| 29 | 🇰🇷 South Korea | 27.4% |
| 30 | 🇺🇸 United States | 24.5% |
| 31 | 🇹🇷 Turkey | 23.1% |
| 32 | 🇮🇪 Ireland | 22.7% |
| 33 | 🇨🇱 Chile | 20.7% |
| 34 | 🇨🇴 Colombia | 19.7% |
| 35 | 🇲🇽 Mexico | 16.5% |
| OECD Average | 33.8% |
At 46.3%, Denmark has the highest ratio on the list. The country puts its relatively high tax revenue to use, particularly when it comes to subsidizing post-secondary education—in Denmark, university is free for all EU citizens.
On the less-taxed end of the spectrum, the U.S. ranks 30 out of 35, with a ratio of 24.5%—that’s notably lower than the OECD average of 33.8%. It’s also worth mentioning that the U.S. has one of the highest GDP per capita measures out of all OECD countries.
Where does America’s tax revenue come from? It gains most of its revenue from the personal income tax. In fact, 41% of the country’s total tax revenue comes from taxes on personal income, as well as individual profits and gains—for context, the OECD average is 24%.
With President Biden’s recent announcement to increase corporate taxes and personal investment gains, America’s ratio could look a lot different in the near future.
>>Like this? You might find this article interesting, Unequal State Tax Burdens Across America
Where does this data come from?
Source: OECD
Details: This source uses 2019 provisional data to calculate each country’s tax-to-GDP ratio. For more information on methodology, read the full report by clicking here.


Datastream
Charting the Rise of Cross-Border Money Transfers (2015-2023)
With over 280 million immigrants transferring billions of dollars annually, the remittance industry has become more valuable than ever.
The Briefing
- 79% of remittance payments in 2022 were made to low and middle-income countries.
- Borderless, low-cost money transfer services like those provided by Wise can help immigrants support their families.
The Rise of Cross-Border Money Transfers
The remittance industry has experienced consistent growth recently, solidifying its position as a key component of the global financial landscape. Defined as the transfer of money from one country to another, usually to support a dependent, remittances play a pivotal role in providing food, healthcare, and education.
In this graphic, sponsored by Scottish Mortgage, we delve into the growth of the remittance industry, and the key factors propelling its success.
Powered by Immigration
With over 280 million immigrants worldwide, the remittance industry has an important place in our global society.
By exporting billions of dollars annually back to their starting nations, immigrants can greatly improve the livelihoods of their families and communities.
This is particularly true for low and middle-income countries, who in 2022 received, on average, 79% of remittance payments, according to Knomad, an initiative of the World Bank.
| Year | Low/Middle Income (US$ Billion) | World Total (US$ Billion) |
|---|---|---|
| 2015 | $447B | $602B |
| 2016 | $440B | $596B |
| 2017 | $477B | $638B |
| 2018 | $524B | $694B |
| 2019 | $546B | $722B |
| 2020 | $542B | $711B |
| 2021 | $597B | $781B |
| 2022 | $626B | $794B |
| 2023 | $639B | $815B |
India is one of the global leaders in receiving remittance payments. In 2022 alone, over $100 billion in remittances were sent to India, supporting many families.
Enter Wise
As the global remittance industry continues to grow, it is important to acknowledge the role played by innovative money transfer operators like Wise.
With an inclusive, user-centric platform and competitive exchange rates, Wise makes it easy and cost-effective for millions of individuals to send money home, worldwide.
Connection Without Borders
But Wise doesn’t just offer remittance solutions, the company offers a host of account services and a payment infrastructure that has helped over 6.1 million active customers move over $30 billion in the first quarter of 2023 alone.
Want to invest in transformative companies like Wise?
Discover Scottish Mortgage Investment Trust, a portfolio of some of the world’s most exciting growth companies.

-

 Mining1 week ago
Gold vs. S&P 500: Which Has Grown More Over Five Years?
-

 Markets2 weeks ago
Ranked: The Most Valuable Housing Markets in America
-

 Money2 weeks ago
Which States Have the Highest Minimum Wage in America?
-

 AI2 weeks ago
Ranked: Semiconductor Companies by Industry Revenue Share
-

 Markets2 weeks ago
Ranked: The World’s Top Flight Routes, by Revenue
-

 Countries2 weeks ago
Population Projections: The World’s 6 Largest Countries in 2075
-

 Markets2 weeks ago
The Top 10 States by Real GDP Growth in 2023
-

 Demographics2 weeks ago
The Smallest Gender Wage Gaps in OECD Countries