Markets
The Economic Impact of Violence
The Economic Impact of Violence
The Chart of the Week is a weekly Visual Capitalist feature on Fridays.
When you regularly buy goods or services, it helps fuel the economy at both the local and national level.
But what if you live in a place like Syria, that is torn apart by a seven-year long civil war?
Aside from the obvious humanitarian costs, these dire circumstances would ultimately change your spending behavior, how businesses operate, and how capital gets utilized. The fact is that conflicts, homicides, terrorism, and other types of violence can hinder productivity and wealth creation, and this ultimately has an impact on families around the world.
Calculating an Economic Impact
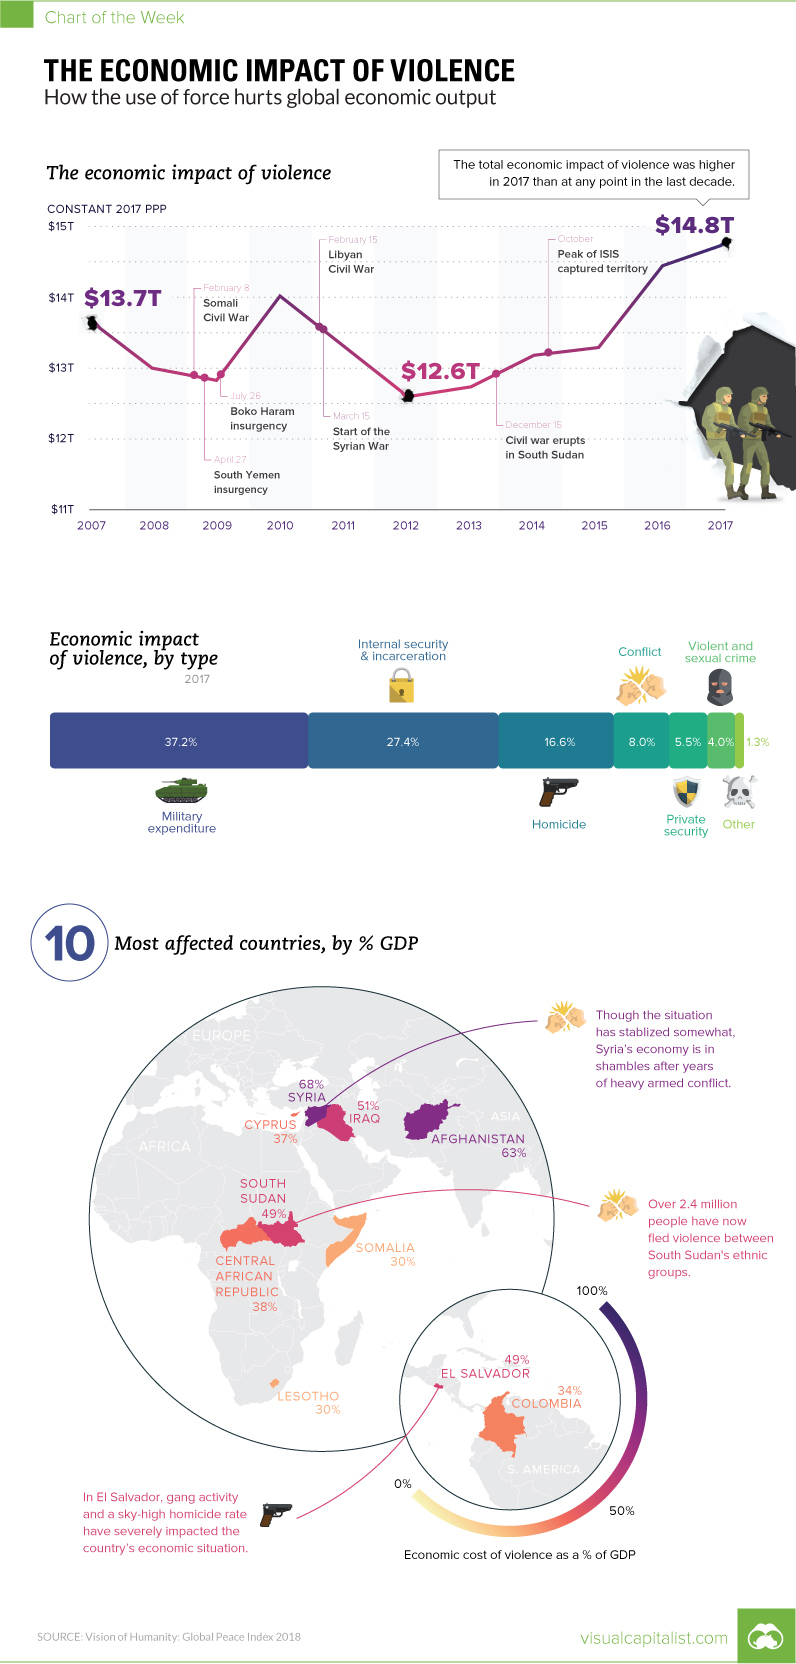
In today’s chart, we use data from the Global Peace Index 2018 report, which tries to put a figure on the expenditures and economic effects related to “containing, preventing and dealing with the consequences of violence”.
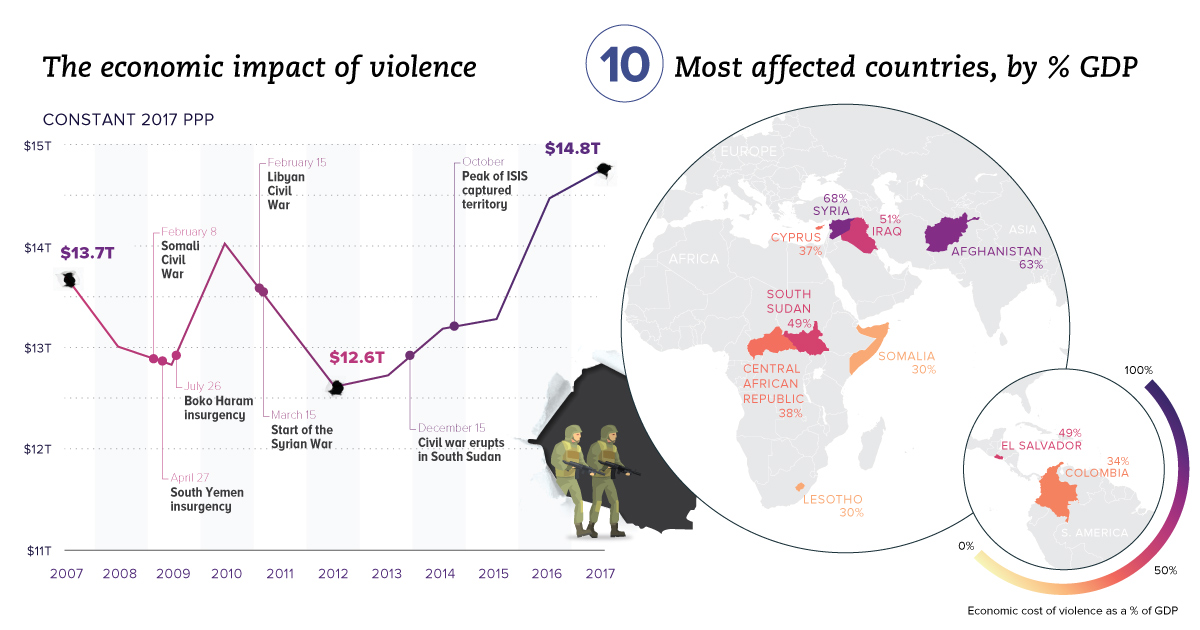
According to the report, the economic impact of violence to the global economy was $14.76 trillion in 2017 in constant purchasing power parity (PPP) terms. This is roughly 12.4% of world gross domestic product (GDP), or $1,988 per person.
While those figures themselves are quite staggering, how it all breaks down is even more interesting.
Violence by Type
Violence comes in many forms, so how does factor into the economic impact?
The Institute for Economics and Peace, the non-profit think tank that has authored the report for the last 12 years, breaks down economic impacts as follows:
| Type of economic impact | Share of total |
|---|---|
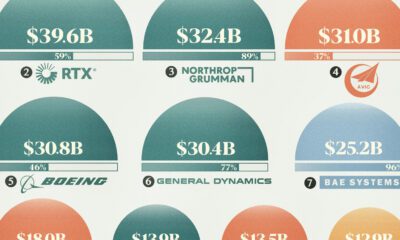
| Military expenditures | 37.2% |
| Internal security & incarceration | 27.4% |
| Homicide | 16.6% |
| Conflict | 8.0% |
| Private security | 5.5% |
| Violent & sexual crime | 4.0% |
| Other | 1.3% |
The vast majority of impact comes from military and security spending, which are both aimed at the prevention or containment of violence. Meanwhile, homicide and conflict – two more direct violent actions – are the next two biggest factors.
Here’s how this breaks down by region:
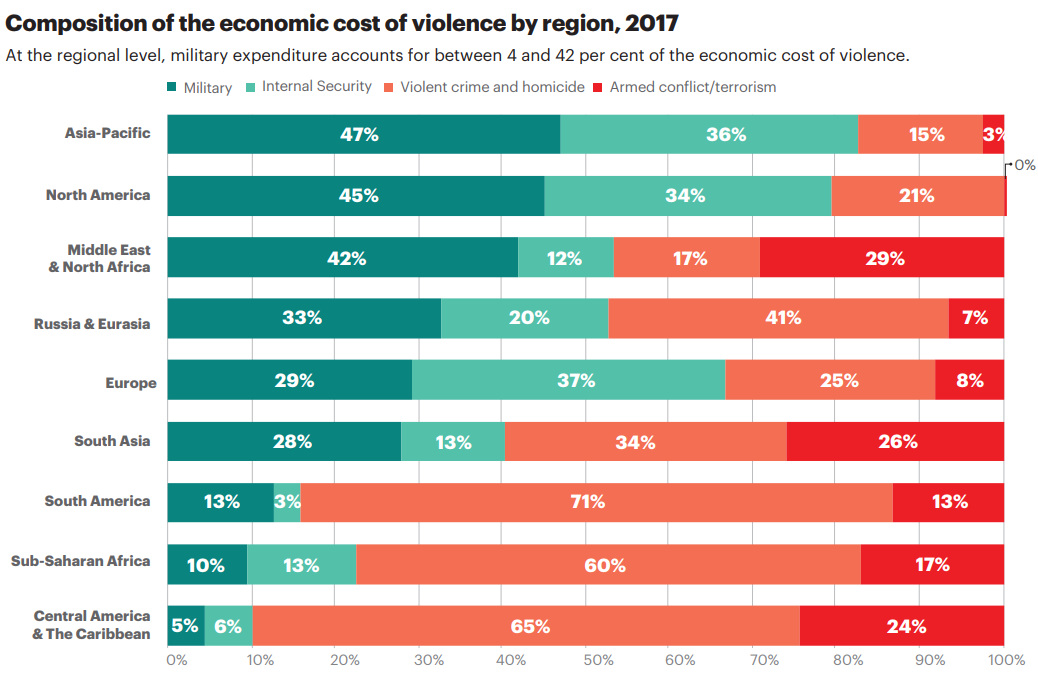
Dollars are going to military and security spending in North America, Asia-Pacific, and Europe. Meanwhile, it’s actual violence like homicides, conflict, and terrorism that cause economic havoc in South America, Central America, and Africa.
The Countries Most Affected
Which countries are impacted the most by violence, as a percentage of their GDP?
Here are the top 10, as per the report:
| Rank | Country | Economic impact (% of GDP) |
|---|---|---|
| #1 | Syria | 68% |
| #2 | Afghanistan | 63% |
| #3 | Iraq | 51% |
| #4 | El Salvador | 49% |
| #5 | South Sudan | 49% |
| #6 | Central African Republic | 38% |
| #7 | Cyprus | 37% |
| #8 | Colombia | 34% |
| #9 | Lesotho | 30% |
| #10 | Somalia | 30% |
Syria, which has been in its civil war for seven years now, is the country most affected by the economic impact of violence. Meanwhile, war-torn Afghanistan is not far behind.
Interestingly, the cost of violence in Latin American countries is comparable to regions that have been at war for years. El Salvador ranks a surprising fourth place, due to its issues with gang activity and a sky-high homicide rate, and Colombia makes the list as well.


Markets
The European Stock Market: Attractive Valuations Offer Opportunities
On average, the European stock market has valuations that are nearly 50% lower than U.S. valuations. But how can you access the market?


European Stock Market: Attractive Valuations Offer Opportunities
Europe is known for some established brands, from L’Oréal to Louis Vuitton. However, the European stock market offers additional opportunities that may be lesser known.
The above infographic, sponsored by STOXX, outlines why investors may want to consider European stocks.
Attractive Valuations
Compared to most North American and Asian markets, European stocks offer lower or comparable valuations.
| Index | Price-to-Earnings Ratio | Price-to-Book Ratio |
|---|---|---|
| EURO STOXX 50 | 14.9 | 2.2 |
| STOXX Europe 600 | 14.4 | 2 |
| U.S. | 25.9 | 4.7 |
| Canada | 16.1 | 1.8 |
| Japan | 15.4 | 1.6 |
| Asia Pacific ex. China | 17.1 | 1.8 |
Data as of February 29, 2024. See graphic for full index names. Ratios based on trailing 12 month financials. The price to earnings ratio excludes companies with negative earnings.
On average, European valuations are nearly 50% lower than U.S. valuations, potentially offering an affordable entry point for investors.
Research also shows that lower price ratios have historically led to higher long-term returns.
Market Movements Not Closely Connected
Over the last decade, the European stock market had low-to-moderate correlation with North American and Asian equities.
The below chart shows correlations from February 2014 to February 2024. A value closer to zero indicates low correlation, while a value of one would indicate that two regions are moving in perfect unison.
| EURO STOXX 50 | STOXX EUROPE 600 | U.S. | Canada | Japan | Asia Pacific ex. China |
|
|---|---|---|---|---|---|---|
| EURO STOXX 50 | 1.00 | 0.97 | 0.55 | 0.67 | 0.24 | 0.43 |
| STOXX EUROPE 600 | 1.00 | 0.56 | 0.71 | 0.28 | 0.48 | |
| U.S. | 1.00 | 0.73 | 0.12 | 0.25 | ||
| Canada | 1.00 | 0.22 | 0.40 | |||
| Japan | 1.00 | 0.88 | ||||
| Asia Pacific ex. China | 1.00 |
Data is based on daily USD returns.
European equities had relatively independent market movements from North American and Asian markets. One contributing factor could be the differing sector weights in each market. For instance, technology makes up a quarter of the U.S. market, but health care and industrials dominate the broader European market.
Ultimately, European equities can enhance portfolio diversification and have the potential to mitigate risk for investors.
Tracking the Market
For investors interested in European equities, STOXX offers a variety of flagship indices:
| Index | Description | Market Cap |
|---|---|---|
| STOXX Europe 600 | Pan-regional, broad market | €10.5T |
| STOXX Developed Europe | Pan-regional, broad-market | €9.9T |
| STOXX Europe 600 ESG-X | Pan-regional, broad market, sustainability focus | €9.7T |
| STOXX Europe 50 | Pan-regional, blue-chip | €5.1T |
| EURO STOXX 50 | Eurozone, blue-chip | €3.5T |
Data is as of February 29, 2024. Market cap is free float, which represents the shares that are readily available for public trading on stock exchanges.
The EURO STOXX 50 tracks the Eurozone’s biggest and most traded companies. It also underlies one of the world’s largest ranges of ETFs and mutual funds. As of November 2023, there were €27.3 billion in ETFs and €23.5B in mutual fund assets under management tracking the index.
“For the past 25 years, the EURO STOXX 50 has served as an accurate, reliable and tradable representation of the Eurozone equity market.”
— Axel Lomholt, General Manager at STOXX
Partnering with STOXX to Track the European Stock Market
Are you interested in European equities? STOXX can be a valuable partner:
- Comprehensive, liquid and investable ecosystem
- European heritage, global reach
- Highly sophisticated customization capabilities
- Open architecture approach to using data
- Close partnerships with clients
- Part of ISS STOXX and Deutsche Börse Group
With a full suite of indices, STOXX can help you benchmark against the European stock market.
Learn how STOXX’s European indices offer liquid and effective market access.

-

 Economy2 days ago
Economic Growth Forecasts for G7 and BRICS Countries in 2024
The IMF has released its economic growth forecasts for 2024. How do the G7 and BRICS countries compare?
-

 Markets1 week ago
U.S. Debt Interest Payments Reach $1 Trillion
U.S. debt interest payments have surged past the $1 trillion dollar mark, amid high interest rates and an ever-expanding debt burden.
-

 United States2 weeks ago
Ranked: The Largest U.S. Corporations by Number of Employees
We visualized the top U.S. companies by employees, revealing the massive scale of retailers like Walmart, Target, and Home Depot.
-

 Markets2 weeks ago
The Top 10 States by Real GDP Growth in 2023
This graphic shows the states with the highest real GDP growth rate in 2023, largely propelled by the oil and gas boom.
-

 Markets2 weeks ago
Ranked: The World’s Top Flight Routes, by Revenue
In this graphic, we show the highest earning flight routes globally as air travel continued to rebound in 2023.
-

 Markets2 weeks ago
Ranked: The Most Valuable Housing Markets in America
The U.S. residential real estate market is worth a staggering $47.5 trillion. Here are the most valuable housing markets in the country.


-

 Mining1 week ago
Gold vs. S&P 500: Which Has Grown More Over Five Years?
-
Markets2 weeks ago
Ranked: The Most Valuable Housing Markets in America
-

 Money2 weeks ago
Which States Have the Highest Minimum Wage in America?
-

 AI2 weeks ago
Ranked: Semiconductor Companies by Industry Revenue Share
-
Markets2 weeks ago
Ranked: The World’s Top Flight Routes, by Revenue
-

 Demographics2 weeks ago
Population Projections: The World’s 6 Largest Countries in 2075
-
Markets2 weeks ago
The Top 10 States by Real GDP Growth in 2023
-

 Demographics2 weeks ago
The Smallest Gender Wage Gaps in OECD Countries