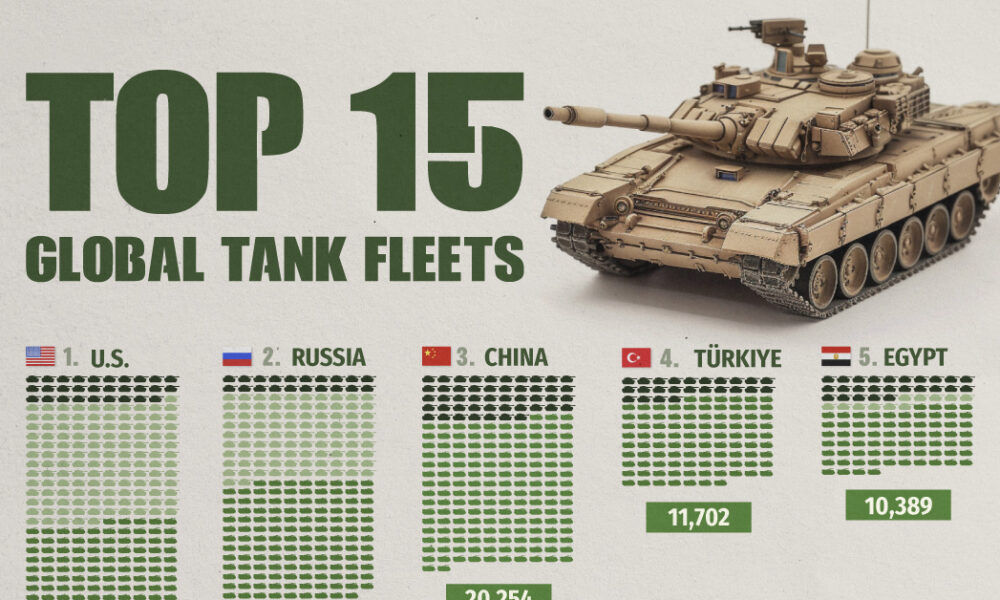
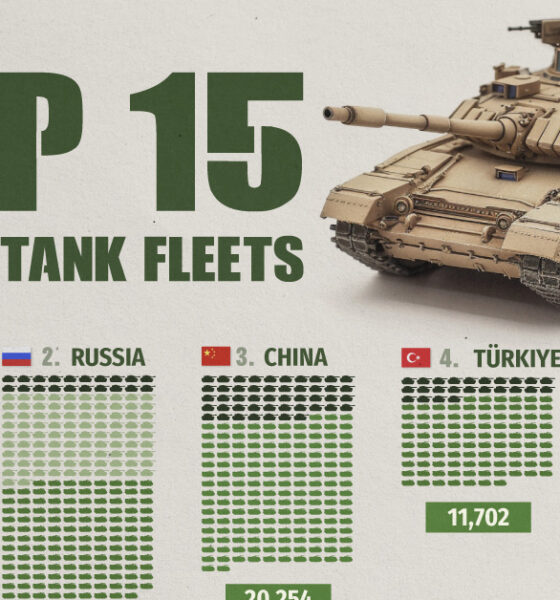
Heavily armed and armored, the modern tank is a versatile and mobile weapons platform, and a critical piece of contemporary...
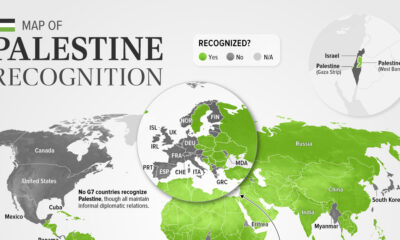

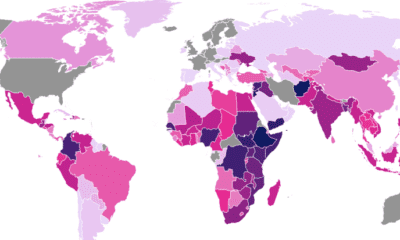
As of November 2023, 138 of the 193 UN members recognized Palestine. This map shows the recognition of the State of Palestine by country.
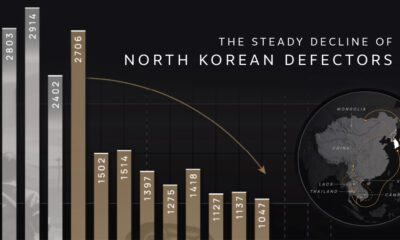

Why are the number of North Korean defectors decreasing? We cover the number of defectors by year and map their perilous escape routes.
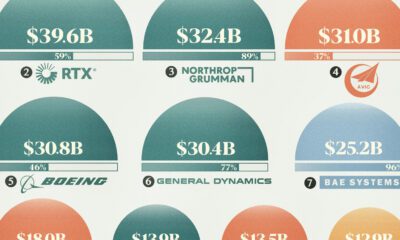

With billions in defense contracts handed out annually, who are the key players profiting? View this graphic to find out.

The U.S. provides over $50 billion in aid to more than 150 countries and territories annually.
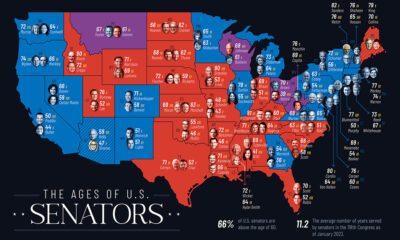

How old is the country's political establishment? We map the age of U.S. senators in every U.S. state to find out.
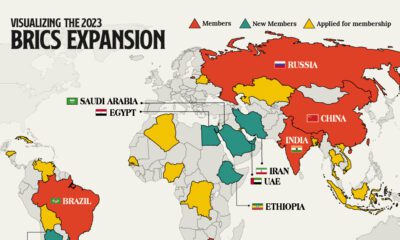

We provide a data-driven overview of how the recent BRICS expansion will grow the group’s influence and reach.
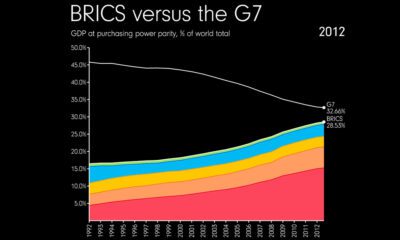

How fast have the economies of BRICS countries grown? This video highlights the rapid rise of BRICS compared to the G7.


What is the Chinese public's view of world powers? This visual breaks down Chinese sentiment towards other countries.


War in Europe has caused Ukraine's military spend to jump up by 640%. How do the world's largest military budgets compare?
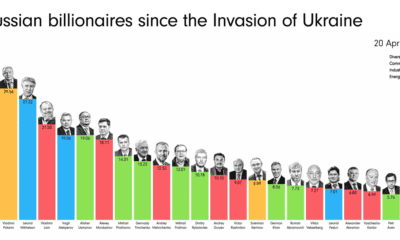

How have Russian billionaires fared since Russia's invasion of Ukraine? This animation tracks the wealth of 22 Russian billionaires.


 Creator Program